Category Archives: inflation forecasts

Inflation/Deflation – 3

Business forecasters often do not directly forecast inflation, but usually are consumers of inflation forecasts from specialized research organizations.

But there is a level of literacy that is good to achieve on the subject – something a quick study of recent, authoritative sources can convey.

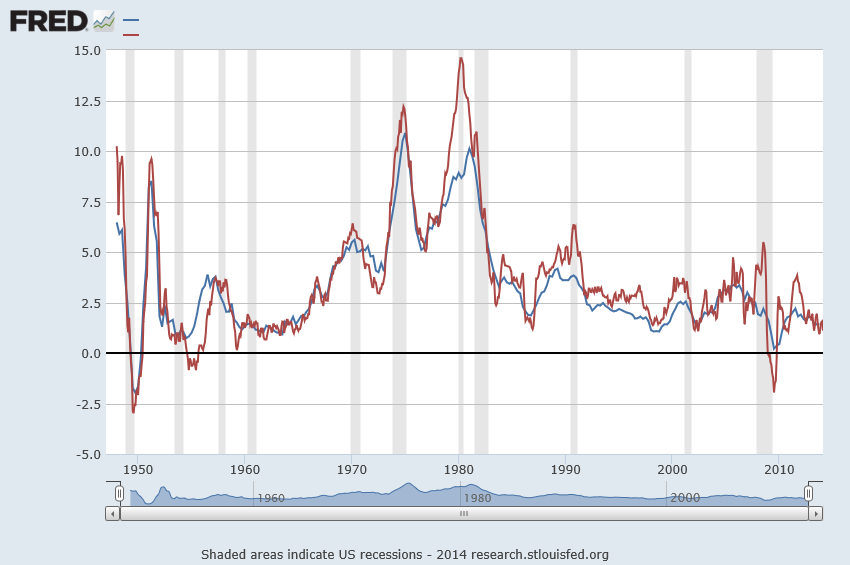
A good place to start is the following chart of US Consumer Price Index (CPI) and the GDP price index, both expressed in terms of year-over-year (yoy) percentage changes. The source is the St. Louis Federal Reserve FRED data site.

InflationFRED

The immediate post-WW II period and the 1970;s and 1980’s saw surging inflation. Since somewhere in the 1980’s and certainly after the early 1990’s, inflation has been on a downward trend.

Some Stylized Facts About Forecasting Inflation

James Stock and Mark Watson wrote an influential NBER (National Bureau of Economic Research) paper in 2006 titled Why Has US Inflation Become Harder to Forecast.

These authors point out that the rate of price inflation in the United States has become both harder and easier to forecast, depending on one’s point of view.

On the one hand, inflation (along with many other macroeconomic time series) is much less volatile than it was in the 1970s or early 1980s, and the root mean squared error of naïve inflation forecasts has declined sharply since the mid-1980s. In this sense, inflation has become easier to forecast: the risk of inflation forecasts, as measured by mean squared forecast errors (MSFE), has fallen.

On the other hand, multivariate forecasting models inspired by economic theory – such as the Phillips curve –lose ground to univariate forecasting models after the middle 1980’s or early 1990’s. The Phillips curve, of course, postulates a tradeoff between inflation and economic activity and is typically parameterized in inflationary expectations and the gap between potential and actual GDP.

A more recent paper Forecasting Inflation evaluates sixteen inflation forecast models and some judgmental projections. Root mean square prediction errors (RMSE’s) are calculated in quasi-realtime recursive out-of-sample data – basically what I would call “backcasts.” In other words, the historic data is divided into training and test samples. The models are estimated on the various possible training samples (involving, in this case, consecutive data) and forecasts from these estimated models are matched against the out-of-sample or test data.

The study suggests four principles. 

  1. Subjective forecasts do the best
  2. Good forecasts must account for a slowly varying local mean.
  3. The Nowcast is important and typically utilizes different techniques than standard forecasting
  4.  Heavy shrinkage in the use of information improves inflation forecasts

Interestingly, this study finds that judgmental forecasts (private sector surveys and the Greenbook) are remarkably hard to beat. Otherwise, most of the forecasting models fail to consistently trump a “naïve forecast” which is the average inflation rate over four previous periods.

What This Means

I’m willing to offer interpretations of these findings in terms of (a) the resilience of random walk models, and (b) the eclipse of unionized labor in the US.

So forecasting inflation as an average of several previous values suggests the underlying stochastic process is some type of random walk. Thus, the optimal forecast for a simple random walk is the most currently observed value. The optimal forecast for a random walk with noise is an exponentially weighted average of the past values of the series.

The random walk is a recurring theme in many macroeconomic forecasting contexts. It’s hard to beat.

As far as the Phillips curve goes, it’s not clear to me that the same types of tradeoffs between inflation and unemployment exist in the contemporary US economy, as did, say, in the 1950’s or 1960’s. The difference, I would guess, is the lower membership in and weaker power of unions. After the 1980’s, things began to change significantly on the labor front. Companies exacted concessions from unions, holding out the risk that the manufacturing operation might be moved abroad to a lower wage area, for instance. And manufacturing employment, the core of the old union power, fell precipitously.

As far as the potency of subjective forecasts – I’ll let Faust and Wright handle that. While these researchers find what they call subjective forecasts beat almost all the formal modeling approaches, I’ve seen other evaluations calling into question whether any inflation forecast beats a random walk approach consistently. I’ll have to dig out the references to make this stick.

Inflation/Deflation 1

I initially envisaged a series of posts on forecasting inflation, treating inflation/deflation as phenomena more or less at arms length.

However, I began assembling posts on this topic while in the US, before traveling to Japan – where currently I am (now in Osaka).  In Japan, I’m pulled by the attractions of all the sights, the temples, the great food, and it’s cherry blossom season. Also, I just brought a tablet, leaving the laptop at home. I find that finishing a blog post nicely is hard with this Android device.

But now I have something to say – and I add some of the details of the initial post I planned on at the end of these comments.

Deflation in Japan

It’s cherry blossom season in Japan, and hotel reservations got scarce. So we had to book in clean, reasonably priced hotels that still had space – and it turns out these are sometimes on the margins of what you might call “the party district.”

I think watching the revels of young people here – uproarious and loud, all night and well into the early morning – provides a flesh-and-blood side to the general movement of prices – in this case the on-and-off deflation in Japan.


Check out Japan and the Exhaustion of Consumerism.

So even though I am on the 8th floor of this really nice business hotel in Osaka, the “party district” is full of young Japanese men and women (what I would call at my advanced tenure “youth”). Anyone who thinks the Japanese are reserved and repressed should put their ear to my window high above the street, listen to the revels – the howls and screams, often in unison by groups – as people get more and more booze under their belts through the evening and then through until morning. Go down at 6am and you will find couples and groups staggering around, quite drunk or loud, unruly groups of guys…..

The Original Material

As with gold and interest rates, there are several steps in coming to grips with inflation forecasts, not the least of which is the immediate prospect for price change in various global regions and inflation forecast performance over various short and longer term forecast horizons.

Generally, inflation forecasts are being adjusted downward for 2014 and 2015. The Survey of Professional Forecasters First Quarter 2014 Survey, for example, projects

…current-quarter headline CPI inflation to average 1.7 percent, lower than the last survey’s estimate of 1.8 percent. The forecasters predict current-quarter headline PCE inflation of 1.3 percent, lower than the prediction of 1.8 percent from the survey of three months ago.

The forecasters also see lower headline and core measures of CPI and PCE inflation during the next two years. Measured on a fourth-quarter over fourth-quarter basis, headline CPI inflation is expected to average 1.8 percent in 2014, down from 2.0 percent in the last survey, and 2.0 percent in 2015, down 0.2 percentage point from the previous estimate. Forecasters expect fourth-quarter over fourth-quarter headline PCE inflation to average 1.6 percent in 2014, down from 1.9 percent in the last survey, and 1.8 percent in 2015, down 0.1 percentage point from the previous estimate.

Over the next 10 years, 2014 to 2023, the forecasters expect headline CPI inflation to average 2.3 percent at an annual rate. The corresponding estimate for 10-year annual-average PCE inflation is 2.0 percent.

Lower and lower rates of inflation merge into deflation, of course, which is considered to be a risk currently for the eurozone. CNN Money reports that, in March, that the

..annual rate of inflation fell to 0.5%, down from 0.7% in February and weaker than most economists were expecting. Inflation is now at its lowest level since November 2009.

Actual deflation seems to be the reality in Spain, Portugal and Greece. Thus, the Wall Street Journal reports that ..

Spain’s preliminary estimate for March said the European Union-harmonized consumer-price index slipped 0.2% compared with the same month last year, down from February’s increase of 0.1%.

The data makes Spain the latest euro-zone country to slip into deflation. Prices have been dropping in Greece since early last year, and Portugal last month recorded its first year-over-year decline since 2009.

Japan is special among advanced industrial economies in having inflation which dipped into deflation several times for relatively extended periods, dating back to the 1980’s.

Japan is especially relevant, of course, because the Bank of Japan (BOJ) was the first to experiment with the zero-bound on short term interest rates and its aggressive bond-buying program – both features found in the US and European central bank environments today.

What is the Forecasting Problem?

Forecasting inflation rates have been one of the signature efforts of many macroeconomic forecasting organizations and agencies.

As a result, there is considerable research on the stochastic nature of inflation/deflation time series and the relative performance of univariate (autoregressive) versus multivariate forecasting models. It’s interesting to look over this literature with an eye to evaluating, in specific contexts, whether declining inflation rates can mean price change will dip below zero in key economic regions.

[I will add the finishing touches to this post, when I can. But meanwhile, this reflects my current thinking. Soon – hyperinflation]