There are dozens of web-based metrics for assessing ecommerce sites, but in the final analysis it probably just comes down to “conversion” rate. How many visitors to your ecommerce site end up buying your product or service?
Many factors come into play – such as pricing structure, product quality, customer service, and reputation.
But real-time predictive analytics plays an increasing role, according to How Predictive Analytics Is Transforming eCommerce & Conversion Rate Optimization. The author – Peep Laja – seems fond of Lattice, writing that,
Lattice has researched how leading companies like Amazon & Netflix are using predictive analytics to better understand customer behavior, in order to develop a solution that helps sales professionals better qualify their leads.
Laja also notes impressive success stories, such as Macy’s – which clocked an 8 to 12 percent increase in online sales by combining browsing behavior within product categories and sending targeted emails by customer segment.
Google and Bandit Testing
I find the techniques associated with A/B or Bandit testing fascinating.
Google is at the forefront of this – the experimental testing of webpage design and construction.
Let me recommend readers directly to Google Analytics – the discussion headed by Overview of Content Experiments.
What is Bandit Testing?
Well, the Google presentation Multi-armed Bandits is really clear.
This is a fun topic.
So suppose you have a row of slot machine (“one-armed bandits”) and you know each machine has different probabilities and size of payouts. How do you decide which machine to favor, after a period of experimentation?
This is the multi-armed bandit or simply bandit problem, and is mathematically very difficult.
[The bandit problem] was formulated during the [second world] war, and efforts to solve it so sapped the energies and minds of Allied analysts that the suggestion was made that the problem be dropped over Germany, as the ultimate instrument of intellectual sabotage.
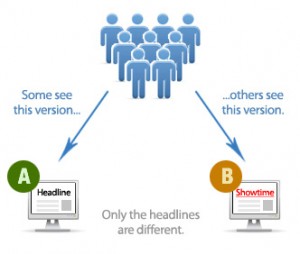
The Google discussion illustrates a Bayesian algorithm with simulations, showing that updating the probabilities and flow of traffic to what appear to be the most attractive web pages results, typically, in more rapid solutions that classical statistical experiments (generally known as A/B testing after “showroom A” and “showroom B”).
Suppose you’ve got a conversion rate of 4% on your site. You experiment with a new version of the site that actually generates conversions 5% of the time. You don’t know the true conversion rates of course, which is why you’re experimenting, but let’s suppose you’d like your experiment to be able to detect a 5% conversion rate as statistically significant with 95% probability. A standard power calculation1 tells you that you need 22,330 observations (11,165 in each arm) to have a 95% chance of detecting a .04 to .05 shift in conversion rates. Suppose you get 100 sessions per day to the experiment, so the experiment will take 223 days to complete. In a standard experiment you wait 223 days, run the hypothesis test, and get your answer.
Now let’s manage the 100 sessions each day through the multi-armed bandit. On the first day about 50 sessions are assigned to each arm, and we look at the results. We use Bayes’ theorem to compute the probability that the variation is better than the original2. One minus this number is the probability that the original is better. Let’s suppose the original got really lucky on the first day, and it appears to have a 70% chance of being superior. Then we assign it 70% of the traffic on the second day, and the variation gets 30%. At the end of the second day we accumulate all the traffic we’ve seen so far (over both days), and recompute the probability that each arm is best. That gives us the serving weights for day 3. We repeat this process until a set of stopping rules has been satisfied (we’ll say more about stopping rules below).
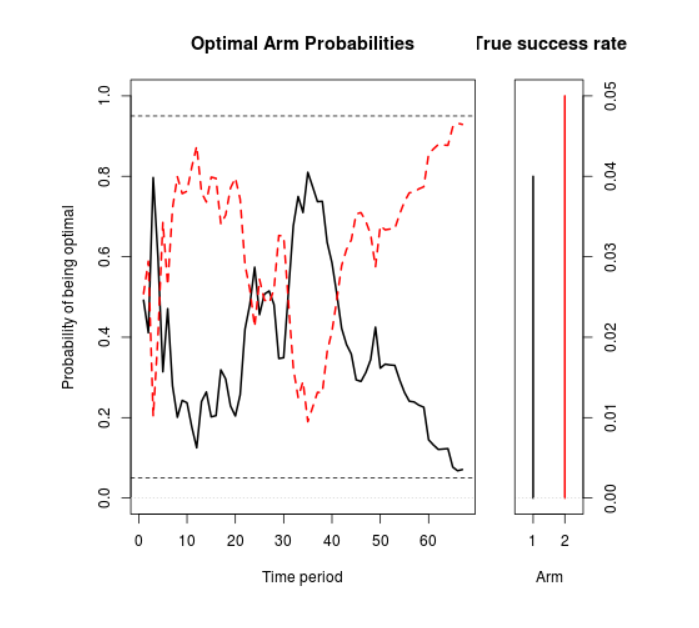
Figure 1 shows a simulation of what can happen with this setup. In it, you can see the serving weights for the original (the black line) and the variation (the red dotted line), essentially alternating back and forth until the variation eventually crosses the line of 95% confidence. (The two percentages must add to 100%, so when one goes up the other goes down). The experiment finished in 66 days, so it saved you 157 days of testing.
This Figure 1 chart is as follows.
 This is obviously just one outcome, but running this test many times verifies that in a majority of cases, the Google algorithm results in substantial shortening of test time, compared with an A/B test. In addition, if actual purchases are the meaning of “conversion” here, revenues are higher.
This naturally generalizes to any number of “arms” or slot machines.
Apparently, investors have put nearly $200 million in 2014 into companies developing predictive apps for ecommerce.
And, on the other side of the ledger, there are those who say that the mathematical training of people who might use these apps is still sub-par, and that the full potential of these techniques may not be realized in many cases.
The deeper analytics of the Google application is fascinating. It involves Monte Carlo simulation to integrate products of conditional and prior distributions, after new data comes in.
My math intuition, such as it is, suggests that this approach has wider applications. Why could it not, for example, be utilized for new products, where there might be two states, i.e. the product is a winner (following similar products in ramping up) or a loser? It’s also been used in speeding up health trials – an application of Bayesian techniques.
Top graphic from the One Hour Professor

