Business forecasters often do not directly forecast inflation, but usually are consumers of inflation forecasts from specialized research organizations.
But there is a level of literacy that is good to achieve on the subject – something a quick study of recent, authoritative sources can convey.
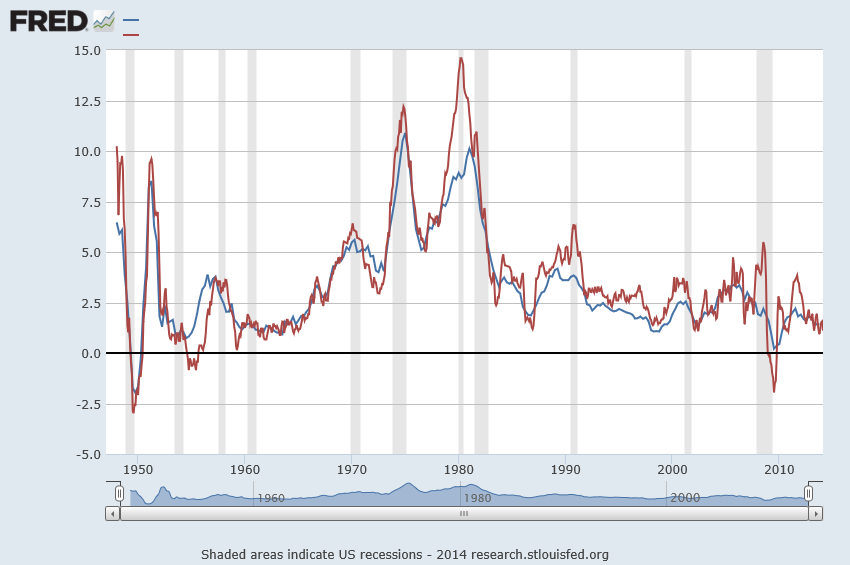
A good place to start is the following chart of US Consumer Price Index (CPI) and the GDP price index, both expressed in terms of year-over-year (yoy) percentage changes. The source is the St. Louis Federal Reserve FRED data site.
The immediate post-WW II period and the 1970;s and 1980’s saw surging inflation. Since somewhere in the 1980’s and certainly after the early 1990’s, inflation has been on a downward trend.
Some Stylized Facts About Forecasting Inflation
James Stock and Mark Watson wrote an influential NBER (National Bureau of Economic Research) paper in 2006 titled Why Has US Inflation Become Harder to Forecast.
These authors point out that the rate of price inflation in the United States has become both harder and easier to forecast, depending on one’s point of view.
On the one hand, inflation (along with many other macroeconomic time series) is much less volatile than it was in the 1970s or early 1980s, and the root mean squared error of naïve inflation forecasts has declined sharply since the mid-1980s. In this sense, inflation has become easier to forecast: the risk of inflation forecasts, as measured by mean squared forecast errors (MSFE), has fallen.
On the other hand, multivariate forecasting models inspired by economic theory – such as the Phillips curve –lose ground to univariate forecasting models after the middle 1980’s or early 1990’s. The Phillips curve, of course, postulates a tradeoff between inflation and economic activity and is typically parameterized in inflationary expectations and the gap between potential and actual GDP.
A more recent paper Forecasting Inflation evaluates sixteen inflation forecast models and some judgmental projections. Root mean square prediction errors (RMSE’s) are calculated in quasi-realtime recursive out-of-sample data – basically what I would call “backcasts.” In other words, the historic data is divided into training and test samples. The models are estimated on the various possible training samples (involving, in this case, consecutive data) and forecasts from these estimated models are matched against the out-of-sample or test data.
The study suggests four principles.
- Subjective forecasts do the best
- Good forecasts must account for a slowly varying local mean.
- The Nowcast is important and typically utilizes different techniques than standard forecasting
- Heavy shrinkage in the use of information improves inflation forecasts
Interestingly, this study finds that judgmental forecasts (private sector surveys and the Greenbook) are remarkably hard to beat. Otherwise, most of the forecasting models fail to consistently trump a “naïve forecast” which is the average inflation rate over four previous periods.
What This Means
I’m willing to offer interpretations of these findings in terms of (a) the resilience of random walk models, and (b) the eclipse of unionized labor in the US.
So forecasting inflation as an average of several previous values suggests the underlying stochastic process is some type of random walk. Thus, the optimal forecast for a simple random walk is the most currently observed value. The optimal forecast for a random walk with noise is an exponentially weighted average of the past values of the series.
The random walk is a recurring theme in many macroeconomic forecasting contexts. It’s hard to beat.
As far as the Phillips curve goes, it’s not clear to me that the same types of tradeoffs between inflation and unemployment exist in the contemporary US economy, as did, say, in the 1950’s or 1960’s. The difference, I would guess, is the lower membership in and weaker power of unions. After the 1980’s, things began to change significantly on the labor front. Companies exacted concessions from unions, holding out the risk that the manufacturing operation might be moved abroad to a lower wage area, for instance. And manufacturing employment, the core of the old union power, fell precipitously.
As far as the potency of subjective forecasts – I’ll let Faust and Wright handle that. While these researchers find what they call subjective forecasts beat almost all the formal modeling approaches, I’ve seen other evaluations calling into question whether any inflation forecast beats a random walk approach consistently. I’ll have to dig out the references to make this stick.

