The case for assessing health risk with logistic regression is made by authors of a 2009 study, which is also a sort of model example for Big Data in diagnostic medicine.
As the variables that help predict breast cancer increase in number, physicians must rely on subjective impressions based on their experience to make decisions. Using a quantitative modeling technique such as logistic regression to predict the risk of breast cancer may help radiologists manage the large amount of information available, make better decisions, detect more cancers at early stages, and reduce unnecessary biopsies
This study – A Logistic Regression Model Based on the National Mammography Database Format to Aid Breast Cancer Diagnosis – pulled together 62,219 consecutive mammography records from 48,744 studies in 18,270 patients reported using the Breast Imaging Reporting and Data System (BI-RADS) lexicon and the National Mammography Database format between April 5, 1999 and February 9, 2004.
The combination of medical judgment and an algorithmic diagnostic tool based on extensive medical records is, in the best sense, the future of medical diagnosis and treatment.
And logistic regression has one big thing going for it – a lot of logistic regressions have been performed to identify risk factors for various diseases or for mortality from a particular ailment.
A logistic regression, of course, maps a zero/one or categorical variable onto a set of explanatory variables.
This is not to say that there are not going to be speedbumps along the way. Interestingly, these are data science speedbumps, what some would call statistical modeling issues.
Picking the Right Variables, Validating the Logistic Regression
The problems of picking the correct explanatory variables for a logistic regression and model validation are linked.
The problem of picking the right predictors for a logistic regression is parallel to the problem of picking regressors in, say, an ordinary least squares (OLS) regression with one or two complications. You need to try various specifications (sets of explanatory variables) and utilize a raft of diagnostics to evaluate the different models. Cross-validation, utilized in the breast cancer research mentioned above, is probably better than in-sample tests. And, in addition, you need to be wary of some of the weird features of logistic regression.
A survey of medical research from a few years back highlights the fact that a lot of studies shortcut some of the essential steps in validation.
A Short Primer on Logistic Regression
I want to say a few words about how the odds-ratio is the key to what logistic regression is all about.
Logistic regression, for example, does not “map” a predictive relationship onto a discrete, categorical index, typically a binary, zero/one variable, in the same way ordinary least squares (OLS) regression maps a predictive relationship onto dependent variables. In fact, one of the first things one tends to read, when you broach the subject of logistic regression, is that, if you try to “map” a binary, 0/1 variable onto a linear relationship β0+β1x1+β2x2 with OLS regression, you are going to come up against the problem that the predictive relationship will almost always “predict” outside the [0,1] interval.
Instead, in logistic regression we have a kind of background relationship which relates an odds-ratio to a linear predictive relationship, as in,
ln(p/(1-p)) = β0+β1x1+β2x2
Here p is a probability or proportion and the xi are explanatory variables. The function ln() is the natural logarithm to the base e (a transcendental number), rather than the logarithm to the base 10.
The parameters of this logistic model are β0, β1, and β2.
This odds ratio is really primary and from the logarithm of the odds ratio we can derive the underlying probability p. This probability p, in turn, governs the mix of values of an indicator variable Z which can be either zero or 1, in the standard case (there being a generalization to multiple discrete categories, too).
Thus, the index variable Z can encapsulate discrete conditions such as hospital admissions, having a heart attack, or dying – generally, occurrences and non-occurrences of something.
It’s exactly analogous to flipping coins, say, 100 times. There is a probability of getting a heads on a flip, usually 0.50. The distribution of the number of heads in 100 flips is a binomial, where the probability of getting say 60 heads and 40 tails is the combination of 100 things taken 60 at a time, multiplied into (0.5)60*(0.5)40. The combination of 100 things taken 60 at a time equals 60!/(60!40!) where the exclamation mark indicates “factorial.”
Similarly, the probability of getting 60 occurrences of the index Z=1 in a sample of 100 observations is (p)60*(1-p)40multiplied by 60!/(60!40!).
The parameters βi in a logistic regression are estimated by means of maximum likelihood (ML). Among other things, this can mean the optimal estimates of the beta parameters – the parameter values which maximize the likelihood function – must be estimated by numerical analysis, there being no closed form solutions for the optimal values of β0, β1, and β2.
In addition, interpretation of the results is intricate, there being no real consensus on the best metrics to test or validate models.
SAS and SPSS as well as software packages with smaller market shares of the predictive analytics space, offer algorithms, whereby you can plug in data and pull out parameter estimates, along with suggested metrics for statistical significance and goodness of fit.
There also are logistic regression packages in R.
But you can do a logistic regression, if the data are not extensive, with an Excel spreadsheet.
This can be instructive, since, if you set it up from the standpoint of the odds-ratio, you can see that only certain data configurations are suitable. These configurations – I refer to the values which the explanatory variables xi can take, as well as the associated values of the βi – must be capable of being generated by the underlying probability model. Some data configurations are virtually impossible, while others are inconsistent.
This is a point I find lacking in discussions about logistic regression, which tend to note simply that sometimes the maximum likelihood techniques do not converge, but explode to infinity, etc.
Here is a spreadsheet example, where the predicting equation has three parameters and I determine the underlying predictor equation to be,
ln(p/(1-p))=-6+3x1+.05x2
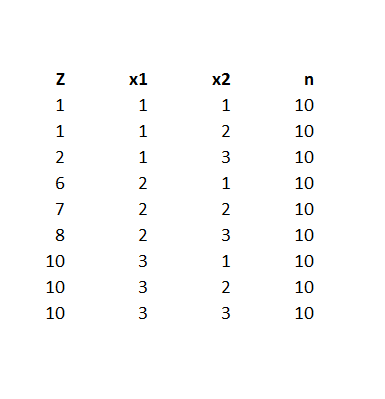
and we have the data-

Notice the explanatory variables x1 and x2 also are categorical, or at least, discrete, and I have organized the data into bins, based on the possible combinations of the values of the explanatory variables – where the number of cases in each of these combinations or populations is given to equal 10 cases. A similar setup can be created if the explanatory variables are continuous, by partitioning their ranges and sorting out the combination of ranges in however many explanatory variables there are, associating the sum of occurrences associated with these combinations. The purpose of looking at the data this way, of course, is to make sense of an odds-ratio.
The predictor equation above in the odds ratio can be manipulated into a form which explicitly indicates the probability of occurrence of something or of Z=1. Thus,
p= eβ0+β1×1+β2×2/(1+ eβ0+β1×1+β2×2)
where this transformation takes advantage of the principle that elny = y.
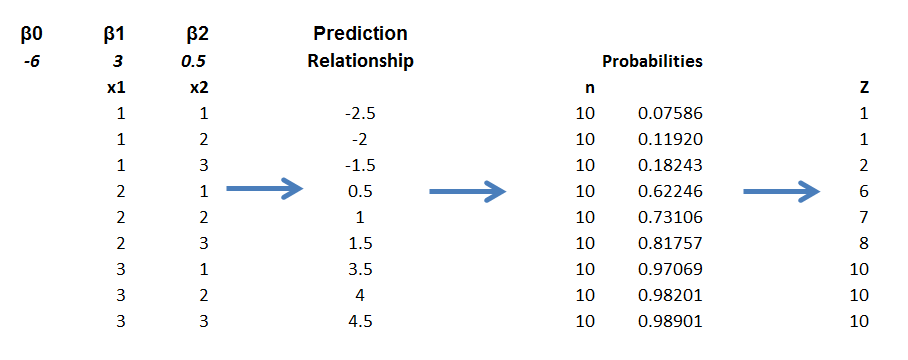
So with this equation for p, I can calculate the probabilities associated with each of the combinations in the data rows of the spreadsheet. Then, given the probability of that configuration, I calculate the expected value of Z=1 by the formula 10p. Thus, the mean of a binomial variable with probability p is np, where n is the number of trials. This sequence is illustrated below (click to enlarge).
Picking the “success rates” for each of the combinations to equal the expected value of the occurrences, given 10 “trials,” produces a highly consistent set of data.
Along these lines, the most valuable source I have discovered for ML with logistic regression is a paper by Scott
Czepiel – Maximum Likelihood Estimation of Logistic Regression Models: Theory and Implementation.
I can readily implement Czepiel’s log likelihood function in his Equation (9) with an Excel spreadsheet and Solver.
It’s also possible to see what can go wrong with this setup.
For example, the standard deviation of a binomial process with probability p and n trials is np(1-p). If we then simulate the possible “occurrences” for each of the nine combinations, some will be closer to the estimate of np used in the above spreadsheet, others will be more distant. Peforming such simulations, however, highlights that some numbers of occurrences for some combinations will simply never happen, or are well nigh impossible, based on the laws of chance.
Of course, this depends on the values of the parameters selected, too – but it’s easy to see that, whatever values selected for the parameters, some low probability combinations will be highly unlikely to produce a high number for successes. This results in a nonconvergent ML process, so some parameters simply may not be able to be estimated.
This means basically that logistic regression is less flexible in some sense than OLS regression, where it is almost always possible to find values for the parameters which map onto the dependent variable.
What This Means
Logistic regression, thus, is not the exact analogue of OLS regression, but has nuances of its own. This has not prohibited its wide application in medical risk assessment (and I am looking for a survey article which really shows the extent of its application across different medical fields).
There also are more and more reports of the successful integration of medical diagnostic systems, based in some way on logistic regression analysis, in informing medical practices.
But the march of data science is relentless. Just when doctors got a handle on logistic regression, we have a raft of new techniques, such as random forests and splines.
Header image courtesy of: National Kidney & Urologic Diseases Information Clearinghouse (NKUDIC)


