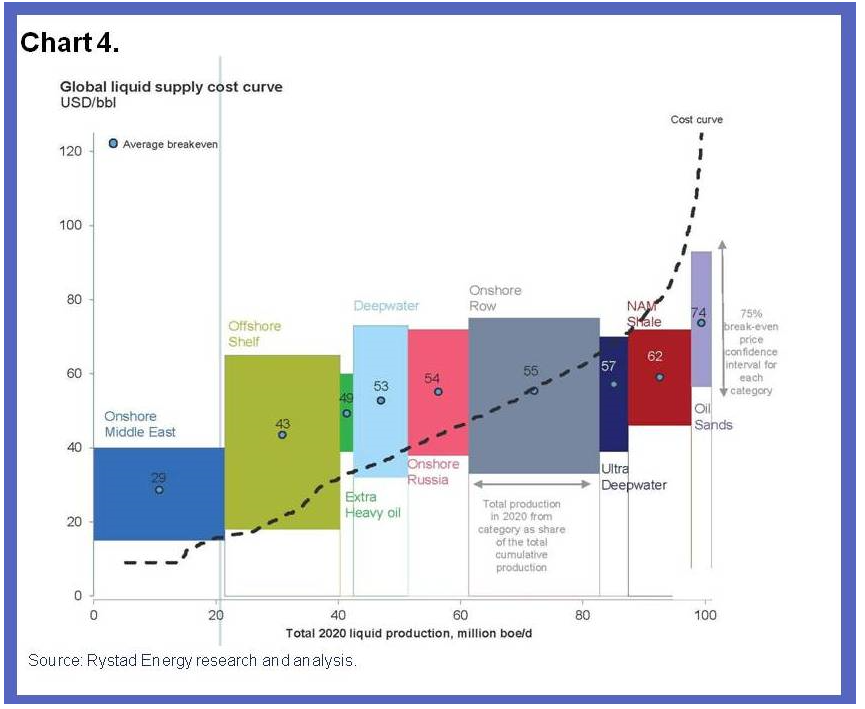
James Hamilton firms up the role for demand factors behind the free fall in oil prices in Supply, demand and the price of oil. This Econbrowser post also features a great chart for the global supply curve for crude oil – highlighting the geographic spread of oil production costs.
Hamilton notes (a) the International Energy Agency current estimate of world oil demand growth for 2014:Q3 is 800,000 barrels/day below what the IEA projected as of last June, (b) continuing improvements in the fuel economy of new cars sold in the US, (c) aging populations in the US drive less, and (d) US labor force participation is on a longer trend downward, and, again, unemployed persons drive less.
At the same time, US shale oil production materially contributes to the global oil glut at present.
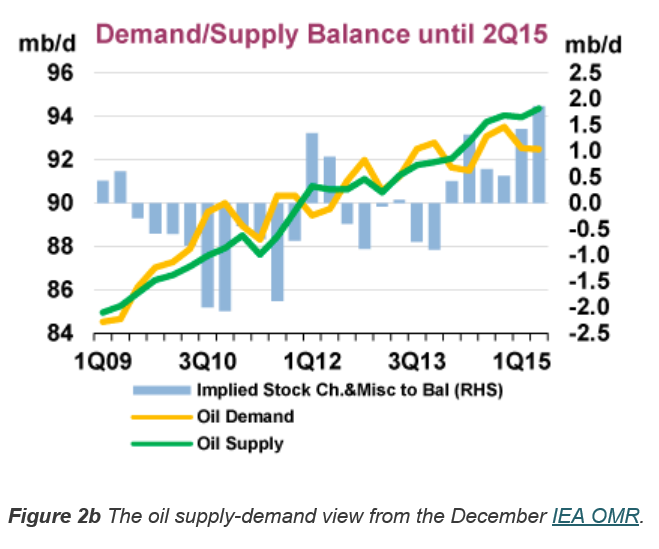
IEA demand and supply projections are contained in the Oil Market Report – which features this interesting graphic.
Note the large gap between demand (yellow line) and supply (green line) in early 2015 of about 2 million barrels per day (mb/d).
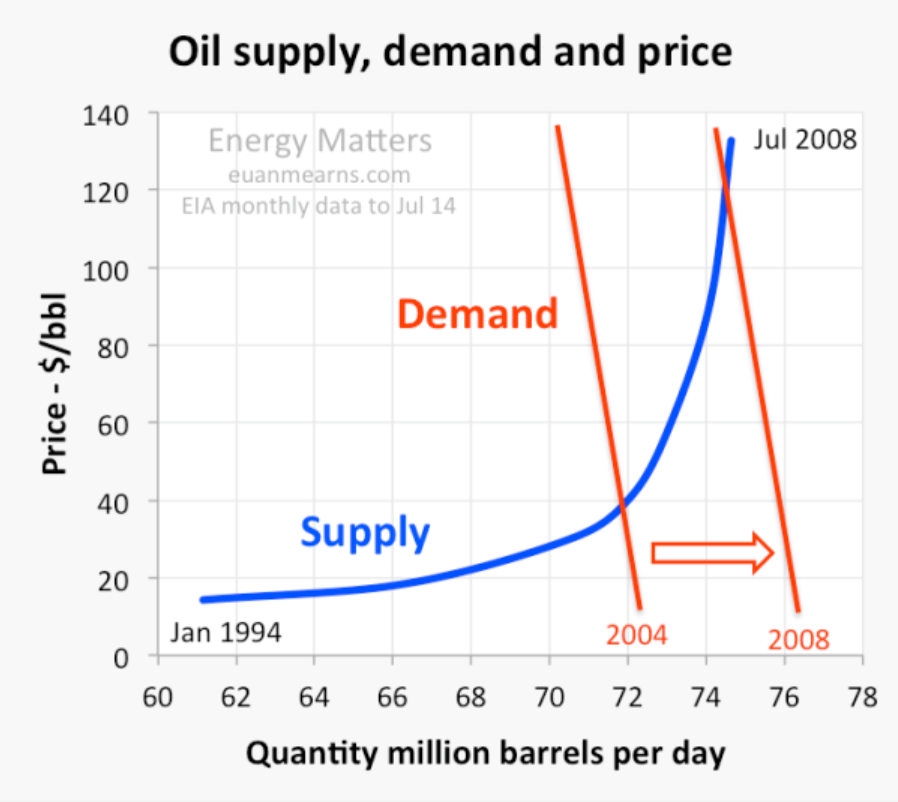
In a piece for OilPrice.com Euan Means does up a lot of supply-demand charts, such as the one below, in Oil Price Scenarios For 2015 And 2016.
One point seems to jump out from these discussions.
This is that the supply curve for oil rises steeply at a certain point – as is validated from the geographic production cost curve presented initially in this post.
This means demand does not have to change very much to result in big changes in price, and that peak oil is probably still a relevant concept, despite the current glut of supply on the market.


