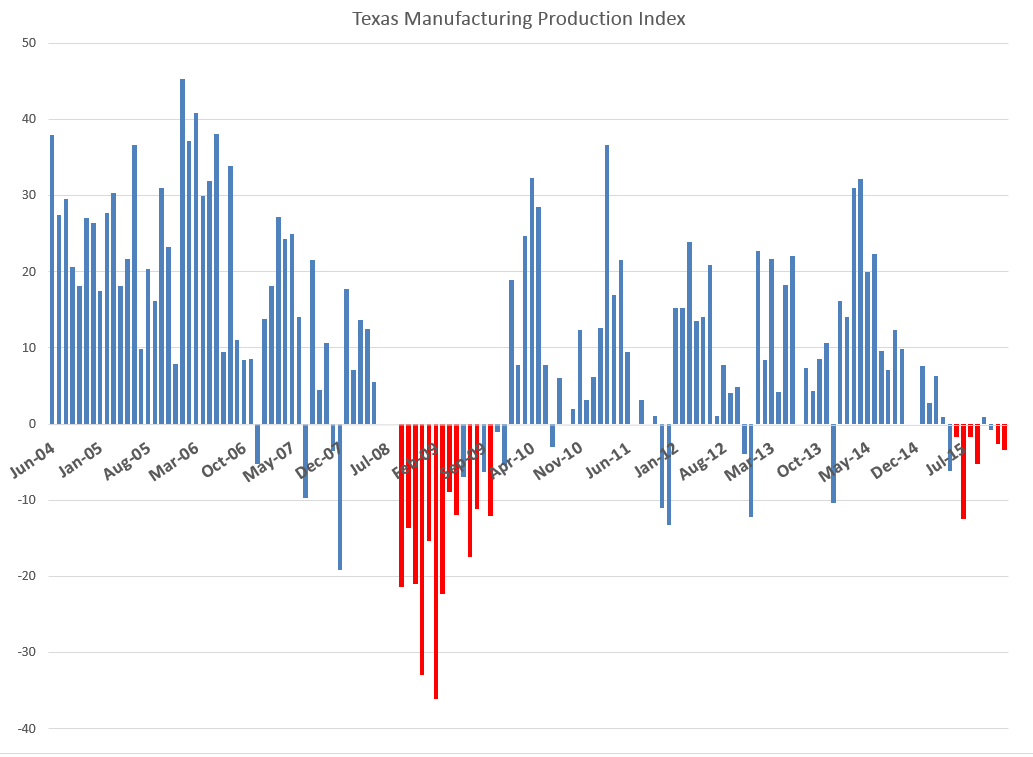
The Dallas Federal Reserve Bank highlights the impact of continuing declines in oil prices in their latest monthly Texas Manufacturing Outlook Survey:
Texas factory activity fell sharply in January, according to business executives responding to the Texas Manufacturing Outlook Survey. The production index—a key measure of state manufacturing conditions—dropped 23 points, from 12.7 to -10.2, suggesting output declined this month after growing throughout fourth quarter 2015.
Other indexes of current manufacturing activity also indicated contraction in January. The survey’s demand measures—the new orders index and the growth rate of orders index—led the falloff in production with negative readings last month, and these indexes pushed further negative in January. The new orders index edged down to -9.2, and the growth rate of orders index fell to -17.5, its lowest level in a year. The capacity utilization index fell 15 points from 8.1 to -7, and the shipments index also posted a double-digit decline into negative territory, coming in at -11.
Perceptions of broader business conditions weakened markedly in January. The general business activity and company outlook indexes fell to their lowest readings since April 2009, when Texas was in recession. The general business activity index fell 13 points to -34.6, and the company outlook index slipped to -19.5.
Here is a chart showing the Texas monthly manufacturing index.
Hamilton cites an NBER (National Bureau of Economic Research) paper – Geographic Dispersion of Economic Shocks: Evidence from the Fracking Revolution – which estimates jobs from fracking (hydraulic fracturing of oil deposits) resulted in more than 700,000 US jobs 2008-2009, resulting in an 0.5 percent decrease in the unemployment rate during that dire time.
I’ve seen some talk that problems in the oil patch may play a role analogous to sub-prime mortgages during the last economic contraction.
In terms of geopolitics, there is evidence the Saudi’s, who dominate OPEC, triggered the price decline by refusing to limit production from their fields.
I buy into the “hedgehog/fox” story, when it comes to forecasting. So you have to be dedicated to the numbers, but still cast a wide net. Here are some fun stories, relevant facts, positive developments, and concerns – first Links post for 2015.
Jennifer Doudna, for instance, is at the forefront of one of the most exciting biomedical advances in living memory: engineering the genomes not of plants, but of people. Her cheap and easy Crispr technology holds out the promise that anybody with a gene defect could get that problem fixed, on an individual, bespoke basis. No more one-size-fits all disease cures: everything can now be personalized. The dystopian potential here, of course, is obvious: while Doudna’s name isn’t Frankenstein, you can be sure that if and when her science gains widespread adoption, the parallels will be hammered home ad nauseam.
Doudna is particularly interesting because she doesn’t dismiss fearmongers as anti-science trolls. While she has a certain amount of control over what her own labs do, her scientific breakthrough is in the public domain, now, and already more than 700 papers have been published in the past two years on various aspects of genome engineering. In one high-profile example, a team of researchers found a way of using Doudna’s breakthrough to efficiently and predictably cause lung cancer in mice.
There is more on Doudna’ Innovative Genomics Initiative here, but the initially linked article on the need for regulatory breakthrough goes on to make some interesting observations about Uber and Airbnb, both of which have thrived by ignoring regulations in various cities, or even flagrantly breaking the law.
Any significant drop in the yuan would prompt Japan to unleash another quantitative-easing blitz. The same goes for South Korea, whose exports are already hurting. Singapore might feel compelled to expand upon last week’s move to weaken its dollar. Before long, officials in Bangkok, Hanoi, Jakarta, Manila, Taipei and even Latin America might act to protect their economies’ competitiveness…
There’s obvious danger in so many economies engaging in this race to the bottom. It will create unprecedented levels of volatility in markets and set in motion flows of hot money that overwhelm developing economies, inflating asset bubbles and pushing down bond rates irrationally low. Consider that Germany’s 10-year debt yields briefly fell below Japan’s (they’re both now in the 0.35 percent to 0.36 percent range). In a world in which the Bank of Japan, the European Central Bank and the Federal Reserve are running competing QE programs, the task of pricing risk can get mighty fuzzy.
The [Chinese] consumer-price index, a main gauge of inflation, likely rose only 0.9% from a year earlier, according to a median forecast of 13 economists surveyed by the Wall Street Journal
Good News About How America Uses Energy A lot more solar and renewables, increasing energy efficiency – all probably contributors to the Saudi move to push oil prices back to historic lows, wean consumers from green energy and conservation.
Nuclear will die. Solar will live Companion piece to the above. Noah Smith curates Noahpinion, one of the best and quirkiest economics blogs out there. Here’s Smith on the reason nuclear is toast (in his opinion) –
There are three basic reasons conventional nuclear is dead: cost, safety risk, and obsolescence risk. These factors all interact.
First, cost. Unlike solar, which can be installed in small or large batches, a nuclear plant requires an absolutely huge investment. A single nuclear plant can cost on the order of $10 billion U.S. That is a big chunk of change to plunk down on one plant. Only very large companies, like General Electric or Hitachi, can afford to make that kind of investment, and it often relies on huge loans from governments or from giant megabanks. Where solar is being installed by nimble, gritty entrepreneurs, nuclear is still forced to follow the gigantic corporatist model of the 1950s.
Second, safety risk. In 1945, the U.S. military used nuclear weapons to destroy Hiroshima and Nagasaki, but a decade later, these were thriving, bustling cities again. Contrast that with Fukushima, site of the 2011 Japanese nuclear meltdown, where whole towns are still abandoned. Or look at Chernobyl, almost three decades after its meltdown. It will be many decades before anyone lives in those places again. Nuclear accidents are very rare, but they are also very catastrophic – if one happens, you lose an entire geographical region to human habitation.
Finally, there is the risk of obsolescence. Uranium fission is a mature technology – its costs are not going to change much in the future. Alternatives, like solar, are young technologies – the continued staggering drops in the cost of solar prove it. So if you plunk down $10 billion to build a nuclear plant, thinking that solar is too expensive to compete, the situation can easily reverse in a couple of years, before you’ve recouped your massive fixed costs.
Owners of the wind Greenpeace blog post on Denmark’s extraordinary and successful embrace of wind power.
What’s driving the price of oil down? Econbrowser is always a good read on energy topics, and this post is no exception. Demand factors tend to be downplayed in favor of stories about Saudi production quotas.
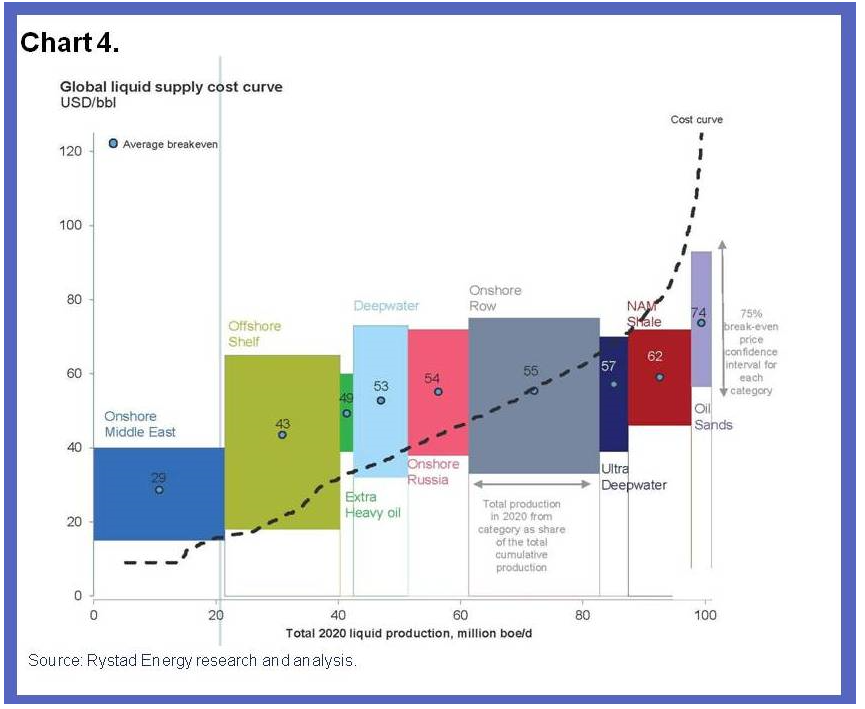
James Hamilton firms up the role for demand factors behind the free fall in oil prices in Supply, demand and the price of oil. This Econbrowser post also features a great chart for the global supply curve for crude oil – highlighting the geographic spread of oil production costs.
Hamilton notes (a) the International Energy Agency current estimate of world oil demand growth for 2014:Q3 is 800,000 barrels/day below what the IEA projected as of last June, (b) continuing improvements in the fuel economy of new cars sold in the US, (c) aging populations in the US drive less, and (d) US labor force participation is on a longer trend downward, and, again, unemployed persons drive less.
At the same time, US shale oil production materially contributes to the global oil glut at present.
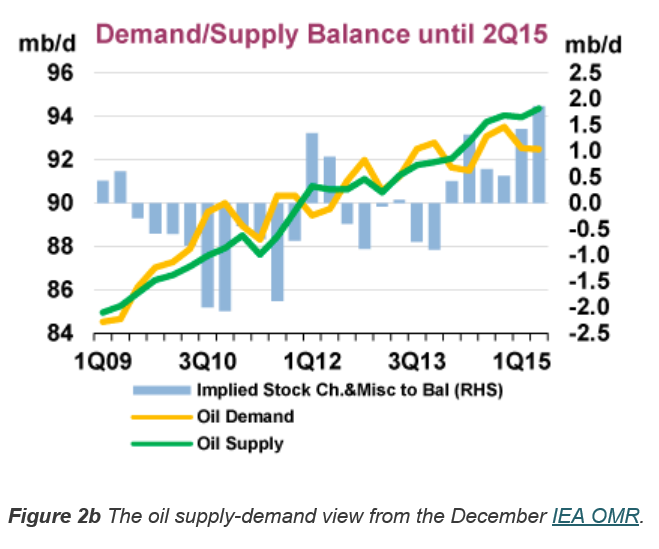
IEA demand and supply projections are contained in the Oil Market Report – which features this interesting graphic.
Note the large gap between demand (yellow line) and supply (green line) in early 2015 of about 2 million barrels per day (mb/d).
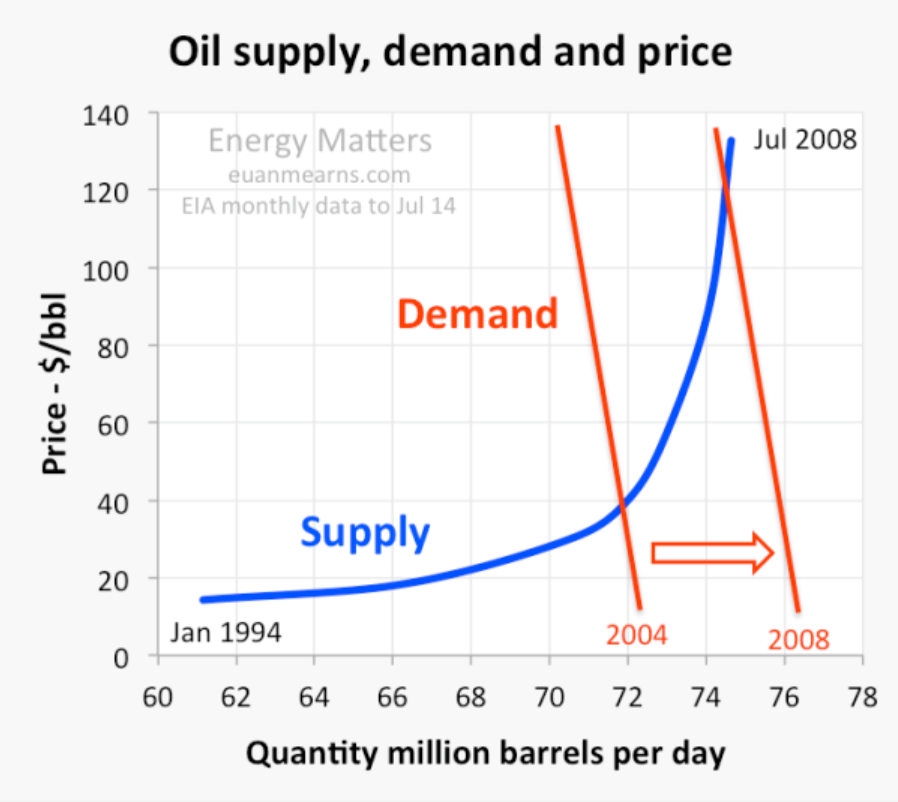
One point seems to jump out from these discussions.
This is that the supply curve for oil rises steeply at a certain point – as is validated from the geographic production cost curve presented initially in this post.
This means demand does not have to change very much to result in big changes in price, and that peak oil is probably still a relevant concept, despite the current glut of supply on the market.
What are the respective roles of demand and supply factors?
How persistent is this supply shift likely to be?
What are the effects likely to be on the global economy?
What are likely to be the effects on oil importers?
What are likely to be the effects on oil exporters?
What are the financial implications?
What should be the policy response of oil importers and exporters?
The first point to note is the drop in oil prices involves both supply and demand – and is not just the result of increased pumping by Saudi Arabia.
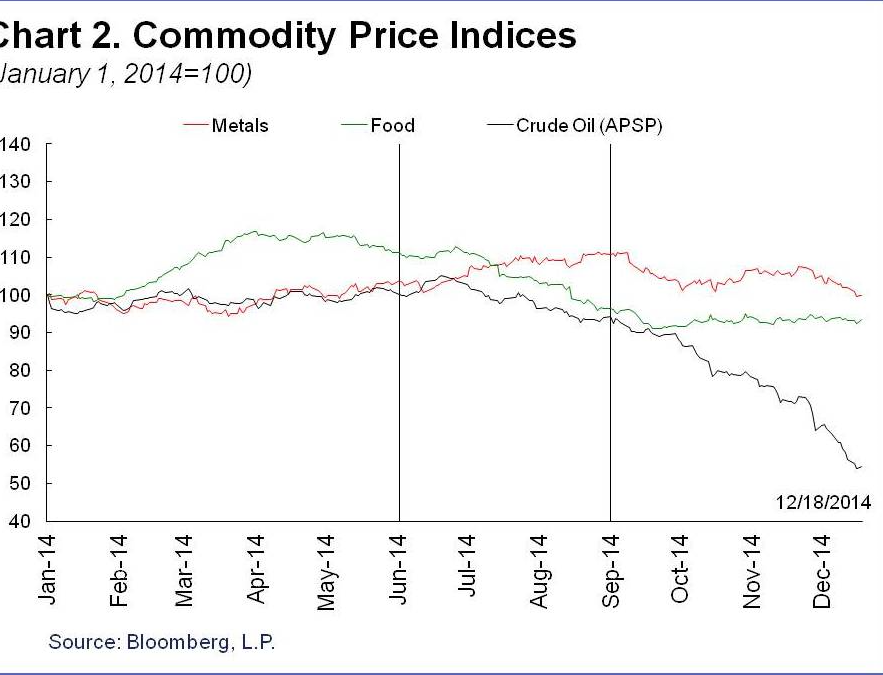
The IMF discussion includes this interesting comparison between oil and other commodity price indices.
So over 2014, there have been drops in other commodity prices – probably due to weakened global demand – but not nearly much as oil.
Overall, the IMF counts lower oil prices as a net positive to the global economy, resulting in a gain for world GDP between 0.3 and 0.7 percent in 2015, compared to a scenario without the drop in oil prices.
There are big losers, of course. These include oil exporters with higher production costs, such as Russia, Iran, and Venezuela.
To take some examples, energy accounts for 25 percent of Russia’s GDP, 70 percent of its exports, and 50 percent of federal revenues. In the Middle East, the share of oil in federal government revenue is 22.5 percent of GDP and 63.6 percent of exports for the Gulf Cooperation Council countries. In Africa, oil exports accounts for 40-50 percent of GDP for Gabon, Angola and the Republic of Congo, and 80 percent of GDP for Equatorial Guinea. Oil also accounts for 75 percent of government revenues in Angola, Republic of Congo and Equatorial Guinea. In Latin America, oil contributes respectively about 30 percent and 46.6 percent to public sector revenues, and about 55 percent and 94 percent of exports for Ecuador and Venezuela.[8] This shows the dimension of the challenge facing these countries.
Interestingly, low oil prices maintained long enough could be self-correcting. This is probably the bet the Saudi’s are making – that their policy can eventually trigger faster growth and enable them to maintain or increase their market share.
As I’ve said before, I think it’s a game changer. The trick is to figure out the linkages and connections, backwards and forwards along the supply chains.
There are several reasons to expect a new trading range as low as $20 to $50, as in the period from 1986 to 2004. Technological and environmental pressures are reducing long-term oil demand and threatening to turn much of the high-cost oil outside the Middle East into a “stranded asset” similar to the earth’s vast unwanted coal reserves. Additional pressures for low oil prices in the long term include the possible lifting of sanctions on Iran and Russia and the ending of civil wars in Iraq and Libya, which between them would release additional oil reserves bigger than Saudi Arabia’s on to the world markets.
The U.S. shale revolution is perhaps the strongest argument for a return to competitive pricing instead of the OPEC-dominated monopoly regimes of 1974-85 and 2005-14. Although shale oil is relatively costly, production can be turned on and off much more easily – and cheaply – than from conventional oilfields. This means that shale prospectors should now be the “swing producers” in global oil markets instead of the Saudis. In a truly competitive market, the Saudis and other low-cost producers would always be pumping at maximum output, while shale shuts off when demand is weak and ramps up when demand is strong. This competitive logic suggests that marginal costs of U.S. shale oil, generally estimated at $40 to $50, should in the future be a ceiling for global oil prices, not a floor.
As if in validation of this perspective, Sheik Ali al-Naimi, the Saudi Oil Minister, is quoted in an interview at the beginning of this week
Also, Mr Naimi said that if Saudi Arabia reduced its production, “the price will go up and the Russians, the Brazilians, US shale oil producers will take my share”.
Higher Cost Oil Producers Impacted
Estimates of the cost to the Saudi’s for extracting their oil out of the ground seem to be plummeting, along with the spot price of a barrel of crude. The above interview cited by the Financial Times also asserts that Saudi and other Gulf States can extract at $4-$5 a barrel.
That is an order of magnitude less than the production costs of oil from many US shale plays, much of the North Sea oil supplying revenues to Norway and the UK, as well as Russian and Iranian oil.
The rig count has been dropping, but many expect US shale oil production to continue increasing, as companies optimize existing wells and drill as long as already secured futures contracts cover output.
Given the low growth to deflationary profile in the global economy, this probably means a glut of petroleum on world markets for 2015 and, possibly, 2016.
Implications of a Period of Significantly Lower Oil Prices
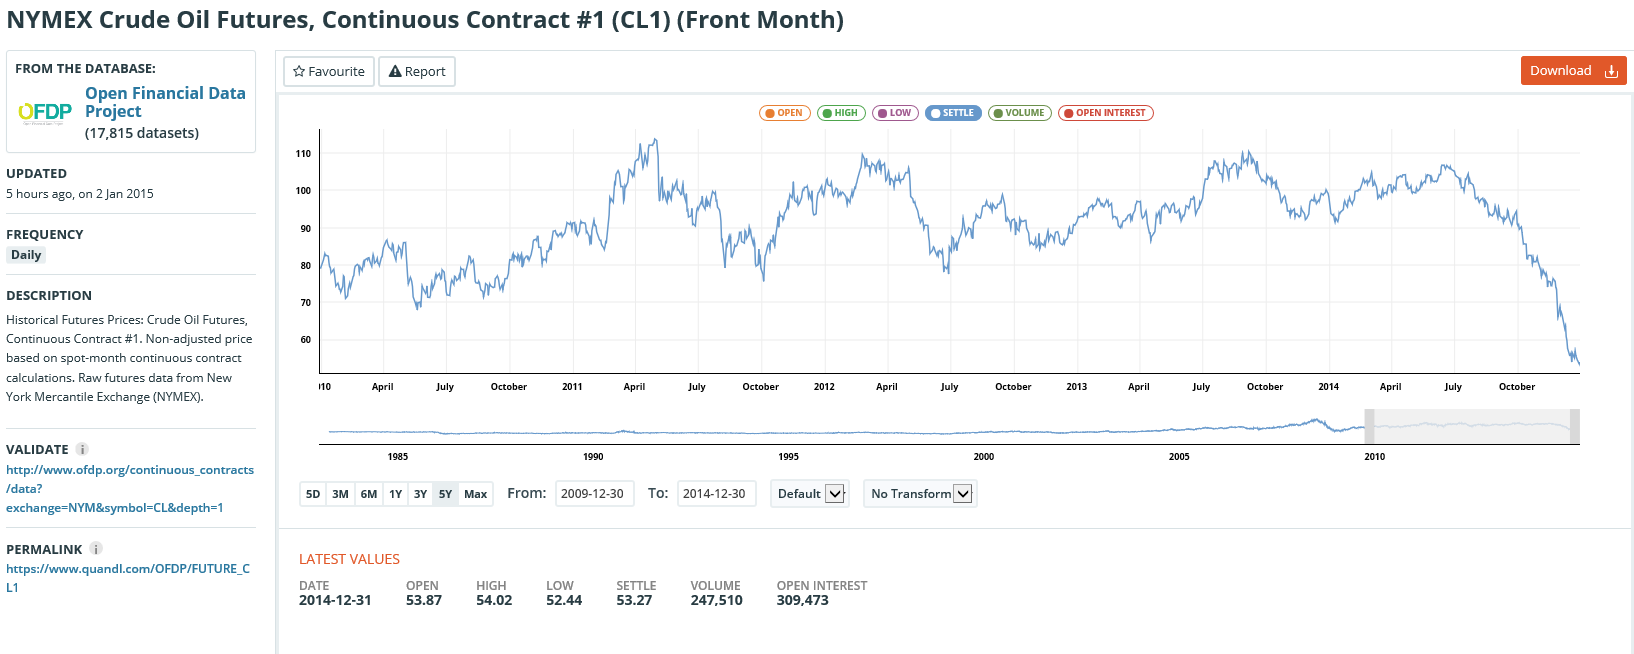
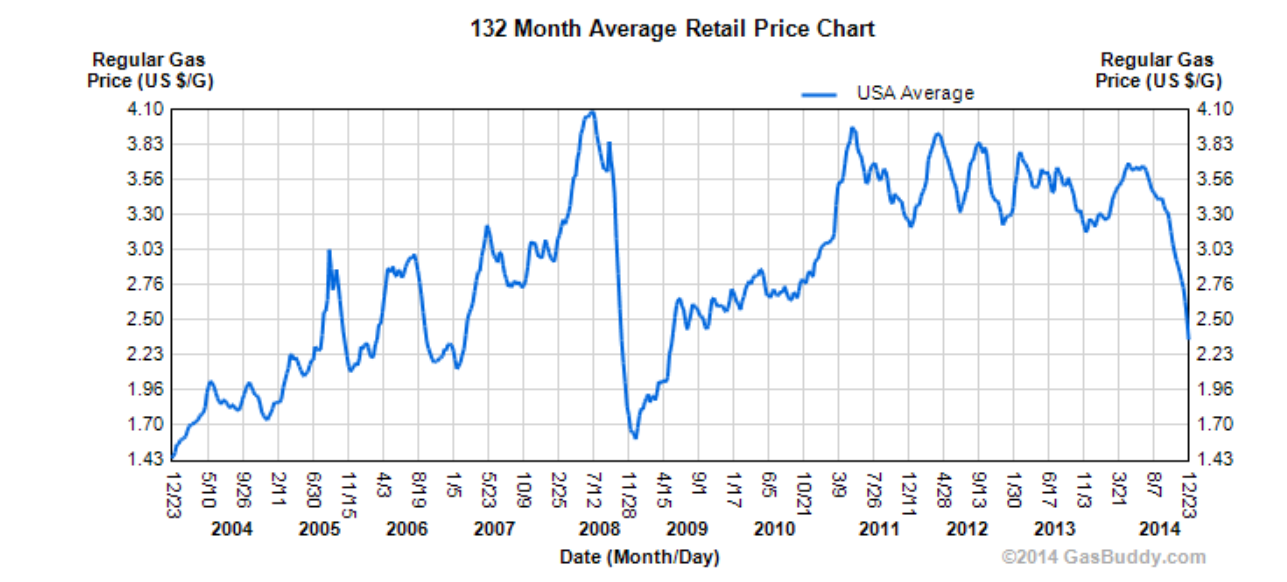
The price of gasoline at the pump in the US is plummeting.
First-order effects for the American consumer probably more than balance the short-run negative impacts of cutbacks in the oil or shale patch. The typical household gets on the order of $100 extra in their pocket monthly, as long as the low prices continue. This is discretionary money that would have in all likelihood be spent anyway. So other products will benefit, plus people will drive more. It’s as simple as that.
China may be a major beneficiary, since its production is relatively energy-intensive and it is a net importer of petroleum products.
In Japan, which imports energy (all at prices based on crude oil) worth roughly 6% of GDP, the recent sharp price drop could lift real GDP growth by 1.5%–2%! This would largely offset the 3% hike in VAT imposed last year – or justify the second round 2% hike that was just cancelled. The drop in oil prices may save Abe short term, but it will also put at risk both the 3% inflation goal and the need to turn nuclear facilities back on.
Going Out on a Limb – Business Forecast Blog Prediction
OK, so I’m going out on a limb here and make the following prediction.
As long as there is no banking collapse, as a result of oil companies turning the junk bonds that financed their land purchases into true junk, or the Russian economy collapsing, dragging down the European banking system – all bets are off for a recession in 2015 and probably 2016.
These low oil prices are like a gift to many of the world’s economies, as well as many families reliant on the internal combustion engine to get them to and from work. Low oil prices also should help keep the cost of agricultural products down, again benefitting consumers.
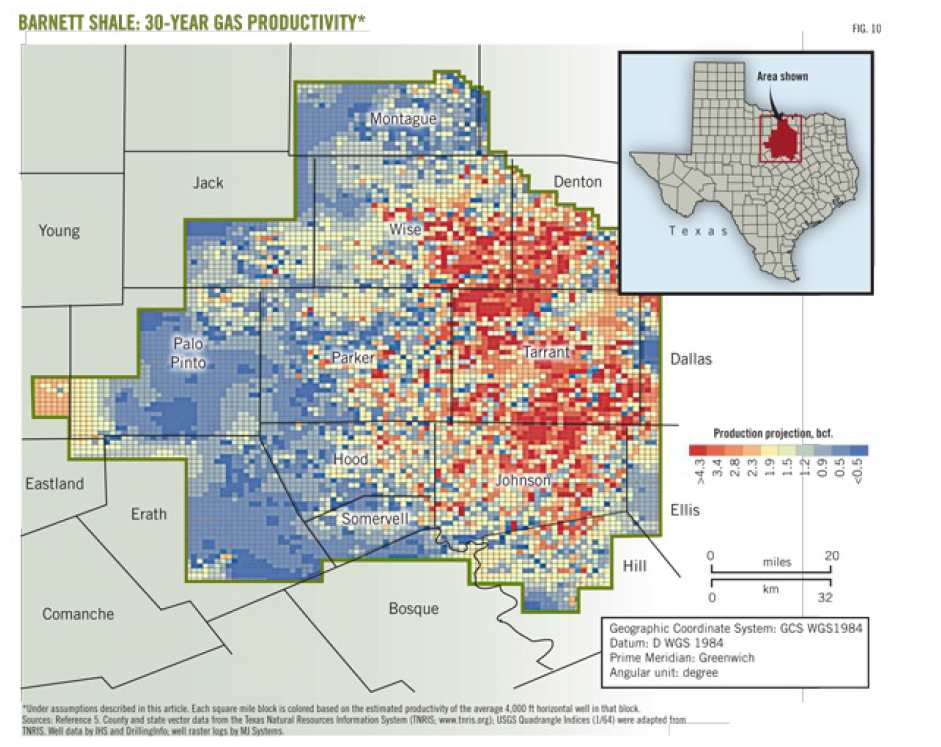
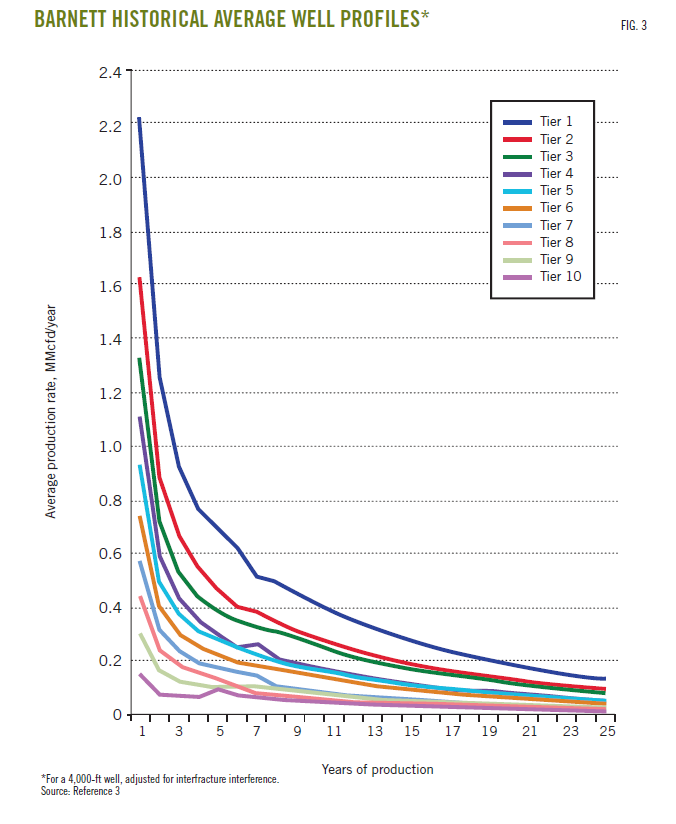
The results provide, among other things, forecasts of when natural gas production from this field will peak – suggesting at current prices that peak production may already have been reached.
The Barnett Shale study examines production data from all individual wells drilled 1995-2010 in this shale play in the Fort Worth basin – altogether more than 15,000 wells.
Well-by-well analysis leads to segmentation of natural gas and liquid production potential in 10 productivity tiers, which are then used to forecast future production.
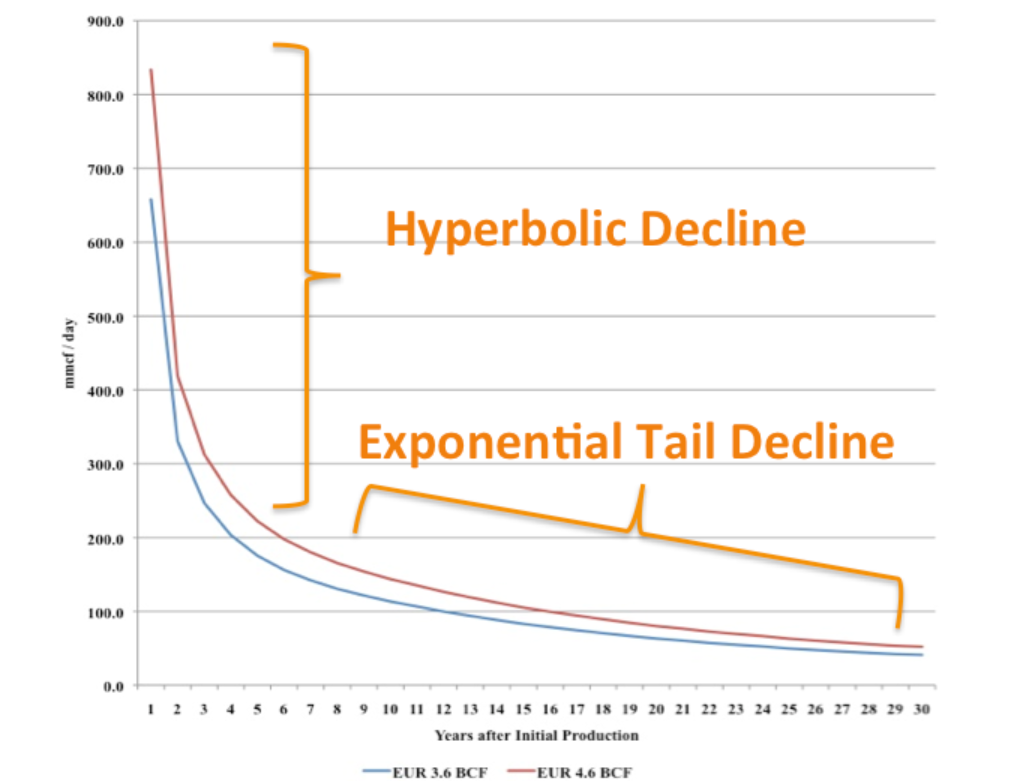
Decline curves, such as the following, are developed for each of these productivity tiers. The per-well production decline curves were found to be inversely proportional to the square root of time for the first 8-10 years of well life, followed by exponential decline as what the geologists call “interfracture interference” began to affect production.
A write-up of the Barnett Shale study by its lead researchers is available to the public in two parts at the following URL’s:
Econometric analysis of well production, based on porosity and a range of other geologic and well parameters is contained in a followup report Panel Analysis of Well Production History in the Barnett Shale conducted under the auspices of Rice University.
Natural Gas Production Forecasts
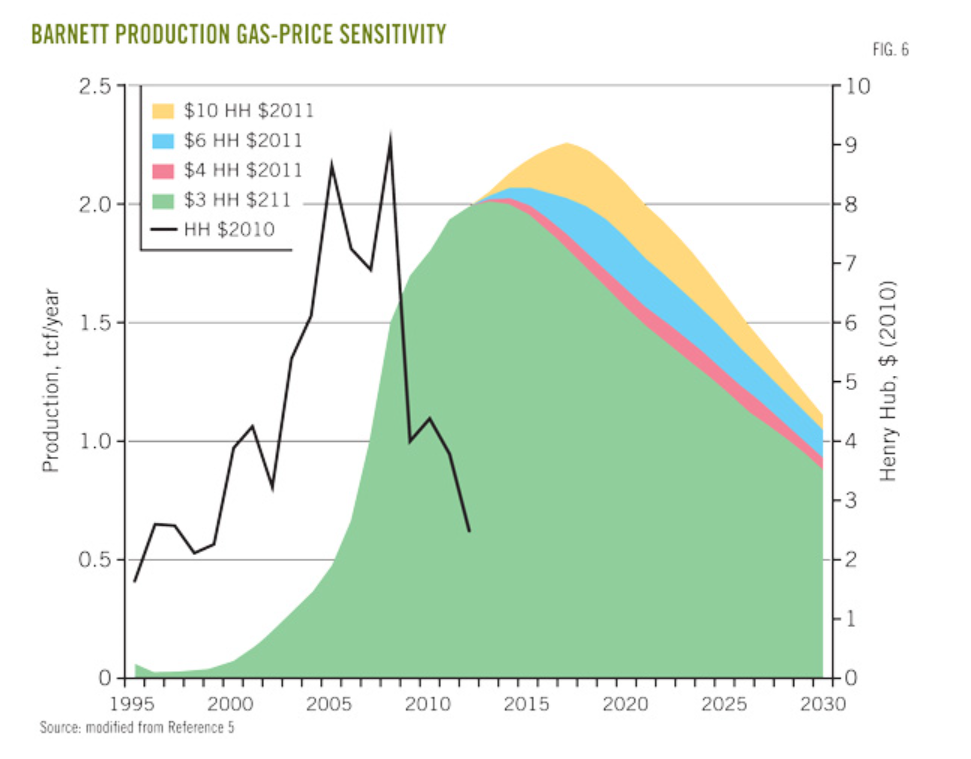
Among the most amazing conclusions for me are the predictions regarding total natural gas production at various prices, shown below.
This results from a forecast of field development (drilling) which involved a period of backcasting 2011-2012 to calibrate the BEG economic and production forecast models.
Essentially, it this low price regime continues through 2015, there is a high likelihood we will see declining production in the Barnett field as a whole.
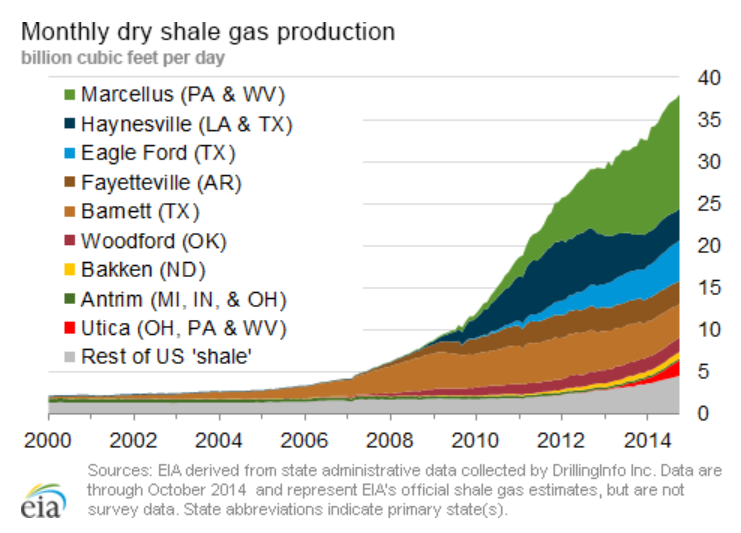
Of course, there are other major fields – the Bakken, the Marcellus, the Eagle-Ford, and a host of smaller, newer fields.
But the Barnett Shale study provides good parameters for estimating EUR (estimate ultimate recovery) in these other fields, as well as time profiles of production at various prices.
Forecasting and data analytics increasingly are recognized as valued partners in nonconventional oil and gas production.
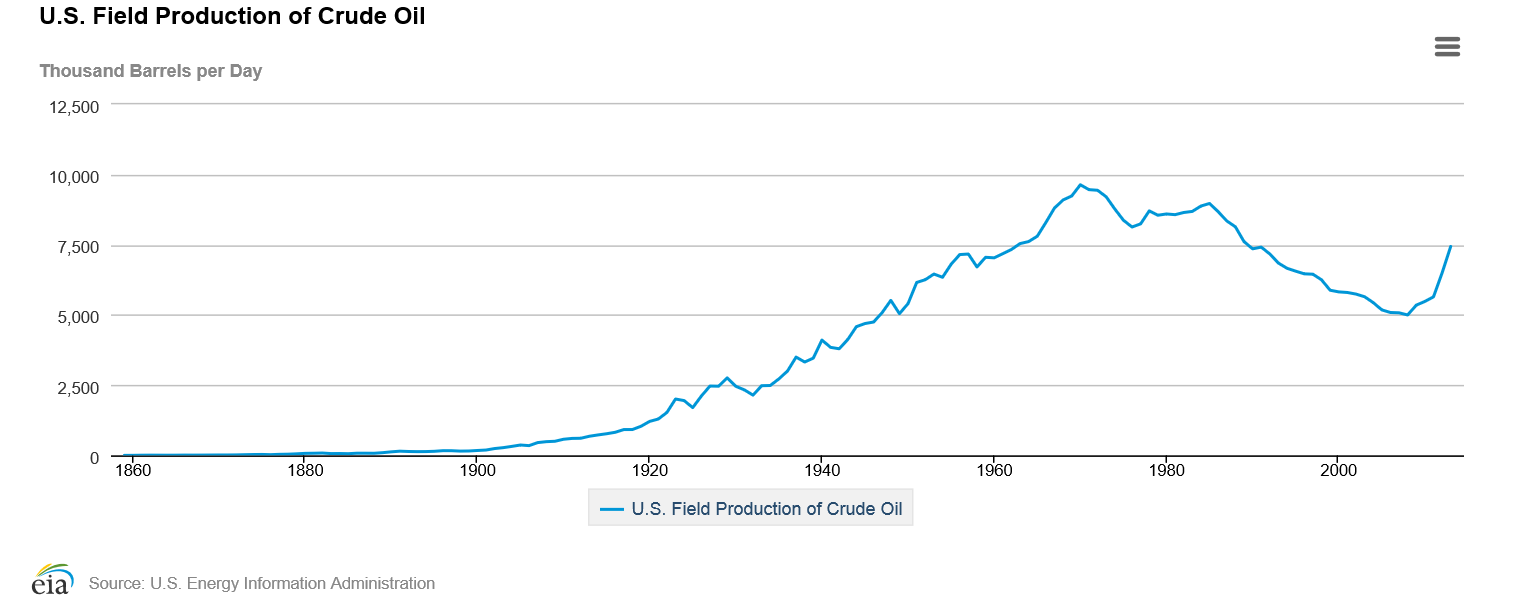
Fracking and US Oil/Gas Production
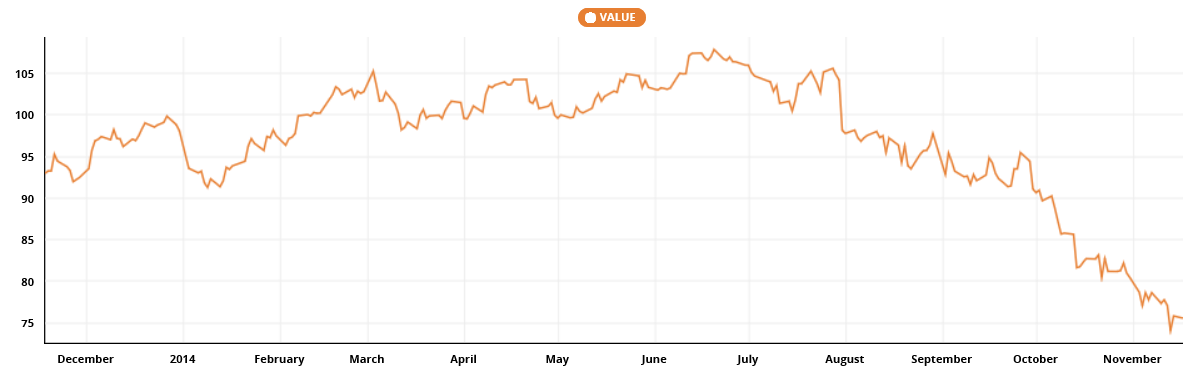
“Video Friday” here presented a YouTube with Brian Ellis – a Michigan University engineer – discussing hydraulic fracturing and horizontal drilling (“fracking”).
Fracking produced the hockey stick at the end of this series.
These new technologies also are responsible for a bonanza of natural gas, so much that it often has nowhere to go – given the limited pipeline infrastructure and LNG processing facilities.
Rapid Decline Curves for Fracking Oil and Gas
In contrast to conventional wells, hydraulic fracturing and horizontal drilling (“fracking”) produces oil and gas wells with rapid decline curves.
One forecasting problem in this context, therefore, is simply to take histories from wells and forecast their EUR’s.
Increasingly, software solutions are applying automatic fitting methods to well data to derive decline curves and other shale oil and gas field parameters.
This whole subject is developing rapidly, and huge changes in the US industry are expected, if oil and gas prices continue below $60 a barrel and $4 MMBtu.
The forecasting problem may shift from well and oil field optimization to evaluation of the wider consequences of recent funding of the shale oil and gas boom. But, again, the analytics are available to do this, to a large extent, and I want to post up some of what I have discovered in this regard.
Here is Brian Ellis from Michigan University Engineering with a look at the technology of hydraulic fracturing (fracking) and horizontal drilling – the innovations that recently pushed US oil production near the 10 million barrel per day mark.
I’m putting this up, rather than other, often excellent film clips showing people lighting water from their kitchen taps because the scale of shale oil and gas production has become so large. There really is a huge tradeoff between current employment and business activity and long term environmental effects.
Price, rather than environmental concerns, are likely to be the crucial factor in any scaleback.
At the same time, there is the possibility of further technical advance in the US shale oil and gas technologies, advances which may push extraction prices lower, giving the industry a longer lease during what may be a year or more of lower oil prices.
Fracking and its possible dynamics are critical to a lot of business activity and, thus, forecasting in the US.
Well, readers here may have noticed, Business Forecast Blog correctly predicted the OPEC decision about reducing oil production at their Thanksgiving Thursday (November 27) meeting in Vienna.
VIENNA — Crude prices plunged Thursday after the powerful Organization of Petroleum Exporting Countries said it wouldn’t cut production levels to stem the collapse in oil prices that have fallen 40% since June.
Saudi Arabia’s oil minister Ali Al-Naimi delivered the news as he left a nearly five-hour meeting of the cartel’s 12 oil ministers here.
Our post was called The Limits of OPEC and was studded with passages of deep foresight, such as
I’m kind of a contrarian here. I think the sound and fury about this Vienna meeting on Thanksgiving may signify very little in terms of oil prices – unless global (and especially Chinese) economic growth picks up. As the dominant OPEC producer, Saudi Arabia may have market power, but, otherwise, there is little evidence OPEC functions as a cartel. It’s hard to see, also, that the Saudi’s would unilaterally reduce their output only to see higher oil prices support US frackers continuing to increase their production levels at current rates.
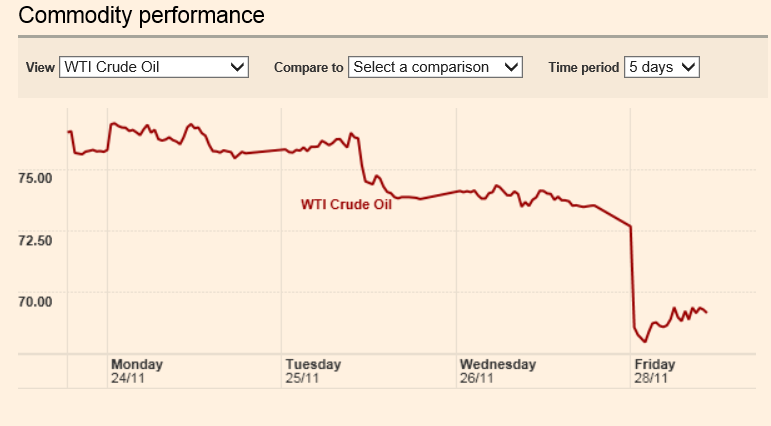
The immediate response to the much-anticipated OPEC meeting was a plunge in the spot price of West Texas Intermediate (WTI) to below $70 a barrel.
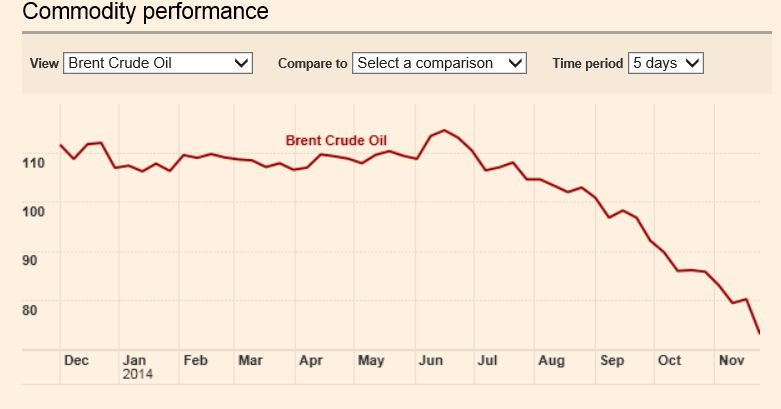
Brent, the other pricing standard, fared a little better, but dropped significantly,
The Reuters article on the OPEC decision – Saudis block OPEC output cut, sending oil price plunging – is full of talk that letting prices drift lower, perhaps down to $60-65 a barrel, is motivated by a desire to wing higher-cost US producers, and also, maybe, to squeeze Russia and Iran – other players who are out of favor with Saudi Arabia and other Gulf oil states.
Forecasting Issues and Techniques
Advice – get the data, get the facts. Survey Bloomberg and other media by relevant news story and topic, but whenever possible, go to the source.
For example, lower oil prices may mean Saudi Arabia and some other Gulf oil states have to rely more on accumulated foreign exchange to pay their bills, since their lavish life-styles probably adjusted to higher prices (even though raw production costs may be as low as $25 a barrel). Just how big are these currency reserves, and can we watch them being drawn down? There is another OPEC meeting apparently scheduled for June 2015
There’s rampant speculation and zero consensus about the direction OPEC will take in their upcoming Vienna meeting, November 27.
Last Friday, for example. Bloomberg reported,
The 20 analysts surveyed this week by Bloomberg are perfectly divided, with half forecasting the Organization of Petroleum Exporting Countries will cut supply on Nov. 27 in Vienna to stem a plunge in prices while the other half expect no change. In the seven years since the surveys began, it’s the first time participants were evenly split. The only episode that created a similar debate was the OPEC meeting in late 2007, when crude was soaring to a record.
Many discussions pose the strategic choice as one between –
(a) cutting production to maintain prices, but at the cost of losing market share to the ascendant US producers, and
(b) sustaining current production levels, thus impacting higher-cost US producers (if the low prices last long enough), but risking even lower oil prices – through speculation and producers breaking ranks and trying to grab what they can.
Lybia, Ecuador, and Venezuela are pushing for cuts in production. Saudi Arabia is not tipping its hand, but is seen by many as on the fence about reducing production.
I’m kind of a contrarian here. I think the sound and fury about this Vienna meeting on Thanksgiving may signify very little in terms of oil prices – unless global (and especially Chinese) economic growth picks up. As the dominant OPEC producer, Saudi Arabia may have market power, but, otherwise, there is little evidence OPEC functions as a cartel. It’s hard to see, also, that the Saudi’s would unilaterally reduce their output only to see higher oil prices support US frackers continuing to increase their production levels at current rates.
OPEC Members, Production, and Oil Prices
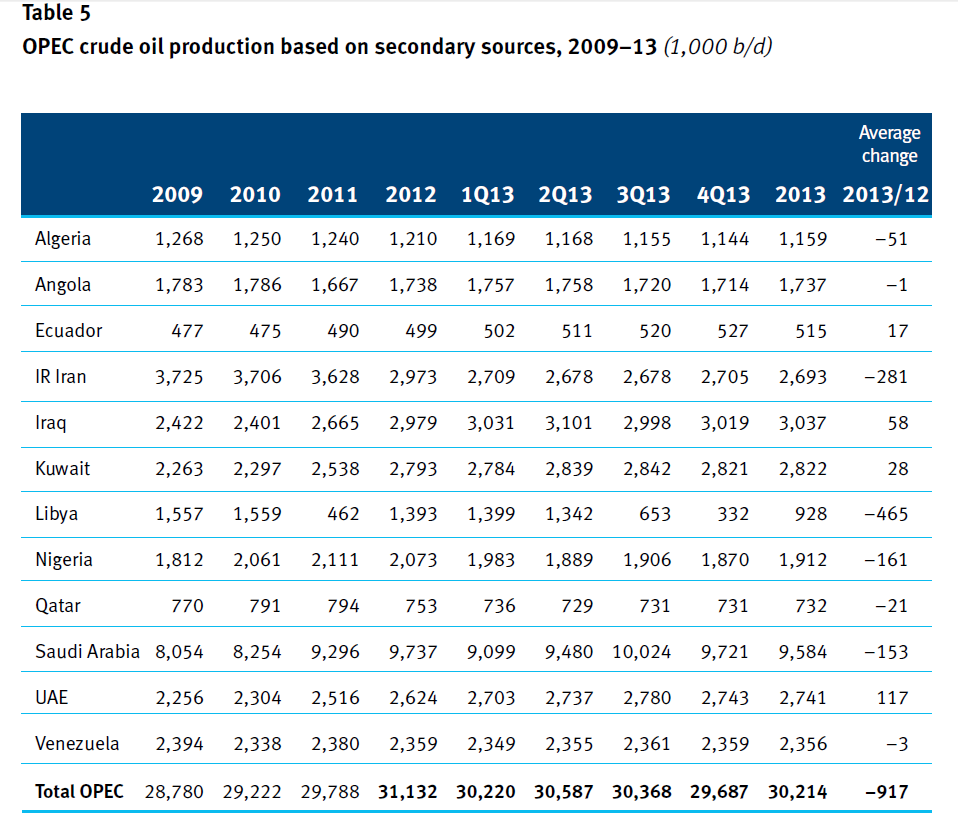
The Organization of Petroleum Exporting Countries (OPEC) has twelve members, whose production over recent years is documented in the following table.
According to the OPEC Annual Report, global oil supply in 2013 ran about 90.2 mb/d, while, as the above table indicates, OPEC production was 30.2 mb/d. So OPEC provided 33.4 percent of global oil supplies in 2013 with Saudi Arabia being the largest producer – overwhelmingly.
There is a growing literature questioning whether OPEC is an effective cartel.
This includes the recent OPEC: Market failure or power failure? which argues OPEC is not a working cartel and that Saudi Arabia’s ideal long term policy involves moderate prices guaranteed to assure continuing markets for their vast reserves.
Other recent studies include Does OPEC still exist as a cartel? An empirical investigation which deploys time series tests for cointegration and Granger causality, finding that OPEC is generally a price taker, although cartel-like features may adhere to a subgroup of its members.
Colgan poses four tests of whether OPEC functions as a cartel -.
new members of the cartel have a decreasing or decelerating production rate (test #1); members should generally produce quantities at or below their assigned quota (test #2); changes in quotas should lead to changes in production, creating a correlation (test #3); and members of the cartel should generally produce lower quantities (i.e., deplete their oil at a lower rate) on average than non-members of the cartel (test #4)
Each of these tests fail, putting, as he writes, the burden of proof on those who would claim that OPEC is a cartel.
Here’s Colgan’s statistical analysis of cheating on the quotas.
On average, he calculates that the nine principal members of OPEC produced 10 percent more oil than their quotas allowed – which is equivalent to 1.8 million barrels per day, on average, which is more than the total daily output of Libya in 2009.
Finally, there is the extremely wonkish evidence from academic studies of oil and gas markets more generally.
There are, for example, several long term studies of cointegration of oil and gas markets. These studies rely on tests for unit roots which, as I have observed, have low statistical power. Nevertheless, the popularity of this hypothesis seems to be consistent with very little specific influence of OPEC on oil production and prices in recent decades. The 1970’s may well be an exception, it should be noted.
We will see in coming weeks. Or maybe not, since it still will be necessary to sort out influences such as quickening of the pace of economic growth in China with recent moves by the Chinese central bank to reduce interest rates and keep the bubble going.
If I were betting on this, however, I would opt for a continuation of oil prices below $100 a barrel, and probably below $90 a barrel for some time to come. Possibly even staying around $70 a barrel.
Sales and new product forecasting in data-limited (real world) contexts