Almost exactly a year ago, I posted on an algorithm and associated trading model for the S&P 500, the stock index which supports the SPY exchange traded fund.
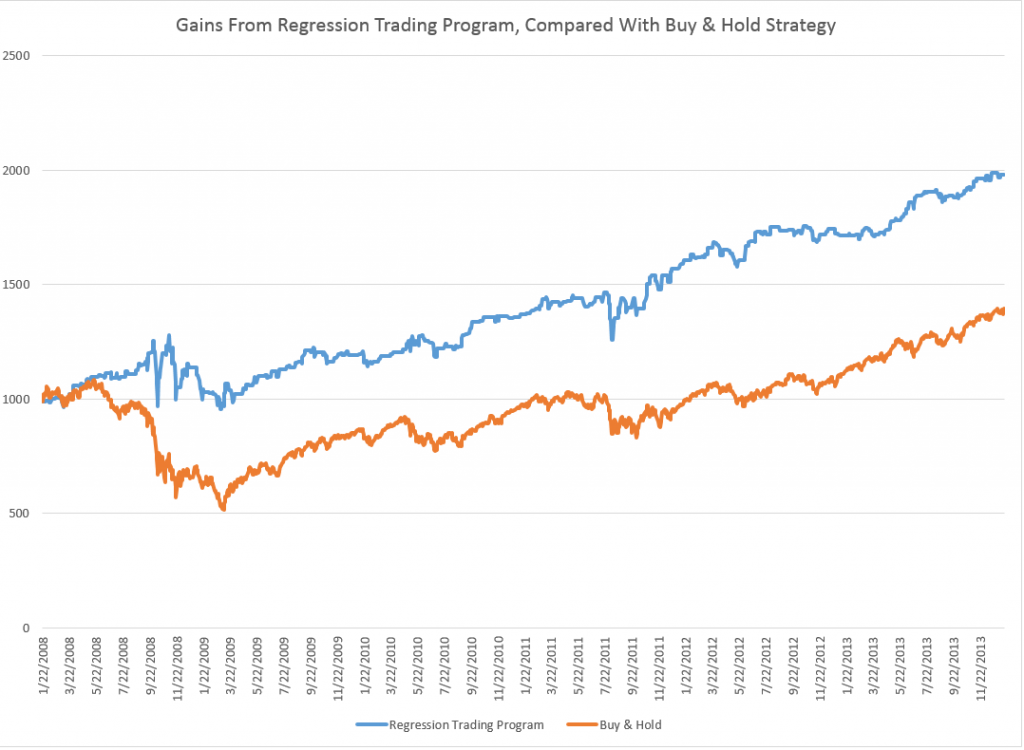
I wrote up an autoregressive (AR) model, using daily returns for the S&P 500 from 1993 to early 2008. This AR model outperforms a buy-and-hold strategy for the period 2008-2013, as the following chart shows.
The trading algorithm involves “buying the S&P 500” when the closing price indicates a positive return for the following trading day. Then, I “close out the investment” the next trading day at that day’s closing price. Otherwise, I stay in cash.
It’s important to be your own worst critic, and, along those lines, I’ve had the following thoughts.
First, the above graph disregards trading costs. Your broker would have to be pretty forgiving to execute 2000-3000 trades for less than the $500 you make over the buy-and-hold strategy. SO, I should deduct something for the trades in calculating the cumulative value.
The other criticism concerns high frequency trading. The daily returns are calculated against closing values, but, of course, to use this trading system you have to trade prior to closing. However, even a few seconds can make a crucial difference in the price of the S&P 500 or SPY – and even smaller intervals.
An Up-Dated AR Model
Taking some of these criticisms into account, I re-estimate an autoregressive model on more recent data –again calculating returns against closing prices on successive trading days.
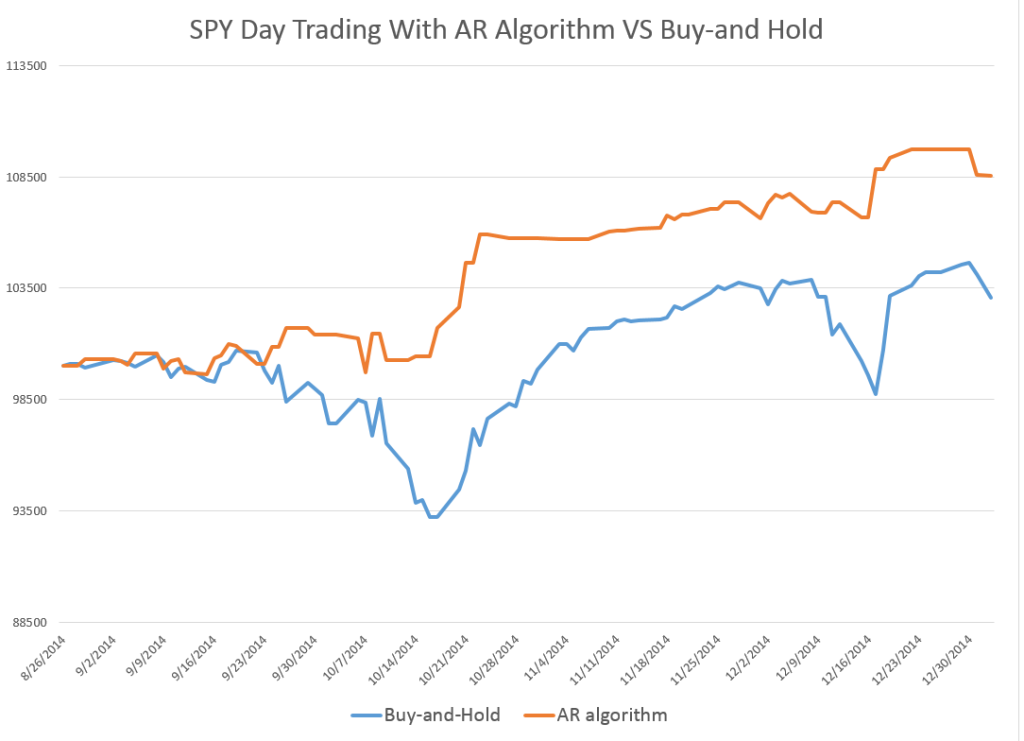
This time I start with an initial investment of $100,000, and deduct $5 per trade off the totals as they cumulate.
I also utilize only seven (7) lags for the daily returns. This compares with the 30 lag model from the post a year ago, and I estimate the current model with OLS, rather than maximum likelihood.
The model is
Rt = 0.0007-0.0651Rt-1+0.0486Rt-2-0.0999Rt-3-0.0128Rt-4-0.1256Rt-5 +0.0063Rt-6-0.0140Rt-7
where Rt is the daily return for trading day t. This model originates on data from June 11, 2011. The coefficients of the equation result from bagging OLS regressions – developing coefficient estimates for 100,000 similar size samples drawn with replacement from this dataset of 809 observations. These 100,000 coefficient estimates are averaged to arrive at the numbers shown above.
Here is the result of applying my revised model to recent stock market activity. The results are out-of-sample. In other words, I use the predictive equation which is calculated over data prior to the start of the investment comparison. I also filter the positive predictions for the next day closing price, only acting when they are a certain size or larger.
There is a 2-3 percent return on a hundred thousand dollar investment in one month, and a projected annual return on the order of 20-30 percent.
The current model also correctly predicts the sign of the daily return 58 percent of the time, compared with a much lower figure for the model from a year ago.
This looks like the best thing since sliced bread.
But wait – what about high frequency trading?
I’m exploring the implementation of this model – and maybe should never make it public.
But let me clue you in on what I suspect, and some evidence I have.
So, first, it is interesting the gains from trading on closing day prices more than evaporate by the opening of the New York Stock Exchange, following the generation of a “buy” signal according to this algorithm.
In other words, if you adjust the trading model to buy at the open of the following trading day, when the closing price indicates a positive return for the following day – you do not beat a buy-and-hold strategy. Something happens between the closing and the opening of the NYSE market for the SPY.
Someone else knows about this model?
I’m exploring the “final second’ volatility of the market, focusing on trading days when the closing prices look like they might come in to indicate a positive return the following day. This is complicated, and it puts me into issues of predictability in high frequency data.
I also am looking at the SPY numbers specifically to bring this discussion closer to trading reality.
Bottom line – It’s hard to make money in the market on trading algorithms if you are a day-trader – although probably easier with a super-computer at your command and when you sit within microseconds of executing an order on the NY Stock Exchange.
But these researches serve to indicate one thing fairly clearly. And that is that there definitely are aspects of stock prices which are predictable. Acting on the predictions is the hard part.
And Postscript: Readers may have noticed a lesser frequency of posting on Business Forecast blog in the past week or so. I am spending time running estimations and refreshing and extending my understanding of some newer techniques. Keep checking in – there is rapid development in “real world forecasting” – exciting and whiz bang stuff. I need to actually compute the algorithms to gain a good understanding – and that is proving time-consuming. There is cool stuff in the data warehouse though.

