Financial and asset bubbles are controversial, amazingly enough, in standard economics, where a bubble is defined as a divergence in a market from fundamental value. The problem, of course, is what is fundamental value. Maybe investors in the dot.com frenzy of the late 1990’s believed all the hype about never-ending and accelerating growth in IT, as a result of the Internet.
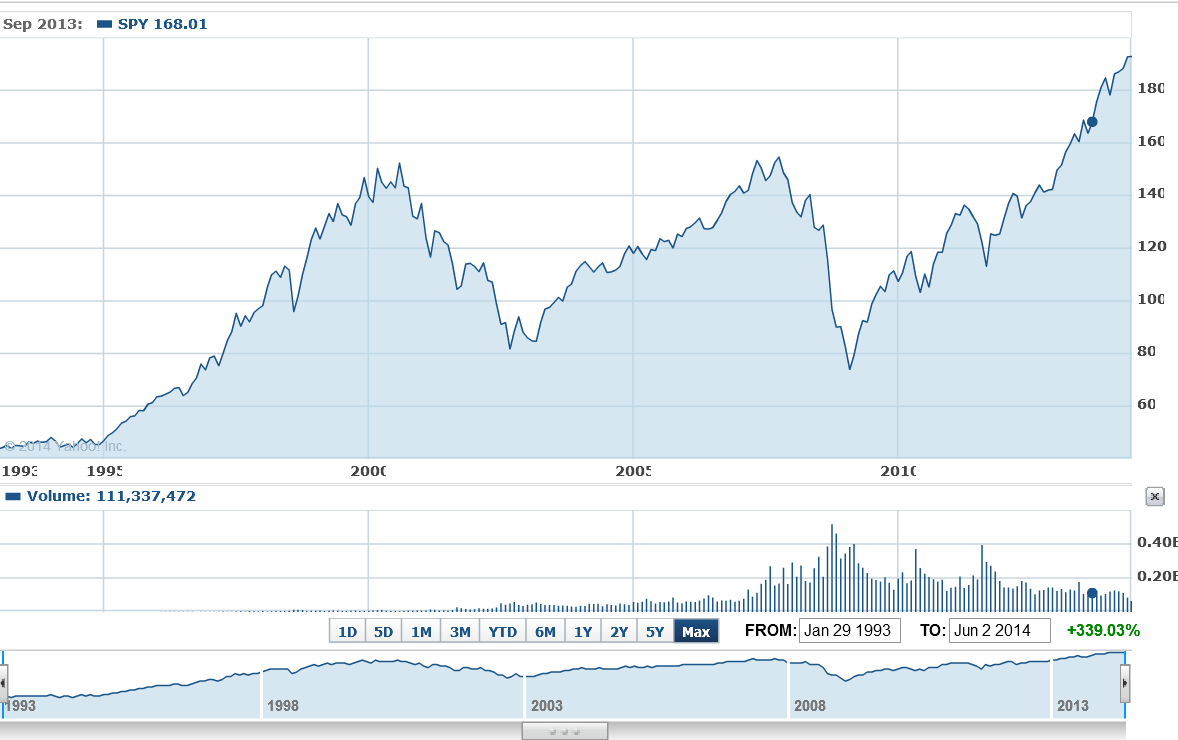
So we have this chart for the ETF SPY which tracks the S&P500. Now, there are similarities between the upswing of the two previous peaks – which both led to busts – and the current surge in the index.
Where is this going to end?
Well, I’ve followed the research of Didier Sornette and his co-researchers, and, of course, Sornette’s group has an answer to this question, which is “probably not well.” Currently, Professor Sornette occupies the Chair of Entreprenuerial Risk at the Swiss Federal Institute of Technology in Zurich.
There is an excellent website maintained by ETH Zurich for the theory and empirical analysis of financial bubbles.
Sornette and his group view bubbles from a more mathematical perspective, finding similarities in bubbles of durations from months to years in the concept of “faster than exponential growth.” At some point, that is, asset prices embark on this type of trajectory. Because of various feedback mechanisms in financial markets, as well as just herding behavior, asset prices in bubble mode oscillate around an accelerating trajectory which – at some point that Sornette claims can be identified mathematically – becomes unsupportable. At such a moment, there is a critical point where the probability of a collapse or reversal of the process becomes significantly greater.
This group is on the path of developing a new science of asset bubbles, if you will.
And, by this logic, there are positive and negative bubbles.
The sharp drop in stock prices in 2008, for example, represents a negative stock market bubble movement, and also is governed or described, by this theory, by an underlying differential equation. This differential equation leads to critical points, where the probability of reversal of the downward price movement is significantly greater.
I have decided I am going to compute the full price equation suggested by Sornette and others to see what prediction for a critical point emerges for the S&P 500 or SPY.
But actually, this would be for my own satisfaction, since Sornette’s group already is doing this in the Financial Crisis Observatory.
I hope I am not violating Swiss copyright rules by showing the following image of the current Financial Crisis Observatory page (click to enlarge)

As you notice there are World Markets, Commodities, US Sectors, US Large Cap categories and little red and green boxes scattered across the page, by date.
The red boxes indicate computations by the ETH Zurich group that indicate the financial series in question is going into bubble mode. This is meant as a probabilistic evaluation and is accompanied by metrics which indicate the likelihood of a critical point. These computations are revised daily, according to the site.
For example, there is a red box associated with the S&P 500 in late May. If you click on this red box, you produces the following chart.
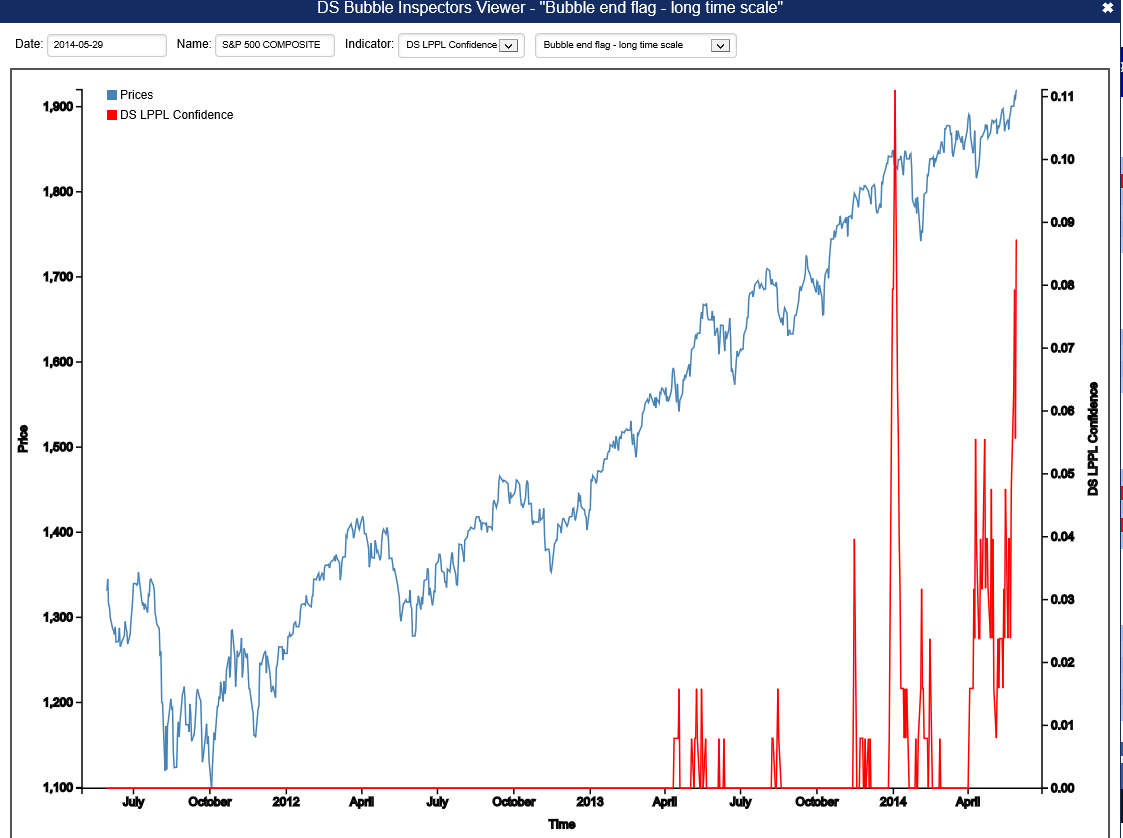
The implication is that the highest red spike in the chart at the end of December 2013 is associated with a reversal in the index, and also that one would be well-advised to watch for another similar spike coming up.
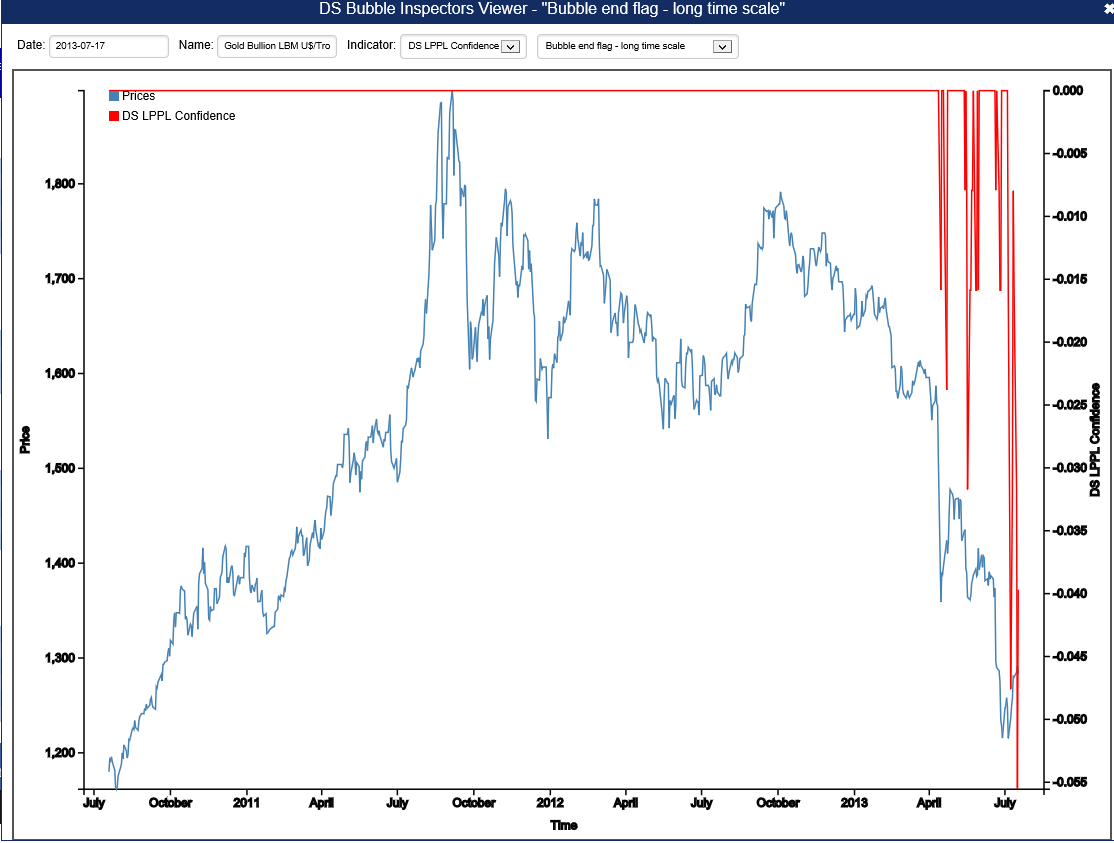
Negative bubbles, as I mention, also are in the lexicon. One of the green boxes for gold, for example, produces the following chart.
This is fascinating stuff, and although Professor Sornette has gotten some media coverage over the years, even giving a TED talk recently, the economics profession generally seems to have given him almost no attention.
I plan a post on this approach with a worked example. It certainly is much more robust that some other officially sanctioned approaches.