What if you could predict the Chicago Fed National Activity Index (CFNAI), interpolated monthly values of the growth of nominal GDP, the Aruoba-Diebold-Scotti (ADS) Business Conditions Index, and the Kansas City Financial Stress Index (KCFSI) three, five, seven, even twelve months into the future? What if your model also predicted turning points in these US indexes, and also similar macroeconomic variables for countries in Asia and the European Union? And what if you could do all this with data on monthly returns on the stock prices of companies in the financial sector?
That’s the claim of Linda Allen, Turan Bali, and Yi Tang in a fascinating 2012 paper Does Systemic Risk in the Financial Sector Predict Future Economic Downturns?
I’m going to refer to these authors as Bali et al, since it appears that Turan Bali, shown below, did some of the ground-breaking research on estimating parametric distributions of extreme losses. Bali also is the corresponding author.
Bali et al develop a new macroindex of systemic risk that predicts future real economic downturns which they call CATFIN.
CATFIN is estimated using both value-at-risk (VaR) and expected shortfall (ES) methodologies, each of which are estimated using three approaches: one nonparametric and two different parametric specifications. All data used to construct the CATFIN measure are available at each point in time (monthly, in our analysis), and we utilize an out-of-sample forecasting methodology. We find that all versions of CATFIN are predictive of future real economic downturns as measured by gross domestic product (GDP), industrial production, the unemployment rate, and an index of eighty-five existing monthly economic indicators (the Chicago Fed National Activity Index, CFNAI), as well as other measures of real macroeconomic activity (e.g., NBER recession periods and the Aruoba-Diebold-Scott [ADS] business conditions index maintained by the Philadelphia Fed). Consistent with an extensive body of literature linking the real and financial sectors of the economy, we find that CATFIN forecasts aggregate bank lending activity.
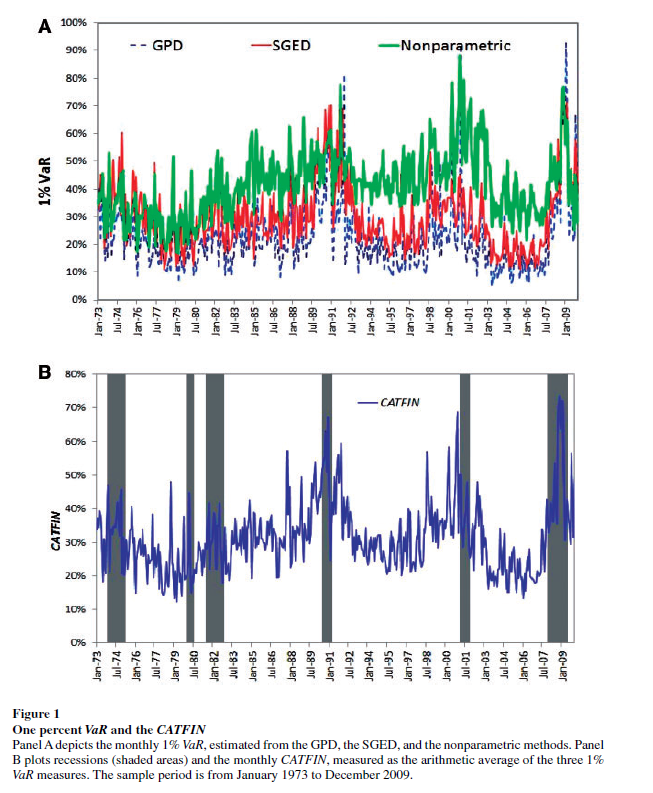
The following graphic illustrates three components of CATFIN and the simple arithmetic average, compared with US recession periods.
Thoughts on the Method
OK, here’s the simple explanation. First, these researchers identify US financial companies based on definitions in Kenneth French’s site at the Tuck School of Business (Dartmouth). There are apparently 500-1000 of these companies for the period 1973-2009. Then, for each month in this period, rates of return of the stock prices of these companies are calculated. Then, three methods are used to estimate 1% value at risk (VaR) – two parametric methods and one nonparametric methods. The nonparametric method is straight-forward –
The nonparametric approach to estimating VaR is based on analysis of the left tail of the empirical return distribution conducted without imposing any restrictions on the moments of the underlying density…. Assuming that we have 900 financial firms in month t , the nonparametric measure of1%VaR is the ninth lowest observation in the cross-section of excess returns. For each month, we determine the one percentile of the cross-section of excess returns on financial firms and obtain an aggregate 1% VaR measure of the financial system for the period 1973–2009.
So far, so good. This gives us the data for the graphic shown above.
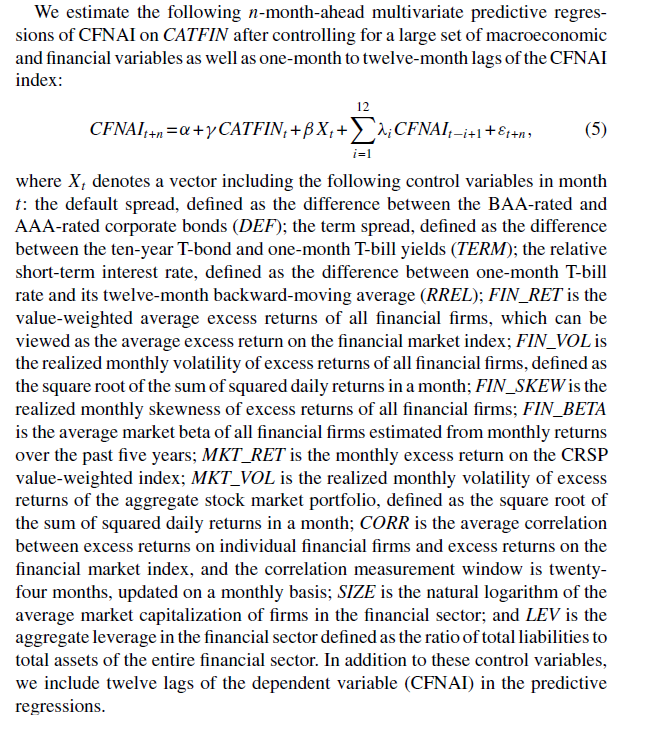
In order to make this predictive, the authors write that –
Like a lot of leading indicators, the CATFIN predictive setup “over-predicts” to some extent. Thus, there are there are five instances in which a spike in CATFIN is not followed by a recession, thereby providing a false positive signal of future real economic distress. However, the authors note that in many of these cases, predicted macroeconomic declines may have been averted by prompt policy intervention. Their discussion of this is very interesting, and plausible.
What This Means
The implications of this research are fairly profound – indicating, above all, the priority of the finance sector in leading the overall economy today. Certainly, this consistent with the balance sheet recession of 2008-2009, and probably will continue to be relevant going forward – since nothing really has changed and more concentration of ownership in finance has followed 2008-2009.
I do think that Serena Ng’s basic point in a recent review article probably is relevant – that not all recessions are the same. So it may be that this method would not work as well for, say, the period 1945-1970, before financialization of the US and global economies.
The incredibly ornate mathematics of modeling the tails of return distributions are relevant in this context, incidentally, since the nonparametric approach of looking at the empirical distributions month-by-month could be suspect because of “cherry-picking.” So some companies could be included, others excluded to make the numbers come out. This is much difficult in a complex maximum likelihood estimation process for the location parameters of these obscure distributions.
So the question on everybody’s mind is – WHAT DOES THE CATFIN MODEL INDICATE NOW ABOUT THE NEXT FEW MONTHS? Unfortunately, I am unable to answer that, although I have corresponded with some of the authors to inquire whether any research along such lines can be cited.
Bottom line – very impressive research and another example of how important science can get lost in the dance of prestige and names.


