
Well, US markets have closed for the week, and here is an update on how our forecasts did.
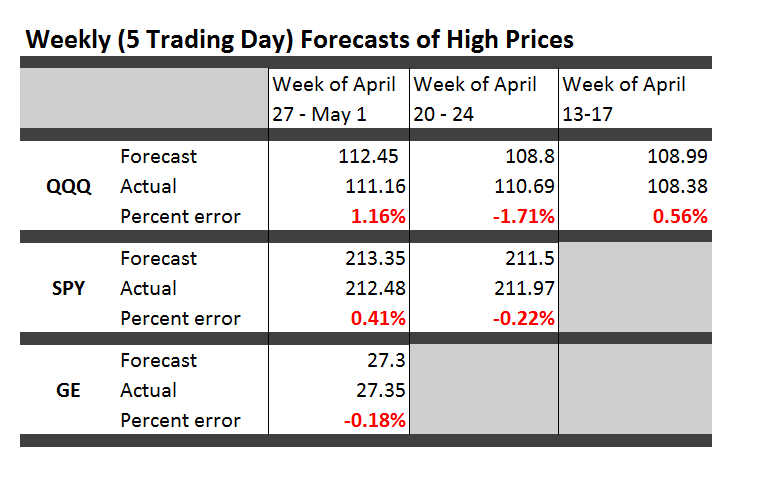
Apart from the numbers, almost everything I wrote last Monday about market trends was wrong. Some of the highs were reached Monday, for example, and the market dived after that. The lowest forecast error is for GE, which backtesting suggests is harder to forecast than the SPY and QQQ.
I will keep doing this, expanding the securities covered for several weeks. I also hope to get smarter about using this tool.
Forecast Turning Points
I want to comment on how to use this approach to get forward information about turning points in the market.
While the research is on-going, the basic finding is that turning points, which we need to define as changes in the direction of a security or index which are sustained for several trading days or periods, are indicated by a simple tactic.
Suppose the QQQ reaches a high and then declines for several days or longer. Then, the forecasts of the high over 1, 2, and several days will tend to freeze at their initial or early values, while forecasts of low price over an expanding series of forecast periods will drop. There will, in other words, be a pronounced divergence between the forecasts of the high and low, when a turning point is in the picture.
There are interesting charts from 2008 highlighting these relationships between the high and low forecasts over telescoping forecast horizons.
I am fairly involved in some computer programming around this “proximity variable forecasting approach.” However, I am happy to dialogue with readers and interested parties via the Comments section in this blog. If you want to communicate off-line, send your email and what your interest or concern is.
And check the forecasts for this coming week, which I will have out Monday morning. Should be an interesting week.