Looking ahead, I’m almost sure I want to explore forecasting in the medical field this coming week. Menzie Chin at Econbrowser, for example, highlights forecasts that suggest states opting out of expanded Medicare are flirting with higher death rates. This sets off a flurry of comments, highlighting the importance and controversy attached to various forecasts in the field of medical practice.
There’s a lot more – from bizarre and sad mortality trends among Russian men since the collapse of the Soviet Union, now stabilizing to an extent, to systems which forecast epidemics, to, again, cost and utilization forecasts.
Today, however, I want to wind up this phase of posts on forecasting the stock and related financial asset markets.
Market Expectations in the Cross Section of Present Values
That’s the title of Bryan Kelly and Seth Pruitt’s article in the Journal of Finance, downloadable from the Social Science Research Network (SSRN).
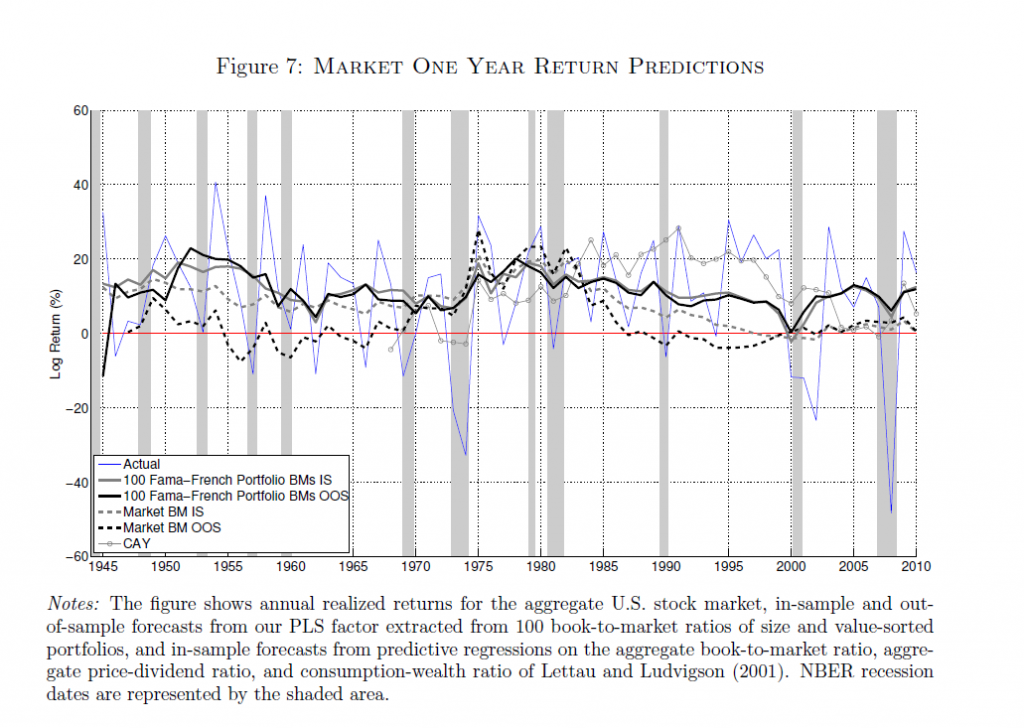
The following chart from this paper shows in-sample (IS) and out-of-sample (OOS) performance of Kelly and Pruitt’s new partial least squares (PLS) predictor, and IS and OOS forecasts from another model based on the aggregate book-to-market ratio. (Click to enlarge)
The Kelly-Pruitt PLS predictor is much better in both in-sample and out-of-sample than the more traditional regression model based on aggregate book-t0-market ratios.
What Kelly and Pruitt do is use what I would call cross-sectional time series data to estimate aggregate market returns.
Basically, they construct a single factor which they use to predict aggregate market returns from cross-sections of portfolio-level book-to-market ratios.
So,
To harness disaggregated information we represent the cross section of asset-specific book-to-market ratios as a dynamic latent factor model. We relate these disaggregated value ratios to aggregate expected market returns and cash flow growth. Our model highlights the idea that the same dynamic state variables driving aggregate expectations also govern the dynamics of the entire panel of asset-specific valuation ratios. This representation allows us to exploit rich cross-sectional information to extract precise estimates of market expectations.
This cross-sectional data presents a “many predictors” type of estimation problem, and the authors write that,
Our solution is to use partial least squares (PLS, Wold (1975)), which is a simple regression-based procedure designed to parsimoniously forecast a single time series using a large panel of predictors. We use it to construct a univariate forecaster for market returns (or dividend growth) that is a linear combination of assets’ valuation ratios. The weight of each asset in this linear combination is based on the covariance of its value ratio with the forecast target.
I think it is important to add that the authors extensively explore PLS as a procedure which can be considered to be built from a series of cross-cutting regressions, as it were (See their white paper on three-pass regression filter).
But, it must be added, this PLS procedure can be summarized in a single matrix formula, which is
Readers wanting definitions of these matrices should consult the Journal of Finance article and/or the white paper mentioned above.
The Kelly-Pruitt analysis works where other methods essentially fail – in OOS prediction,
Using data from 1930-2010, PLS forecasts based on the cross section of portfolio-level book-to-market ratios achieve an out-of-sample predictive R2 as high as 13.1% for annual market returns and 0.9% for monthly returns (in-sample R2 of 18.1% and 2.4%, respectively). Since we construct a single factor from the cross section, our results can be directly compared with univariate forecasts from the many alternative predictors that have been considered in the literature. In contrast to our results, previously studied predictors typically perform well in-sample but become insignifcant out-of-sample, often performing worse than forecasts based on the historical mean return …
So, the bottom line is that aggregate stock market returns are predictable from a common-sense perspective, without recourse to abstruse error measures. And I believe Amit Goyal, whose earlier article with Welch contests market predictability, now agrees (personal communication) that this application of a PLS estimator breaks new ground out-of-sample – even though its complexity asks quite a bit from the data.
Note, though, how volatile aggregate realized returns for the US stock market are, and how forecast errors of the Kelly-Pruitt analysis become huge during the 2008-2009 recession and some previous recessions – indicated by the shaded lines in the above figure.
Still something is better than nothing, and I look for improvements to this approach – which already has been applied to international stocks by Kelly and Pruitt and other slices portfolio data.


