Looking for case studies of data analytics or predictive analytics, or for Big Data applications?
You can hardly do better, on a first cut, than peruse the material now available from October’s Analytics 2013 Conference, held at the Hyatt Regency Hotel in Orlando, Florida.
Presented by SAS, dozens of presentations and posters from the Conference can be downloaded as zip files, unbundling as PDF files.
Download the conference presentations and poster presentations (.zip)
I also took an hour to look at the Keynote Presentation of Dr. Sven Crone of Lancaster University in the UK, now available on YouTube.
Crone, who also is affiliated with the Lancaster Centre for Forecasting, gave a Keynote which was, in places, fascinating, and technical and a little obscure elsewhere – worth watching if you time, or can run it in the background while you sort through your desk, for example.
A couple of slides caught my attention.
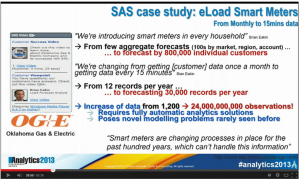
One segment gave concrete meaning to the explosion of data available to forecasters and analysts. For example, for electric power load forecasting, it used be the case that you had, perhaps, monthly total loads for the system or several of its parts, or perhaps daily system loads. Now, Crone notes the data to be modeled has increased by orders of magnitude, for example, with Smart Meters recording customer demand at fifteen minute intervals.
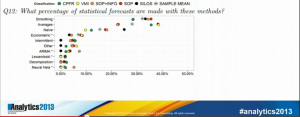
Another part of Crone’s talk which grabbed my attention was his discussion of forecasting techniques employed by 300 large manufacturing concerns, some apparently multinational in scale. The following graph – which is definitely obscure by virtue of its use of acronyms for types of forecasting systems, like SOP for Sales and Operation Planning – highlights that almost no company uses anything except the simplest methods for forecasting, relying largely on judgmental approaches. This aligns with a survey I once did which found almost no utilities used anything except the simplest per capita forecasting approaches. Perhaps things have changed now.
Crone suggests relying strictly on judgment becomes sort of silly in the face of the explosion of information now available to management.
Another theme Crone spins in an amusing, graphic way is that the workhorses of business forecasting, such as exponential smoothing, are really products from many decades ago. He uses funny pics of old business/office environments, asking whether this characterizes your business today.
The analytic meat of the presentation comes with exposition of bagging and boosting, as well as creative uses for k-means clustering in time series analysis.
At which point he descends into a technical wonderland of complexity.
Incidentally, Analytics 2014 is scheduled for Frankfurt, Germany June 4-5 this coming Spring.
Watch here for my follow-on post on boosting time series.


