Category Archives: applied macroeconomic forecasting methods

Is the Economy Moving Toward Recession?

Generally, a recession occurs when real, or inflation-adjusted Gross Domestic Product (GDP) shows negative growth for at least two consecutive quarters. But GDP estimates are available only at a lag, so it’s possible for a recession to be underway without confirmation from the national statistics.

Bottom line – go to the US Bureau of Economics Analysis website, click on the “National” tab, and you can get the latest official GDP estimates. Today, (January 25, 2016) this box announces “3rd Quarter 2015 GDP,” and we must wait until January 29th for “advance numbers” on the fourth quarter 2015 – numbers to be revised perhaps twice in two later monthly releases.

This means higher frequency data must be deployed for real-time information about GDP growth. And while there are many places with whole bunches of charts, what we really want is systematic analysis, or nowcasting.

A couple of initiatives at nowcasting US real GDP show that, as of December 2015, a recession is not underway, although the indications are growth is below trend and may be slowing.

This information comes from research departments of the US Federal Reserve Bank – the Chicago Fed National Activity Index (CFNAI) and the Federal Reserve Bank of Atlanta GDPNow model.

CFNAI

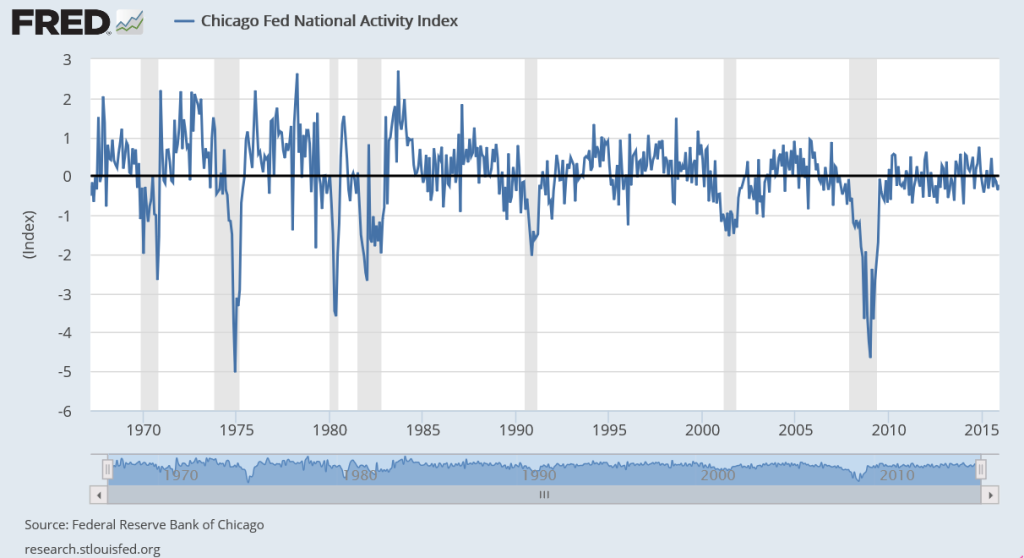
The Chicago Fed National Activity Index (CFNAI) for December 2015, released January 22nd, shows an improvement over November. The CFNAI moved –0.22 in December, up from –0.36 in November, and, in the big picture (see below) this number does not signal recession.

FREDCFNAI

The index is a weighted average of 85 existing monthly indicators of national economic activity from four general categories – production and income; employment, unemployment, and hours; personal consumption and housing; and sales, orders, and inventories.

It’s built – with Big Data techniques, incidentally- to have an average value of zero and a standard deviation of one.

Since economic activity trends up over time, generally, the zero for the CFNAI actually indicates growth above trend, while a negative index indicates growth below trend.

Recession levels are lower than the December 2015 number – probably starting around -0.7.

GDPNow Model

The GDPNow Model is developed at the Federal Reserve bank of Atlanta.

On January 20, the GDPNow site announced,

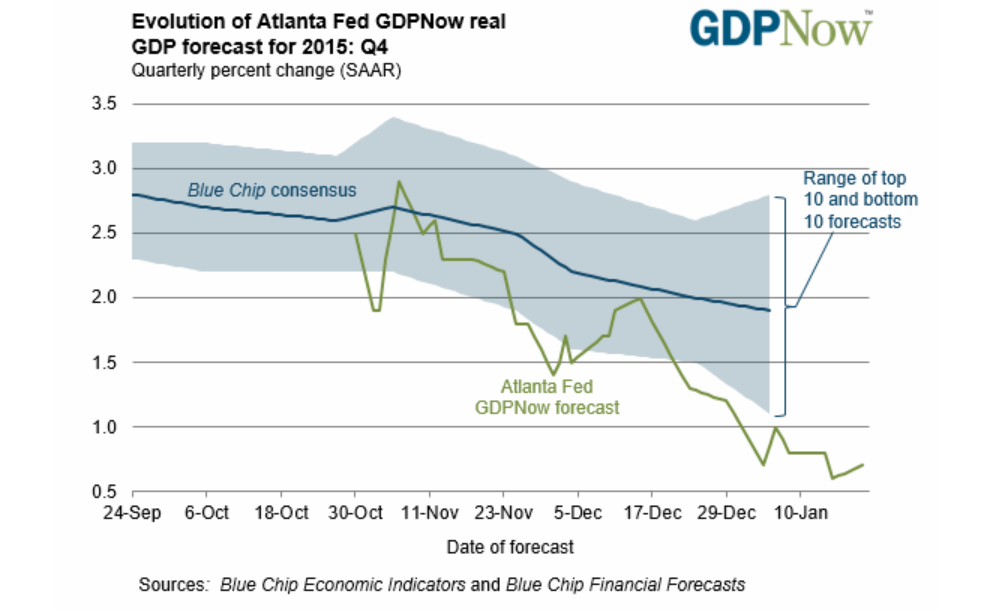
The GDPNow model forecast for real GDP growth (seasonally adjusted annual rate) in the fourth quarter of 2015 is 0.7 percent on January 20, up from 0.6 percent on January 15. The forecasts for fourth quarter real consumer spending growth and real residential investment growth each increased slightly after this morning’s Consumer Price Index release from the U.S. Bureau of Labor Statistics and the report on new residential construction from the U.S. Census Bureau.

The chart accompanying this accouncement shows a somewhat less sanguine possibility – namely that consensus estimates and the output of the GDPNow model have been on a downward trend if you look at things back to September 2015.

GDPNow

Economic Impact Modeling

I had a chance, recently, to watch computer simulations and interact with a regional economic impact model called REMI. This is a multi-equation model of some vintage (dating back the 1980’s) that has continued to evolve. It’s probably currently the leader in the field and has seen recent application to assessing proposals for increasing the minimum wage – in California, Vermont, San Francisco – and to evaluating  a carbon tax for the Citizen’s Climate Initiative  (see the video presentation at the end of this post).

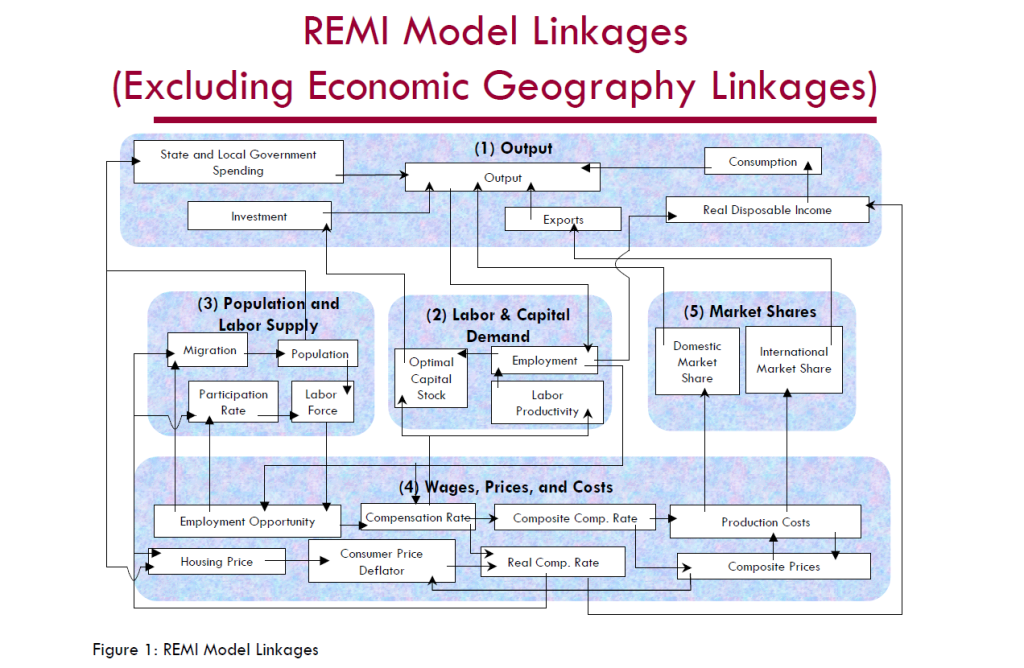
One way to interact with REMI is to click on blocks in a computer screen based on the following schematic

REMIblocs

I watched Brian Lewandowski do this at Colorado University’s Leeds School of Business.

Brian set parameters for increases in labor productivity for professional services and changes in investment in primary and secondary educational by clicking on boxes or blocks. Brian, Richard Wobbekind (pictured below), and I discussed results, and how REMI is helpful in exploring “what-if’s” and might have applications to  optimizing tax policies at the state level..

RichWobbekind

Wobbekind is himself a leader in preparing and presenting State-level forecasts for Colorado, and is active in the International Institute of Forecasters (IIF) which sponsors the International Journal of Forecasting and Foresight – as well as being an Associate Dean of CU’s Leeds School of Business.

Key Point About Multi-Equation, Multivariate Economic Models

From the standpoint of forecasting, the best way I can understand where REMI should be placed in the tool-kit is to remember the distinction between conditional and unconditional forecasts.

REMI model documentation indicates that,

The REMI model consists of thousands of simultaneous equations with a structure that is relatively straightforward. The exact number of equations used varies depending on the extent of industry, demographic, demand, and other detail in the specific model being used. The overall structure of the model can be summarized in five major blocks: (1) Output, (2) Labor and Capital Demand, (3) Population and Labor Supply, (4) Wages, Prices, and Costs, and (5) Market Shares

So you might have equations such as,

X1t = a0 + a1Z1t +..+ akZkt

X2t = b0 + b1Z1t +..+ brZrt

In order to predict unconditionally what (X1t,X2t) will be at some specific future time T*, it is necessary to correctly derive the parameters (a0,a1,..,ak,b0,b1,,…,br).

And it also is necessary, for an unconditional forecast, to predict the future values of all the exogenous variables on the right-hand side of the equation – that is all the Z variables that are not in fact X variables.

This usually means that unconditional forecasts from multivariate forecast models have wide and rapidly diverging confidence intervals.

Thus, if you try to forecast future employment in, say, California with such models, they may underperform simpler, single equation models – such as those based on exponential smoothing, for example.

This does not invalidate general systems models such as REMI.

Assuming the flows and linkages of sectors and blocks are realistic and correctly modeled, such models can help think through the consequences of policy decisions, new legislation, and infrastructure investments.

This is essentially to say that these models may present good conditional forecasts – basically “what-if’s” without being the best forecasting tool available.

Here is a video presentation based on the Citizen’s Climate Initiative application of REMI to assessing a carbon tax – an interesting proposal.

Failures of Forecasting in the Greek Crisis

The resounding “No” vote today (Sunday, July 5) by Greeks vis a vis new austerity proposals of the European Commission and European Central Bank (ECB) is pivotal. The immediate task at hand this week is how to avoid or manage financial contagion and whether and how to prop up the Greek banking system to avoid complete collapse of the Greek economy.

Greekvote

Thousands celebrate Greece’s ‘No’ vote despite uncertainty ahead

Greece or, more formally, the Hellenic Republic, is a nation of about 11 million – maybe 2 percent of the population of the European Union (about 500 million). The country has a significance out of proportion to its size as an icon of many of the ideas of western civilization – such as “democracy” and “philosophy.”

But, if we can abstract momentarily from the human suffering involved, Greek developments have everything to do with practical and technical issues in forecasting and economic policy. Indeed, with real failures of applied macroeconomic forecasting since 2010.

Fiscal Multipliers

What is the percent reduction in GDP growth that is likely to be associated with reductions in government spending? This type of question is handled in the macroeconomic forecasting workshops – at the International Monetary Fund (IMF), the ECB, German, French, Italian, and US government agencies, and so forth – through basically simple operations with fiscal multipliers.

The Greek government had been spending beyond its means for years, both before joining the EU in 2001 and after systematically masking these facts with misleading and, in some cases, patently false accounting.

Then, to quote the New York Times,

Greece became the epicenter of Europe’s debt crisis after Wall Street imploded in 2008. With global financial markets still reeling, Greece announced in October 2009 that it had been understating its deficit figures for years, raising alarms about the soundness of Greek finances. Suddenly, Greece was shut out from borrowing in the financial markets. By the spring of 2010, it was veering toward bankruptcy, which threatened to set off a new financial crisis. To avert calamity, the so-called troika — the International Monetary Fund, the European Central Bank and the European Commission — issued the first of two international bailouts for Greece, which would eventually total more than 240 billion euros, or about $264 billion at today’s exchange rates. The bailouts came with conditions. Lenders imposed harsh austerity terms, requiring deep budget cuts and steep tax increases. They also required Greece to overhaul its economy by streamlining the government, ending tax evasion and making Greece an easier place to do business.

The money was supposed to buy Greece time to stabilize its finances and quell market fears that the euro union itself could break up. While it has helped, Greece’s economic problems haven’t gone away. The economy has shrunk by a quarter in five years, and unemployment is above 25 percent.

In short, the austerity policies imposed by the “Troika” – the ECB, the European Commission, and the IMF – proved counter-productive. Designed to release funds to repay creditors by reducing government deficits, insistence on sharp reductions in Greek spending while the nation was still reeling from the global financial crisis led to even sharper reductions in Greek production and output – and thus tax revenues declined faster than spending.

Or, to put this in more technical language, policy analysts made assumptions about fiscal multipliers which simply were not borne out by actual developments. They assumed fiscal multipliers on the order of 0.5, when, in fact, recent meta-studies suggest they can be significantly greater than 1 in magnitude and that multipliers for direct transfer payments under strapped economic conditions grow by multiples of their value under normal circumstances.

Problems with fiscal multipliers used in estimating policy impacts were recognized some time ago – see for example Growth Forecast Errors and Fiscal Multipliers the IMF Working Paper authored by Oliver Blanchard in 2013.

Also, Simon Wren-Lewis, from Oxford University, highlights the IMF recognition that they “got the multipliers wrong” in his post How a Greek drama became a global tragedy from mid-2013.

However, at the negotiating table with the Greeks, and especially with their new, Left-wing government, the niceties of amending assumptions about fiscal multipliers were lost on the hard bargaining that has taken place.

Again, Wren-Lewis is interesting in his Greece and the political capture of the IMF. The creditors were allowed to demand more and sterner austerity measures, as well as fulfillment of past demands which now seem institutionally impossible – prior to any debt restructuring.

IMF Calls for 50 Billion in New Loans and Debt Restructuring for Greece

Just before to the Greek vote, on July 2, the IMF released a “Preliminary Draft Debt Sustainability Analysis.”

This clearly states Greek debt is not sustainable, given the institutional realities in Greece and deterioration of Greek economic and financial indicators, and calls for immediate debt restructuring, as well as additional funds ($50 billion) to shore up the Greek banks and economy.

There is a report that Europeans tried to block IMF debt report on Greece, viewing it as too supportive of the Greek government position and a “NO” vote on today’s referendum.

The IMF document considers that,

If grace periods and maturities on existing European loans are doubled and if new financing is provided for the next few years on similar concessional terms, debt can be deemed to be sustainable with high probability. Underpinning this assessment is the following: (i) more plausible assumptions—given persistent underperformance—than in the past reviews for the primary surplus targets, growth rates, privatization proceeds, and interest rates, all of which reduce the downside risk embedded in previous analyses. This still leads to gross financing needs under the baseline not only below 15 percent of GDP but at the same levels as at the last review; and (ii) delivery of debt relief that to date have been promises but are assumed to materialize in this analysis.

Some may view this analysis from a presumed moral high ground – fixating on the fact that Greeks proved tricky about garnering debt and profligate in spending in the previous decade.

But, unless decision-makers are intent upon simply punishing Greece, at risk of triggering financial crisis, it seems in the best interests of everyone to consider how best to proceed from this point forward.

And the idea of cutting spending and increasing taxes during an economic downturn and its continuing aftermath should be put to rest as another crackpot idea whose time has passed.