Category Archives: extreme weather forecasting

Links – early July 2014

While I dig deeper on the current business outlook and one or two other issues, here are some links for this pre-Fourth of July week.

Predictive Analytics

A bunch of papers about the widsom of smaller, smarter crowds I think the most interesting of these (which I can readily access) is Identifying Expertise to Extract the Wisdom of Crowds which develops a way by eliminating poorly performing individuals from the crowd to improve the group response.

Application of Predictive Analytics in Customer Relationship Management: A Literature Review and Classification From the Proceedings of the Southern Association for Information Systems Conference, Macon, GA, USA March 21st–22nd, 2014. Some minor problems with writing English in the article, but solid contribution.

US and Global Economy

Nouriel Roubini: There’s ‘schizophrenia’ between what stock and bond markets tell you Stocks tell you one thing, but bond yields suggest another. Currently, Roubini is guardedly optimistic – Eurozone breakup risks are receding, US fiscal policy is in better order, and Japan’s aggressively expansionist fiscal policy keeps deflation at bay. On the other hand, there’s the chance of a hard landing in China, trouble in emerging markets, geopolitical risks (Ukraine), and growing nationalist tendencies in Asia (India). Great list, and worthwhile following the links.

The four stages of Chinese growth Michael Pettis was ahead of the game on debt and China in recent years and is now calling for reduction in Chinese growth to around 3-4 percent annually.

Because of rapidly approaching debt constraints China cannot continue what I characterize as the set of “investment overshooting” economic polices for much longer (my instinct suggests perhaps three or four years at most). Under these policies, any growth above some level – and I would argue that GDP growth of anything above 3-4% implies almost automatically that “investment overshooting” policies are still driving growth, at least to some extent – requires an unsustainable increase in debt. Of course the longer this kind of growth continues, the greater the risk that China reaches debt capacity constraints, in which case the country faces a chaotic economic adjustment.

Politics

Is This the Worst Congress Ever? Barry Ritholtz decries the failure of Congress to lower interest rates on student loans, observing –

As of July 1, interest on new student loans rises to 4.66 percent from 3.86 percent last year, with future rates potentially increasing even more. This comes as interest rates on mortgages and other consumer credit hovered near record lows. For a comparison, the rate on the 10-year Treasury is 2.6 percent. Congress could have imposed lower limits on student-loan rates, but chose not to.

This is but one example out of thousands of an inability to perform the basic duties, which includes helping to educate the next generation of leaders and productive citizens. It goes far beyond partisanship; it is a matter of lack of will, intelligence and ability.

Hear, hear.

Climate Change

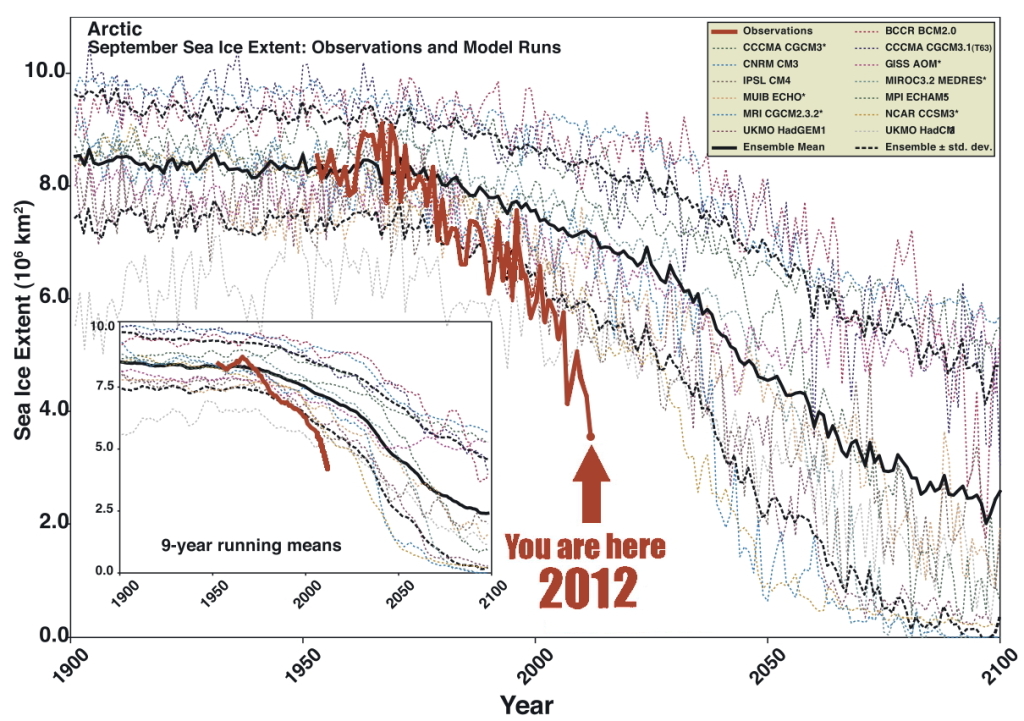
Climate news: Arctic seafloor methane release is double previous estimates, and why that matters This is a ticking time bomb. Article has a great graphic (shown below) which contrasts the projections of loss of Artic sea ice with what actually is happening – underlining that the facts on the ground are outrunning the computer models. Methane has more than an order of magnitude more global warming impact that carbon dioxide, per equivalent mass.

ArcticSeaIce

Dahr Jamail | Former NASA Chief Scientist: “We’re Effectively Taking a Sledgehammer to the Climate System”

I think the sea level rise is the most concerning. Not because it’s the biggest threat, although it is an enormous threat, but because it is the most irrefutable outcome of the ice loss. We can debate about what the loss of sea ice would mean for ocean circulation. We can debate what a warming Arctic means for global and regional climate. But there’s no question what an added meter or two of sea level rise coming from the Greenland ice sheet would mean for coastal regions. It’s very straightforward.

Machine Learning

EG

Computer simulating 13-year-old boy becomes first to pass Turing test A milestone – “Eugene Goostman” fooled more than a third of the Royal Society testers into thinking they were texting with a human being, during a series of five minute keyboard conversations.

The Milky Way Project: Leveraging Citizen Science and Machine Learning to Detect Interstellar Bubbles Combines Big Data and crowdsourcing.

Predicting the Hurricane Season

I’ve been focusing recently on climate change and extreme weather events, such as hurricanes and tornados. This focus is interesting in its own right, offering significant challenges to data analysis and predictive analytics, and I also see strong parallels to economic forecasting.

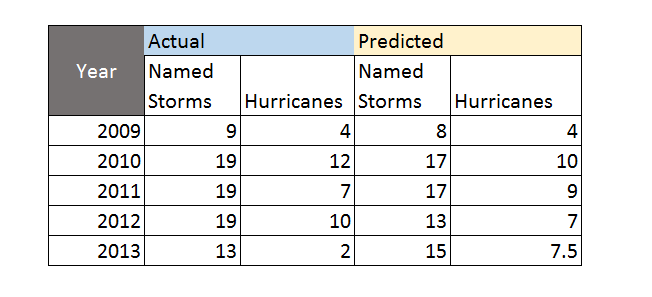
The Florida State University Center for Ocean-Atmospheric Prediction Studies (COAPS) garnered good press 2009-2012, for its accurate calls on the number of hurricanes and named tropical storms in the North Atlantic. Last year was another story, however, and it’s interesting to explore why 2013 was so unusual – there being only two (2) hurricanes and no major hurricanes over the whole season.

Here’s the track record for COAPS, since it launched its new service.

Hurricaneforecastaccuracy

The forecast for 2013 was a major embarrassment, inasmuch as the Press Release at the beginning of June 2013 predicted an “above-average season.”

Tim LaRow, associate research scientist at COAPS, and his colleagues released their fifth annual Atlantic hurricane season forecast today. Hurricane season begins June 1 and runs through Nov. 30.

This year’s forecast calls for a 70 percent probability of 12 to 17 named storms with five to 10 of the storms developing into hurricanes. The mean forecast is 15 named storms, eight of them hurricanes, and an average accumulated cyclone energy (a measure of the strength and duration of storms accumulated during the season) of 135.

“The forecast mean numbers are identical to the observed 1995 to 2010 average named storms and hurricanes and reflect the ongoing period of heightened tropical activity in the North Atlantic,” LaRow said.

The COAPS forecast is slightly less than the official National Oceanic and Atmospheric Administration (NOAA) forecast that predicts a 70 percent probability of 13 to 20 named storms with seven to 11 of those developing into hurricanes this season…

What Happened?

Hurricane forecaster Gary Bell is quoted as saying,

“A combination of conditions acted to offset several climate patterns that historically have produced active hurricane seasons,” said Gerry Bell, Ph.D., lead seasonal hurricane forecaster at NOAA’s Climate Prediction Center, a division of the National Weather Service. “As a result, we did not see the large numbers of hurricanes that typically accompany these climate patterns.”

More informatively,

Forecasters say that three main features loom large for the inactivity: large areas of sinking air, frequent plumes of dry, dusty air coming off the Sahara Desert, and above-average wind shear. None of those features were part of their initial calculations in making seasonal projections. Researchers are now looking into whether they can be predicted in advance like other variables, such as El Niño and La Niña events.

I think it’s interesting NOAA stuck to its “above-normal season” forecast as late as August 2013, narrowing the numbers only a little. At the same time, neutral conditions with respect to la Nina and el Nino in the Pacific were acknowledged as influencing the forecasts. The upshot – the 2013 hurricane season in the North Atlantic was the 7th quietest in 70 years.

Risk Behaviors and Extreme Events

Apparently, it’s been more than 8 years since a category 3 hurricane hit the mainland of the US. This is chilling, inasmuch as Sandy, which caused near-record damage on the East Coast, was only a category 1 when it made landfall in New Jersey in 2012.

Many studies highlight a “ratchet pattern” in risk behaviors following extreme weather, such as a flood or hurricane. Initially, after the devastation, people engage in lots of protective, pre-emptive behavior. Typically, flood insurance coverage shoots up, only to gradually fall off, when further flooding has not been seen for a decade or more.

Similarly, after a volcanic eruption, in Indonesia, for example, and destruction of fields and villages by lava flows or ash – people take some time before they re-claim those areas. After long enough, these events can give rise to rich soils, supporting high crop yields. So since the volcano has not erupted for, say, decades or a century, people move back and build even more intensively than before.

This suggests parallels with economic crisis and its impacts, and measures taken to make sure “it never happens again.”

I also see parallels between weather and economic forecasting.

Maybe there is a chaotic element in economic dynamics, just as there almost assuredly is in weather phenomena.

Certainly, the curse of dimension in forecasting models translates well from weather to economic forecasting. Indeed, a major review of macroeconomic forecasting, especially of its ability to predict recessions, concludes that economic models are always “fighting the last war,” in the sense that new factors seem to emerge and take control during every major economic crises. Things do not repeat themselves exactly. So, if the “true” recession forecasting model has legitimately 100 drivers or explanatory variables, it takes a long historic record to sort out the separate influences of these – and the underlying technological basis of the economy is changing all the time.