Category Archives: machine learning

The King Has No Clothes or Why There Is High Frequency Trading (HFT)

I often present at confabs where there are engineers with management or executive portfolios. You start the slides, but, beforehand, prepare for the tough question. Make sure the numbers in the tables add up and that round-off errors or simple typos do not creep in to mess things up.

To carry this on a bit, I recall a Hewlett Packard VP whose preoccupation during meetings was to fiddle with their calculator – which dates the story a little. In any case, the only thing that really interested them was to point out mistakes in the arithmetic. The idea is apparently that if you cannot do addition, why should anyone believe your more complex claims?

I’m bending this around to the theory of efficient markets and rational expectations, by the way.

And I’m playing the role of the engineer.

Rational Expectations

The theory of rational expectations dates at least to the work of Muth in the 1960’s, and is coupled with “efficient markets.”

Lim and Brooks explain market efficiency in – The Evolution of Stock Market Efficiency Over Time: A Survey of the Empirical Literature

The term ‘market efficiency’, formalized in the seminal review of Fama (1970), is generally referred to as the informational efficiency of financial markets which emphasizes the role of information in setting prices.. More specifically, the efficient markets hypothesis (EMH) defines an efficient market as one in which new information is quickly and correctly reflected in its current security price… the weak-form version….asserts that security prices fully reflect all information contained in the past price history of the market.

Lim and Brooks focus, among other things, on statistical tests for random walks in financial time series, noting this type of research is giving way to approaches highlighting adaptive expectations.

Proof US Stock Markets Are Not Efficient (or Maybe That HFT Saves the Concept)

I like to read mathematically grounded research, so I have looked a lot of the papers purporting to show that the hypothesis that stock prices are random walks cannot be rejected statistically.

But really there is a simple constructive proof that this literature is almost certainly wrong.

STEP 1: Grab the data. Download daily adjusted closing prices for the S&P 500 from some free site (e,g, Yahoo Finance). I did this again recently, collecting data back to 1990. Adjusted closing prices, of course, are based on closing prices for the trading day, adjusted for dividends and stock splits. Oh yeah, you may have to resort the data from oldest to newest, since a lot of sites present the newest data on top, originally.

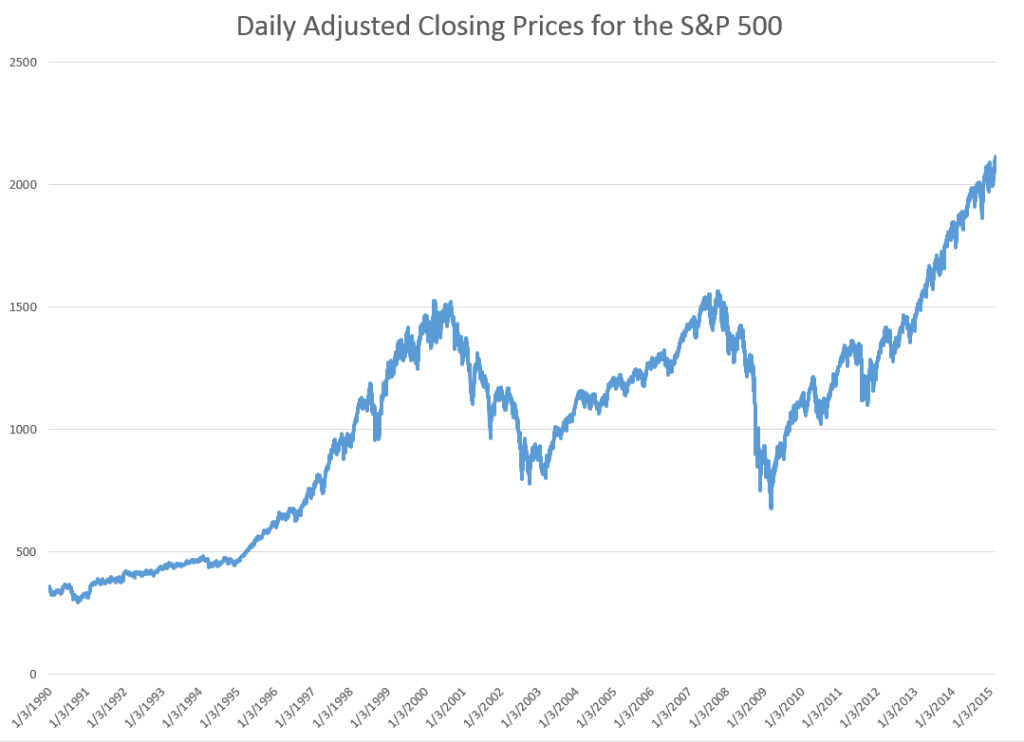
Here’s a graph of the data, which should be very familiar by now.

adjCLPS&P

STEP 2: Create the relevant data structure. In the same spreadsheet, compute the trading-day-over-treading day growth in the adjusted closing price (ACP). Then, side-by-side with this growth rate of the ACP, create another series which, except for the first value, maps the growth in ACP for the previous trading day onto the growth of the ACP for any particular day. That gives you two columns of new data.

STEP 3: Run adaptive regressions. Most spreadsheet programs include an ordinary least squares (OLS) regression routine. Certainly, Excel does. In any case, you want to setup up a regression to predict the growth in the ACP, based on one trading lags in the growth of the ACP.

I did this, initially, to predict the growth in ACP for January 3, 2000, based on data extending back to January 3, 1990 – a total of 2528 trading days. Then, I estimated regressions going down for later dates with the same size time window of 2528 trading days.

The resulting “predictions” for the growth in ACP are out-of-sample, in the sense that each prediction stands outside the sample of historic data used to develop the regression parameters used to forecast it.

It needs to be said that these predictions for the growth of the adjusted closing price (ACP) are marginal, correctly predicting the sign of the ACP only about 53 percent of the time.

An interesting question, though, is whether these just barely predictive forecasts can be deployed in a successful trading model. Would a trading algorithm based on this autoregressive relationship beat the proverbial “buy-and-hold?”

So, for example, suppose we imagine that we can trade at closing each trading day, close enough to the actual closing prices.

Then, you get something like this, if you invest $100,000 at the beginning of 2000, and trade through last week. If the predicted growth in the ACP is positive, you buy at the previous day’s close. If not, you sell at the previous day’s close. For the Buy-and-Hold portfolio, you just invest the $100,000 January 3, 2000, and travel to Tahiti for 15 years or so.

BandHversusAR

So, as should be no surprise, the Buy-and-Hold strategy results in replicating the S&P 500 Index on a $100,000 base.

The trading strategy based on the simple first order autoregressive model, on the other hand, achieves more than twice these cumulative earnings.

Now I suppose you could say that all this was an accident, or that it was purely a matter of chance, distributed over more than 3,810 trading days. But I doubt it. After all, this trading interval 2000-2015 includes the worst economic crisis since before World War II.

Or you might claim that the profits from the simple AR trading strategy would be eaten up by transactions fees and taxes. On this point, there were 1,774 trades, for an average of $163 per trade. So, worst case, if trading costs $10 a transaction, and there is a tax rate of 40 percent, that leaves $156K over these 14-15 years in terms of take-away profit, or about $10,000 a year.

Where This May Go Wrong

This does sound like a paen to stock market investing – even “day-trading.”

What could go wrong?

Well, I assume here, of course, that exchange traded funds (ETF’s) tracking the S&P 500 can be bought and sold with the same tactics, as outlined here.

Beyond that, I don’t have access to the data currently (although I will soon), but I suspect high frequency trading (HFT) may stand in the way of realizing this marvelous investing strategy.

So remember you have to trade some small instant before market closing to implement this trading strategy. But that means you get into the turf of the high frequency traders. And, as previous posts here observe, all kinds of unusual things can happen in a blink of an eye, faster than any human response time.

So – a conjecture. I think that the choicest situations from the standpoint of this more or less macro interday perspective, may be precisely the places where you see huge spikes in the volume of HFT. This is a proposition that can be tested.

I also think something like this has to be appealed to in order to save the efficient markets hypothesis, or rational expectations. But in this case, it is not the rational expectations of human subjects, but the presumed rationality of algorithms and robots, as it were, which may be driving the market, when push comes to shove.

Top picture from CommSmart Global.

Video Friday on Steroids

Here is a list of the URL’s for all the YouTube and other videos shown on this blog from January 2014 through May of this year. I encourage you to shop this list, clicking on the links. There’s a lot of good stuff, including several  instructional videos on machine learning and other technical topics, a series on robotics, and several videos on climate and climate change.

January 2014

The Polar Vortex Explained in Two Minutes

https://www.youtube.com/watch?v=5eDTzV6a9F4

NASA – Six Decades of a Warming Earth

https://www.youtube.com/watch?v=gaJJtS_WDmI

“CHASING ICE” captures largest video calving of glacier

https://www.youtube.com/watch?v=hC3VTgIPoGU

Machine Learning and Econometrics

https://www.youtube.com/watch?v=EraG-2p9VuE

Can Crime Prediction Software Stop Criminals?

https://www.youtube.com/watch?v=s1-pbJKA3H8

Analytics 2013 – Day 1

https://www.youtube.com/watch?v=LsyOLBroVx4

The birth of a salesman

https://www.youtube.com/watch?v=pWM1dR_V7uw

Economies Improve

https://www.youtube.com/watch?v=5_DeCMIig_M

Kaggle – Energy Applications for Machine Learning

https://www.youtube.com/watch?v=mZZFXTUz-nI

2014 Outlook with Jan Hatzius

https://www.youtube.com/watch?v=Ggv0oC8L3Tk

Nassim Taleb Lectures at the NSF

https://www.youtube.com/watch?v=omsYJBMoIJU

Vernon Smith – Experimental Markets

https://www.youtube.com/watch?v=Uncl-wRfoK8


Forecast Pro – Quick Tour

https://www.youtube.com/watch?v=s8jMp5qS8v4

February 2014

Stephen Wolfram’s Introduction to the Wolfram Language

https://www.youtube.com/watch?v=_P9HqHVPeik

Tornados

https://www.youtube.com/watch?v=TEGhgsiNFJ4

Econometrics – Quantile Regression

https://www.youtube.com/watch?v=P9lMmEkXuBw

Quantile Regression Example

https://www.youtube.com/watch?v=qrriFC_WGj8

Brooklyn Grange – A New York Growing Season

http://vimeo.com/86266334

Getting in Shape for the Sport of Data Science

https://www.youtube.com/watch?v=kwt6XEh7U3g

Machine Learning – Decision Trees

https://www.youtube.com/watch?v=-dCtJjlEEgM

Machine Learning – Random Forests

https://www.youtube.com/watch?v=3kYujfDgmNk

Machine Learning – Random Forecasts Applications

https://www.youtube.com/watch?v=zFGPjRPwyFw

Malcolm Gladwell on the 10,000 Hour Rule

https://www.youtube.com/watch?v=XS5EsTc_-2Q

Sornette Talk

https://www.youtube.com/watch?v=Eomb_vbgvpk

Head of India Central Bank Interview

https://www.youtube.com/watch?v=BrVzema7pWE

March 2014

David Stockman

https://www.youtube.com/watch?v=DI718wFmReo

Partial Least Squares Regression

https://www.youtube.com/watch?v=WKEGhyFx0Dg

April 2014

Thomas Piketty on Economic Inequality

https://www.youtube.com/watch?v=qp3AaI5bWPQ

Bonobo builds a fire and tastes marshmellows

https://www.youtube.com/watch?v=GQcN7lHSD5Y

Future Technology

https://www.youtube.com/watch?v=JbQeABIoO6A

May 2014

Ray Kurzweil: The Coming Singularity

https://www.youtube.com/watch?v=1uIzS1uCOcE

Paul Root Wolpe: Kurzweil Critique

https://www.youtube.com/watch?v=qRgMTjTMovc

The Future of Robotics and Artificial Intelligence

https://www.youtube.com/watch?v=AY4ajbu_G3k

Car Factory – KIA Sportage Assembly Line

https://www.youtube.com/watch?v=sjAZGUcjrP8

10 Most Popular Applications for Robots

https://www.youtube.com/watch?v=fH4VwTgfyrQ

Predator Drones

https://www.youtube.com/watch?v=nMh8Cjnzen8

The Future of Robotic Warfare

https://www.youtube.com/watch?v=_atffUtxXtk

Bionic Kangaroo

https://www.youtube.com/watch?v=HUxQM0O7LpQ

Ping Pong Playing Robot

https://www.youtube.com/watch?v=tIIJME8-au8

Baxter, the Industrial Robot

https://www.youtube.com/watch?v=ukehzvP9lqg

Bootstrapping

https://www.youtube.com/watch?v=1OC9ul-1PVg

Video Friday – Andrew Ng’s Machine Learning Course

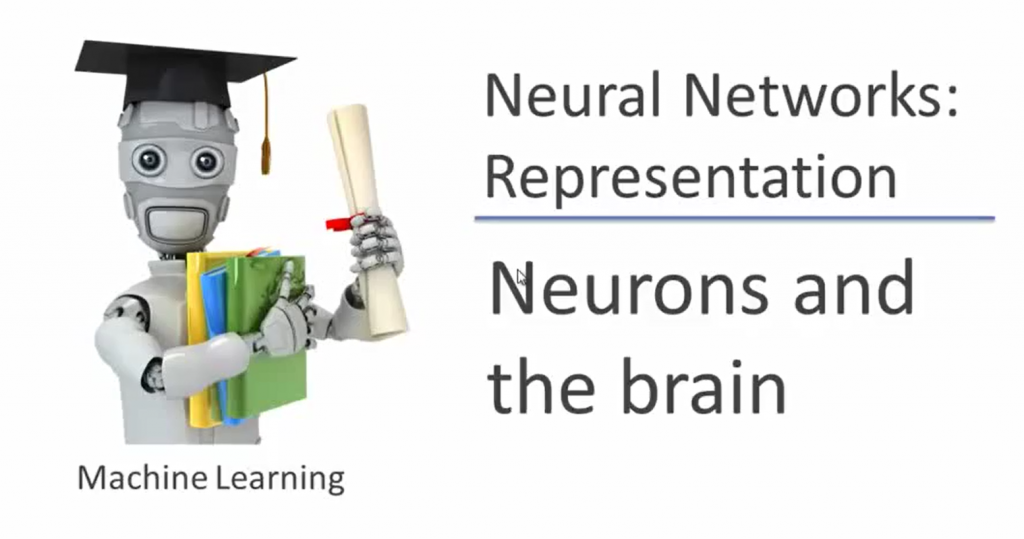
Well, I signed up for Andrew Ng’s Machine Learning Course at Stanford. It began a few weeks ago, and is a next generation to lectures by Ng circulating on YouTube. I’m going to basically audit the course, since I started a little late, but I plan to take several of the exams and work up a few of the projects. This course provides a broad introduction to machine learning, datamining, and statistical pattern recognition. Topics include: (i) Supervised learning (parametric/non-parametric algorithms, support vector machines, kernels, neural networks). (ii) Unsupervised learning (clustering, dimensionality reduction, recommender systems, deep learning). (iii) Best practices in machine learning (bias/variance theory; innovation process in machine learning and AI). The course will also draw from numerous case studies and applications, so that you’ll also learn how to apply learning algorithms to building smart robots (perception, control), text understanding (web search, anti-spam), computer vision, medical informatics, audio, database mining, and other areas. I like the change in format. The YouTube videos circulating on the web are lengthly, and involve Ng doing derivations on white boards. This is a more informal, expository format. Here is a link to a great short introduction to neural networks. Ngrobot Click on the link above this picture, since the picture itself does not trigger a YouTube. Ng’s introduction on this topic is fairly short, so here is the follow-on lecture, which starts the task of representing or modeling neural networks. I really like the way Ng approaches this is grounded in biology. I believe there is still time to sign up. Comment on Neural Networks and Machine Learning I can’t do much better than point to Professor Ng’s definition of machine learning – Machine learning is the science of getting computers to act without being explicitly programmed. In the past decade, machine learning has given us self-driving cars, practical speech recognition, effective web search, and a vastly improved understanding of the human genome. Machine learning is so pervasive today that you probably use it dozens of times a day without knowing it. Many researchers also think it is the best way to make progress towards human-level AI. In this class, you will learn about the most effective machine learning techniques, and gain practice implementing them and getting them to work for yourself. More importantly, you’ll learn about not only the theoretical underpinnings of learning, but also gain the practical know-how needed to quickly and powerfully apply these techniques to new problems. Finally, you’ll learn about some of Silicon Valley’s best practices in innovation as it pertains to machine learning and AI. And now maybe this is the future – the robot rock band.

Links – early July 2014

While I dig deeper on the current business outlook and one or two other issues, here are some links for this pre-Fourth of July week.

Predictive Analytics

A bunch of papers about the widsom of smaller, smarter crowds I think the most interesting of these (which I can readily access) is Identifying Expertise to Extract the Wisdom of Crowds which develops a way by eliminating poorly performing individuals from the crowd to improve the group response.

Application of Predictive Analytics in Customer Relationship Management: A Literature Review and Classification From the Proceedings of the Southern Association for Information Systems Conference, Macon, GA, USA March 21st–22nd, 2014. Some minor problems with writing English in the article, but solid contribution.

US and Global Economy

Nouriel Roubini: There’s ‘schizophrenia’ between what stock and bond markets tell you Stocks tell you one thing, but bond yields suggest another. Currently, Roubini is guardedly optimistic – Eurozone breakup risks are receding, US fiscal policy is in better order, and Japan’s aggressively expansionist fiscal policy keeps deflation at bay. On the other hand, there’s the chance of a hard landing in China, trouble in emerging markets, geopolitical risks (Ukraine), and growing nationalist tendencies in Asia (India). Great list, and worthwhile following the links.

The four stages of Chinese growth Michael Pettis was ahead of the game on debt and China in recent years and is now calling for reduction in Chinese growth to around 3-4 percent annually.

Because of rapidly approaching debt constraints China cannot continue what I characterize as the set of “investment overshooting” economic polices for much longer (my instinct suggests perhaps three or four years at most). Under these policies, any growth above some level – and I would argue that GDP growth of anything above 3-4% implies almost automatically that “investment overshooting” policies are still driving growth, at least to some extent – requires an unsustainable increase in debt. Of course the longer this kind of growth continues, the greater the risk that China reaches debt capacity constraints, in which case the country faces a chaotic economic adjustment.

Politics

Is This the Worst Congress Ever? Barry Ritholtz decries the failure of Congress to lower interest rates on student loans, observing –

As of July 1, interest on new student loans rises to 4.66 percent from 3.86 percent last year, with future rates potentially increasing even more. This comes as interest rates on mortgages and other consumer credit hovered near record lows. For a comparison, the rate on the 10-year Treasury is 2.6 percent. Congress could have imposed lower limits on student-loan rates, but chose not to.

This is but one example out of thousands of an inability to perform the basic duties, which includes helping to educate the next generation of leaders and productive citizens. It goes far beyond partisanship; it is a matter of lack of will, intelligence and ability.

Hear, hear.

Climate Change

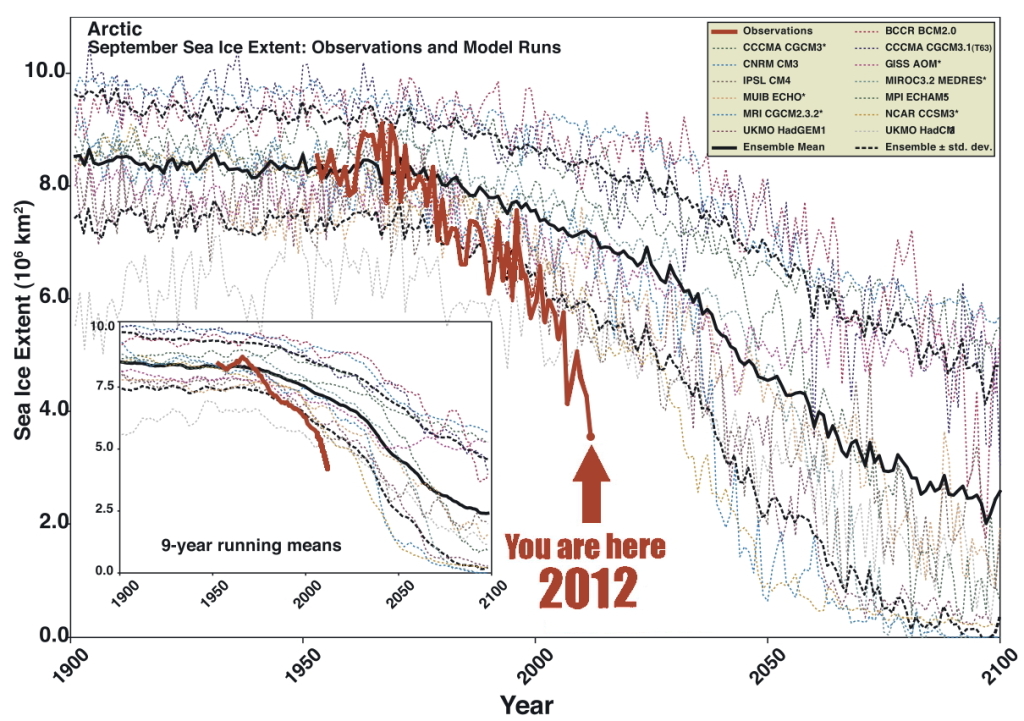
Climate news: Arctic seafloor methane release is double previous estimates, and why that matters This is a ticking time bomb. Article has a great graphic (shown below) which contrasts the projections of loss of Artic sea ice with what actually is happening – underlining that the facts on the ground are outrunning the computer models. Methane has more than an order of magnitude more global warming impact that carbon dioxide, per equivalent mass.

ArcticSeaIce

Dahr Jamail | Former NASA Chief Scientist: “We’re Effectively Taking a Sledgehammer to the Climate System”

I think the sea level rise is the most concerning. Not because it’s the biggest threat, although it is an enormous threat, but because it is the most irrefutable outcome of the ice loss. We can debate about what the loss of sea ice would mean for ocean circulation. We can debate what a warming Arctic means for global and regional climate. But there’s no question what an added meter or two of sea level rise coming from the Greenland ice sheet would mean for coastal regions. It’s very straightforward.

Machine Learning

EG

Computer simulating 13-year-old boy becomes first to pass Turing test A milestone – “Eugene Goostman” fooled more than a third of the Royal Society testers into thinking they were texting with a human being, during a series of five minute keyboard conversations.

The Milky Way Project: Leveraging Citizen Science and Machine Learning to Detect Interstellar Bubbles Combines Big Data and crowdsourcing.

Robotics – the Present, the Future

A picture is worth one thousand words. Here are several videos, mostly from Youtube, discussing robotics and artificial intelligence (AI) and showing present and future capabilities. The videos fall in five areas – concepts with Andrew Ng, Industrial Robots and their primary uses, Military Robotics, including a presentation on predator drones, and some state-of-the-art innovations in robotics which mimic the human approach to a degree.

Andrew Ng  – The Future of Robotics and Artificial Intelligence

Car Factory – Kia Sportage factory production line

ABB Robotics – 10 most popular applications for robots


Predator Drones


Innovators: The Future of Robotic Warfare


Bionic kangaroo


The Duel: Timo Boll vs. KUKA Robot


Machine Learning and Next Week

Here is a nice list of machine learning algorithms. Remember, too, that they come in two or three flavors – supervised, unsupervised, semi-supervised, and reinforcement learning.

MachineLearning

An objective of mine is to cover each of these techniques with an example or two, with special reference to their relevance to forecasting.

I got this list, incidentally, from an interesting Australian blog Machine Learning Mastery.

The Coming Week

Aligned with this marvelous list, I’ve decided to focus on robotics for a few blog posts coming up.

This is definitely exploratory, but recently I heard a presentation by an economist from the National Association of Manufacturers (NAM) on manufacturing productivity, among other topics. Apparently, robotics is definitely happening on the shop floor – especially in the automobile industry, but also in semiconductors and electronics assembly.

And, as mankind pushes the envelope, drilling for oil in deeper and deeper areas offshore and handling more and more radioactive and toxic material, the need for significant robotic assistance is definitely growing.

I’m looking for indices and how to construct them – how to guage the line between merely automatic and what we might more properly call robotic.

The Tibshirani’s – Statistics and Machine Learning Superstars

As regular readers of this blog know, I’ve migrated to a weekly (or potentially longer) topic focus, and this week’s topic is variable selection.

And the next planned post in the series will compare and contrast ridge regression and the LASSO (least absolute shrinkage and selection operator). There also are some new results for the LASSO. But all this takes time and is always better when actual computations can be accomplished to demonstrate points.

But in researching this, I’ve come to a deeper appreciation of the Tibshiranis.

Robert Tibshirani was an early exponent of the LASSO and has probably, as much as anyone, helped integrate the LASSO into standard statistical procedures.

Here’s his picture from Wikipedia.

RobertTib2

You might ask why put his picuture up, and my answer is that Professor Robert Tibshirani (Stanford) has a son Ryan Tibshirani, whose picture is just below.

Ryan Tibsharani has a great Data Mining course online from Carnegie Mellon, where he is an Assistant Professor.

RyanTib

Professor Ryan Tibshirani’s Spring 2013 a Data Mining course can be found at http://www.stat.cmu.edu/~ryantibs/datamining/

Reviewing Ryan Tibsharani’s slides is very helpful in getting insight into topics like cross validation, ridge regression and the LASSO.

And let us not forget Professor Ryan Tibshirani is author of essential reading about how to pick your target in darts, based on your skill level (hint – don’t go for the triple-20 unless you are good).

Free Books on Machine Learning and Statistics

Robert Tibshirani et al’s text – Elements of Statistical Learning is now in the 10th version and is available online free here.

But the simpler An Introduction to Statistical Leaning is also available for an online download of a PDF file here. This is the corrected 4th printing. The book, which I have been reading today, is really dynamite – an outstanding example of scientific exposition and explanation.

These guys and their collaborators are truly gifted teachers. They create windows into new mathematical and statistical worlds, as it were.

Links May 2014

If there is a theme for this current Links page, it’s that trends spotted a while ago are maturing, becoming clearer.

So with the perennial topic of Big Data and predictive analytics, there is an excellent discussion in Algorithms Beat Intuition – the Evidence is Everywhere. There is no question – the machines are going to take over; it’s only a matter of time.

And, as far as freaky, far-out science, how about Scientists Create First Living Organism With ‘Artificial’ DNA.

Then there are China trends. Workers in China are better paid, have higher skills, and they are starting to use the strike. Striking Chinese Workers Are Headache for Nike, IBM, Secret Weapon for Beijing . This is a long way from the poor peasant women from rural areas living in dormitories, doing anything for five or ten dollars a day.

The Chinese dominance in the economic sphere continues, too, as noted by the Economist. Crowning the dragon – China will become the world’s largest economy by the end of the year

China

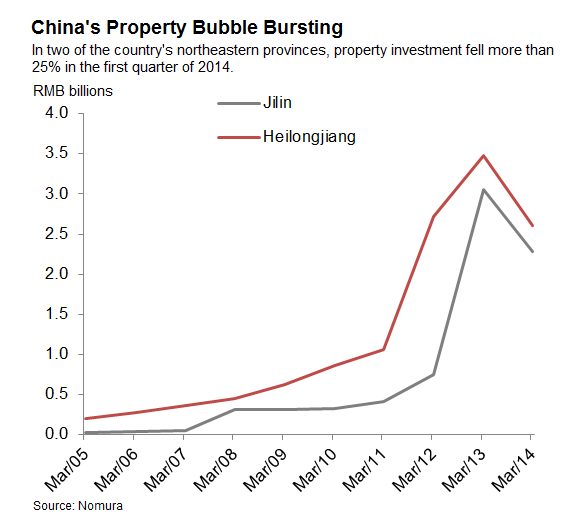
But there is the issue of the Chinese property bubble. China’s Property Bubble Has Already Popped, Report Says

Chinaproperty

Then, there are issues and trends of high importance surrounding the US Federal Reserve Bank. And I can think of nothing more important and noteworthy, than Alan Blinder’s recent comments.

Former Fed Leader Alan Blinder Sees Market-rattling Infighting at Central Bank

“The Fed may get more raucous about what to do next as tapering draws to a close,” Alan Blinder, a banking industry consultant and economics professor at Princeton University said in a speech to the Investment Management Consultants Association in Boston.

The cacophony is likely to “rattle the markets” beginning in late summer as traders debate how precipitously the Fed will turn from reducing its purchases of U.S. government debt and mortgage securities to actively selling it.

The Open Market Committee will announce its strategy in October or December, he said, but traders will begin focusing earlier on what will happen with rates as some members of the rate-setting panel begin openly contradicting Fed Chair Janet Yellen, he said.

Then, there are some other assorted links with good infographics, charts, or salient discussion.

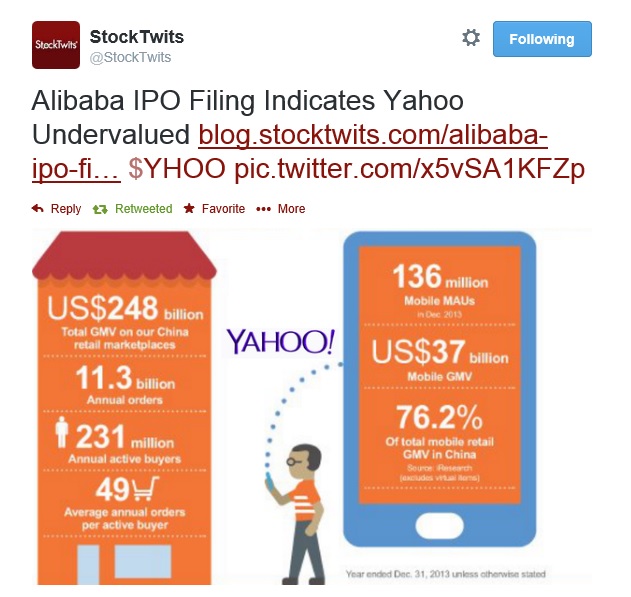
Alibaba IPO Filing Indicates Yahoo Undervalued Heck of an interesting issue.

Alibaba

Twitter Is Here To Stay

Three Charts on Secular Stagnation Krugman toying with secular stagnation hypothesis.

Rethinking Property in the Digital Era Personal data should be viewed as property

Larry Summers Goes to Sleep After Introducing Piketty at Harvard Great pic. But I have to have sympathy for Summers, having attended my share of sleep-inducing presentations on important economics issues.

lawrencesummers

Turkey’s Institutions Problem from the Stockholm School of Economics, nice infographics, visual aids. Should go along with your note cards on an important emerging economy.

Post-Crash economics clashes with ‘econ tribe’ – economics students in England are proposing reform of the university economics course of study, but, as this link points out, this is an uphill battle and has been suggested before.

The Life of a Bond – everybody needs to know what is in this infographic.

Very Cool Video of Ocean Currents From NASA

perpetualocean_cover_1024x676

Loess Seasonal Decomposition as a Forecasting Tool

I’ve applied something called loess decomposition to the London PM Fix gold series previously discussed in this blog.

This suggests insights missing from an application of Forecast Pro – a sort of standard in the automatic forecasting field.

Loess decomposition separates a time series into components – trend, seasonals, and residuals or remainder – based on locally weighted regression smoothing of the data.

I always wondered whether, in fact, there was a seasonal component to the monthly London PM fix time series.

Not every monthly or quarterly time series has credible seasonal components, of course.

The proof would seem to be in the pudding. If a program derives seasonal components for a time series, do those seasonal components improve forecasts? That seems to be the critical issue.

STL Decomposition

STL decomposition – seasonal trend decomposition based on loess – was proposed by Cleveland et al in an interesting-sounding publication called “The Journal of Official Statistics.” I found the citation working through the procedure for bagging exponential smoothing mentioned in the previous post.

Amazingly, there is an online resource which calculates this loess decomposition for data you input, based on a listed R routine. The citation is Wessa P., (2013), Decomposition by Loess (v1.0.2) in Free Statistics Software (v1.1.23-r7), Office for Research Development and Education, URL http://www.wessa.net/rwasp_decomposeloess.wasp/

Comparison of STL Decomposition and Forecast Pro Gold Price Forecasts

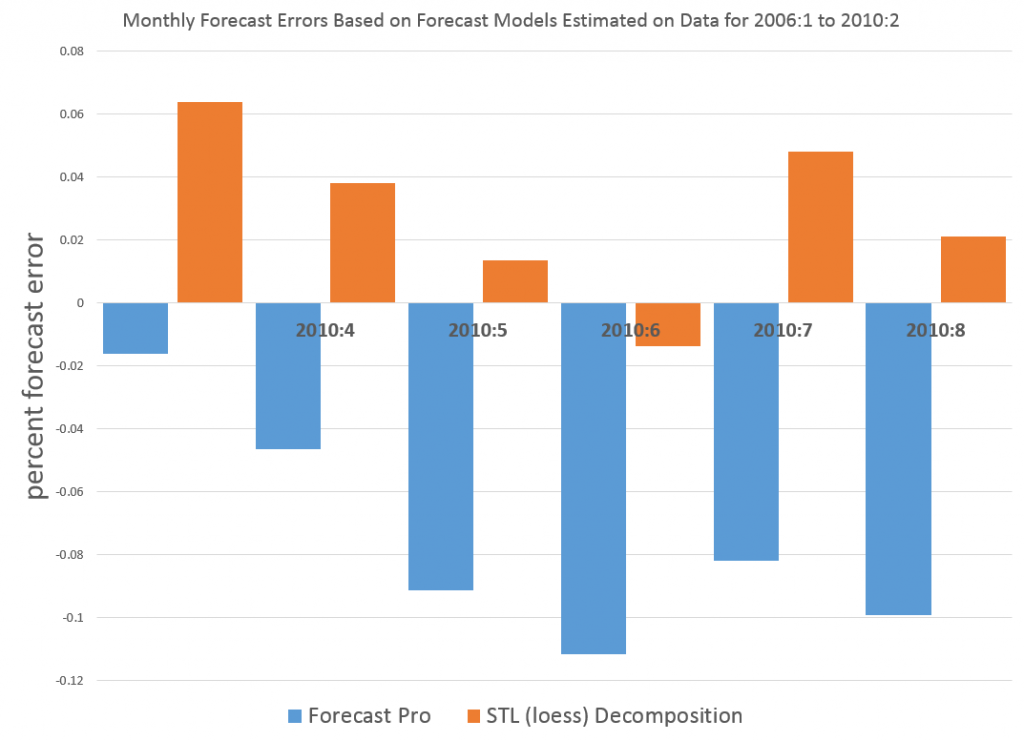
Here’s a typical graph comparing the forecast errors from the Forecast Pro runs with STL Decomposition.

goldloessFP

The trend component extracted by the STL decomposition was uncomplicated and easy to forecast by linear extrapolation. I added the seasonal component to these extrapolations to get the monthly forecasts over the six month forecast horizon. Forecast Pro, on the other hand, did not signal the existence of a seasonal component in this series, and, furthermore, identified the optimal forecast model as a random walk and the optimal forecast as the last observed value.

Here is the trend component from the STL decomposition.

Goldtrend

Discussion

Potentially, there is lots more to discuss here.

For example, to establish forecasts based on the loess decomposition of the gold price outperform Forecast Pro means compiling a large number of forecast comparisons, ideally one for all possible training sets beyond a minimum number of observations required for stable calculation of the STL algorithm. That is, each training set generates somewhat different values for the trend, seasonals, and residuals with loess decomposition. And Forecast Pro needs to be run for all these possible training sets also, with forecasts compared to out-of-sample data.

While I have not gone to this extent, I have done these computations several times with good results for STL decomposition.

Also, it’s clear that loess decomposition extracts constant variance seasonals. However, the shape of these seasonals change as the training set changes. It is necessary, thus, to study whether these changes can reflect multiplicative seasonality, for series in which that type of seasonality predominates. For example, perhaps STL seasonals tend to reflect the end points of the training sets.

Bergmeir, Hyndman, and Benıtez (BHB) apply a Box Cox transformation in one of their bagged exponential smoothing methods. This is possibly another way to sidestep problems of multiplicative or hetereoskedastic seasonality. It also makes sense when one is attempting to bag a time series.

However, my explorations suggest the results of STL decomposition are quite flexible, and, in the case of this gold price series, often produce superior forecasts to results from one of the main off-the-shelf automatic forecasting programs.

I personally am going to work on including STL decomposition in my forecasting toolkit.

Links – end of March

US Economy and Social Issues

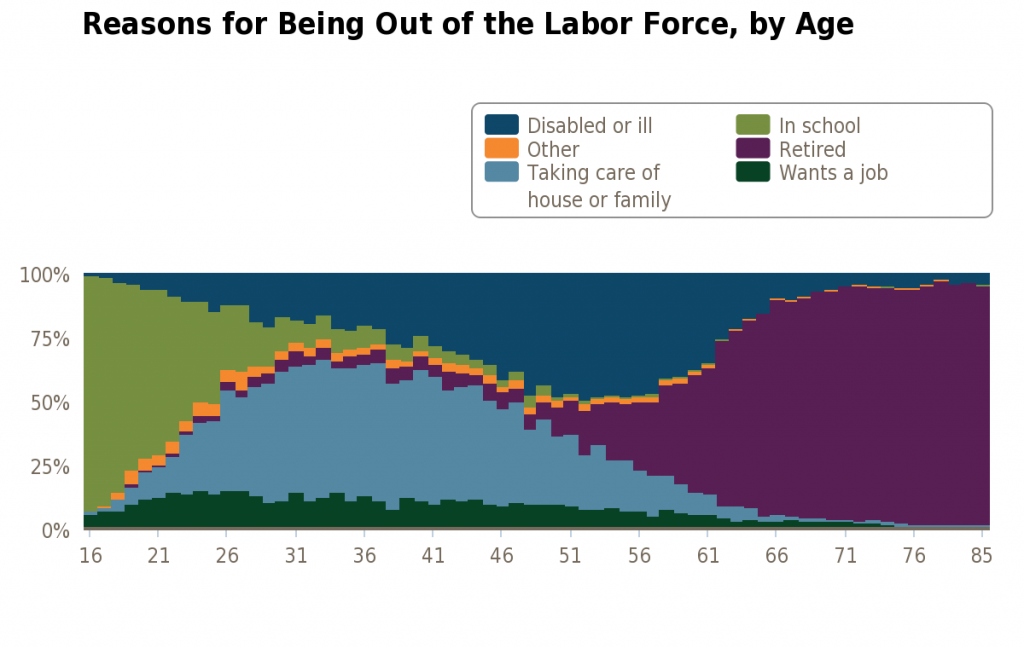
Reasons for Declining Labor Force Participation

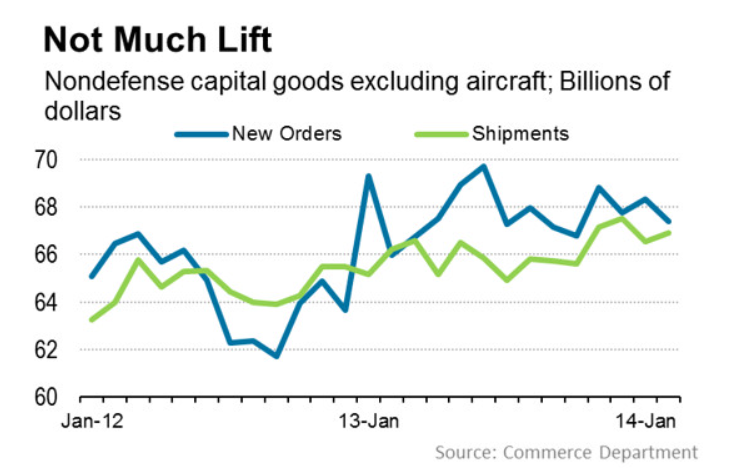
LFchartVital Signs: Still No Momentum in Business Spending

investment

Urban Institute Study – How big is the underground sex economy in eight cities employs an advanced statistical design. It’s sort of a model study, really.

Americans Can’t Retire When Bill Gross Sees Repression

Feeble returns on the safest investments such as bank deposits and fixed-income securities represent a “financial repression” transferring money from savers to borrowers, says Bill Gross, manager of the world’s biggest bond fund.

Robert Reich – The New Billionaire Political Bosses

American democracy used to depend on political parties that more or less represented most of us. Political scientists of the 1950s and 1960s marveled at American “pluralism,” by which they meant the capacities of parties and other membership groups to reflect the preferences of the vast majority of citizens.

Then around a quarter century ago, as income and wealth began concentrating at the top, the Republican and Democratic Parties started to morph into mechanisms for extracting money, mostly from wealthy people.

Finally, after the Supreme Court’s “Citizen’s United” decision in 2010, billionaires began creating their own political mechanisms, separate from the political parties. They started providing big money directly to political candidates of their choice, and creating their own media campaigns to sway public opinion toward their own views.

Global Economy

Top global risks you can’t ignore – good, short read

How Can Africa’s Water and Sanitation Shortfall be Solved? – interesting comments by experts on the scene, including –

Most African water utilities began experiencing a nose-dive in the late 1970s under World Bank and IMF policies. Many countries were suffering from serious trade deficits which had enormous implications for their budgets, incomes, and their abilities to honour loan obligations to, among others, bilateral and multilateral partners. These difficulties for African countries coincided around that period, with a major shift in global economic thought; a shift from heterodox economic thinking which favoured state intervention in critical sectors of the economy, to neoliberal economic thought which is more hostile to state intervention and prefers the deregulation of markets and their unfettered operation. This thought became dominant in the IMF and World Bank and influenced structural adjustment austerity packages that the two institutions prescribed to the struggling African economies at the time. This point is fundamental and cannot be divorced from any comprehensive analysis of the access deficit in African countries.

The austerity measures enforced by the Bank and IMF ensured a drastic reduction of state funding to the utilities, resulting in deterioration of facilities, poor conditions for staff and a mass exodus of expert staff. In the face of the resulting difficulties, the Bank and IMF held out only one option for the governments; the option of full cost recovery and of privatisation. This sealed the expectations of any funding for the sector as the private sector found the water sector highly risky to invest in. Following the common interventions set out by the World Bank, the countries achieved mostly poor results.

Contrary to much mainstream discourse, neither privatisation nor commercialisation constitute an adequate or sustainable way of managing urban water utilities to ensure access to people in Africa given the extreme poverty that confronts a significant portion of the population. The solution lies in a progressive tax-supported water delivery system that ensures access for all, supported by a management structure and a balanced set of incentives that ensure performance.

Analytics

Machine Learning in 7 Pictures

Basic machine learning concepts of Bias vs Variance Tradeoff, Avoiding overfitting, Bayesian inference and Occam razor, Feature combination, Non-linear basis functions, and more – explained via pictures

The Universe

Great picture of the planet Mercury https://twitter.com/Iearnsomething/status/448165339290173440/photo/1

Mercury