Category Archives: celebrity forecasters

Links May 10, 2015

I start these Links with how the polls in the UK Election fell on their face and why. The cell phone is somewhat implicated, and, almost by association, I move onto the Internet of Everything (IoE), then to thoughts on how the Internet and artificial intelligence (AI) is shaping things.

It’s important to keep things loose and open on occasion, since the world itself doesn’t show tremendous closure, but is open, and evolving.

Election Poll Predictions In La-La Land

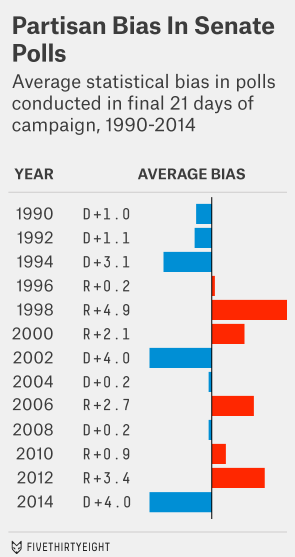
Nate Silver, the celebrity forecaster heading up FiveThirtyEight, had a big miss in calling the recent British Election (See What We Got Wrong In Our 2015 U.K. General Election Model and Nate Silver: Polls are failing us).

DavidCameron

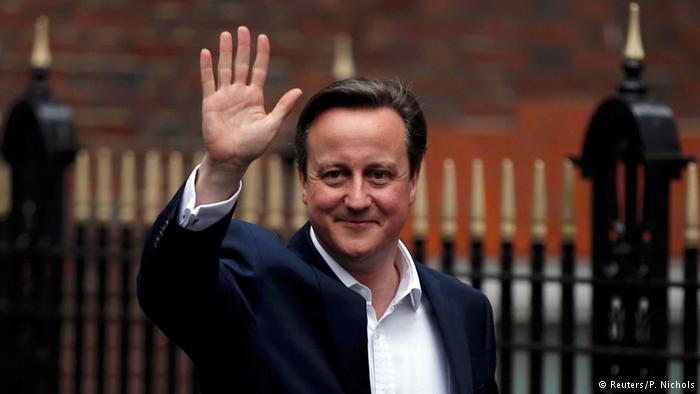
A similar misfire happened in the recent Israeli elections, where Netanyuahu won by significant numbers in an election predicted to be neck-and-neck.

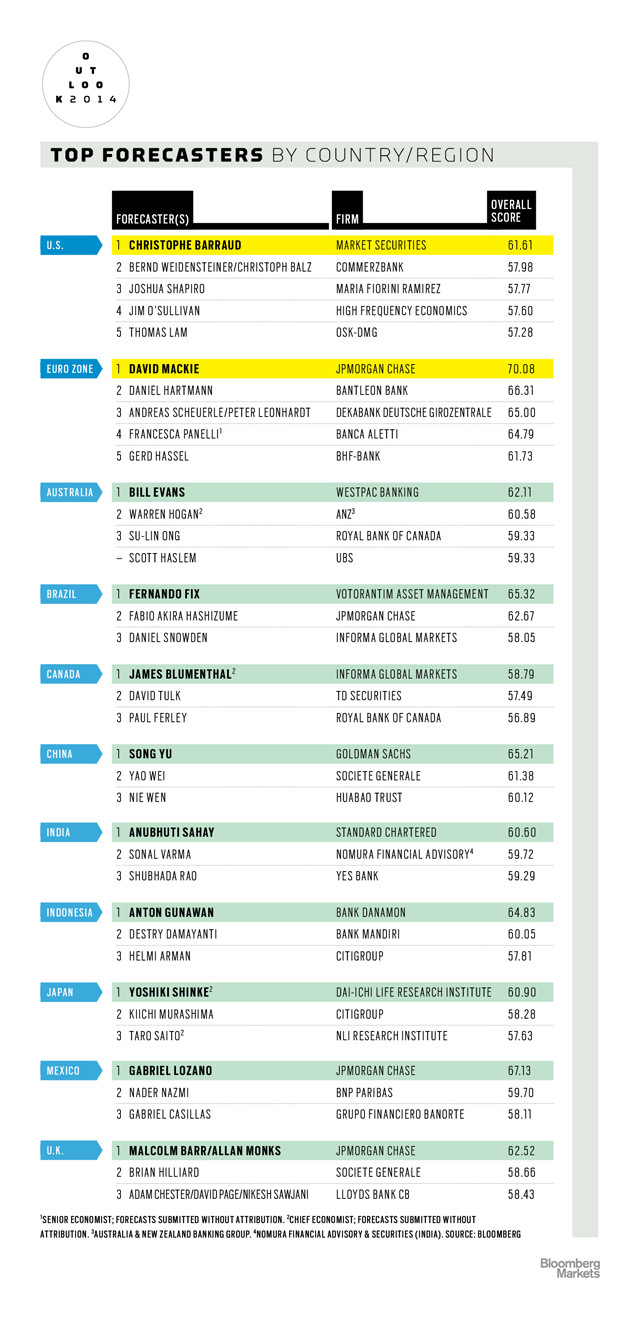
The cell phone may be partly to blame, as noted in British polling flop prompts global reassessments

..changes in communications are threatening the viability of public election polling in many developed countries where the landline phone was once a reliable medium for representative surveys.

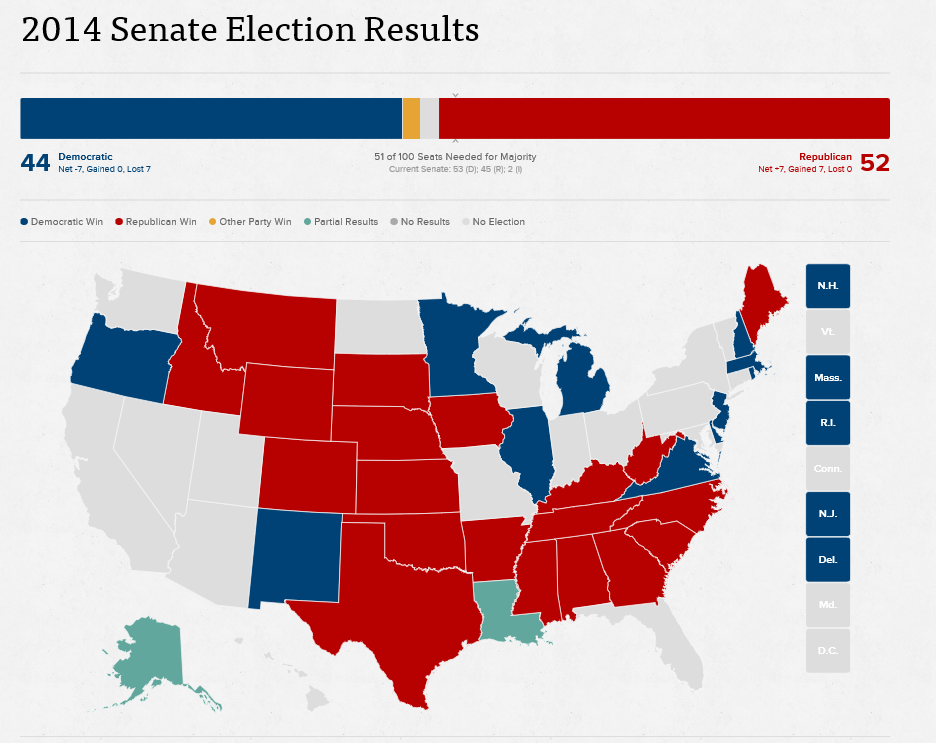
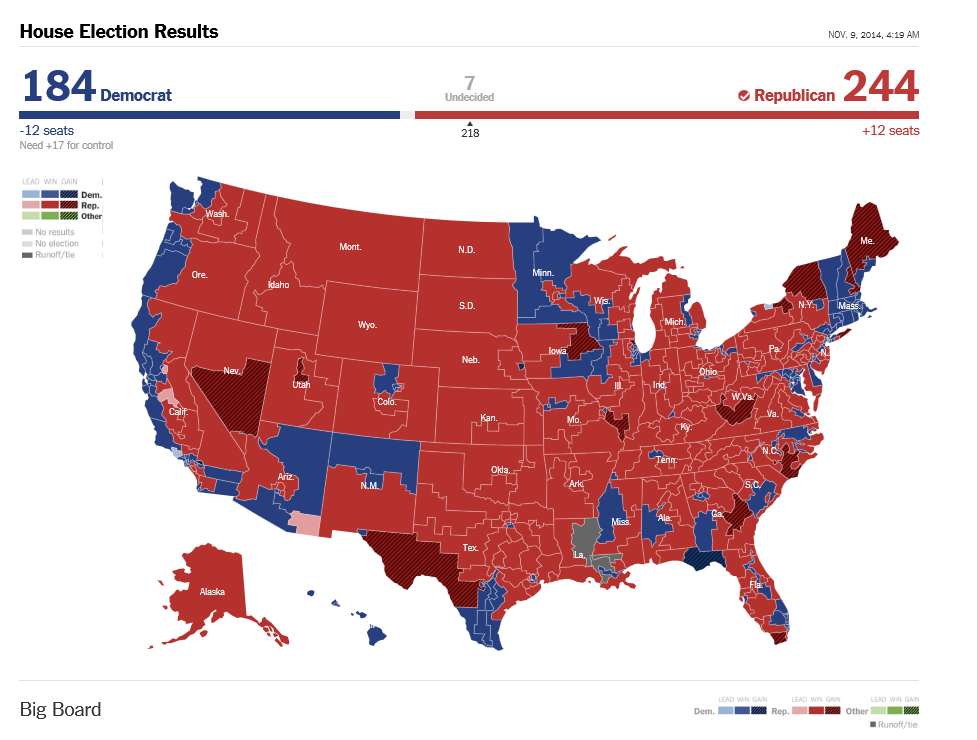
This is going to be a big forecasting issue in the upcoming General Elections in the US.

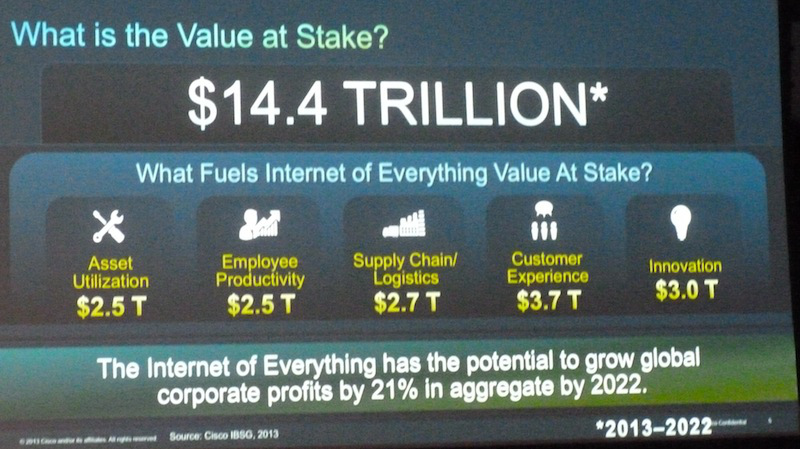
The Internet of Everything (IoE)

From time to time, Cisco Systems produces projections and forecasts of Internet traffic volumes (presumably to some extent on its equipment). Now there is the Internet of Everything (IoE), a sort of expansion of the “internet of things.”

InternetOfEverything

Internet of Everything: A $4.6 Trillion Public-Sector Opportunity

Peter Diamandis writes,

..Imagine a world in which everything is connected and packed with sensors. 50+ billion connected devices, loaded with a dozen or more sensors, will create a trillion-sensor ecosystem. These devices will create what I call a state of perfect knowledge, where we’ll be able to know what we want, where we want, when we want. Combined with the power of data mining and machine learning, the value that you can create and the capabilities you will have as an individual and as a business will be extraordinary.

Here are some examples posted by Vincent Granville at Data Science Central.

◾Retail: Beyond knowing what you purchased, stores will monitor your eye gaze, knowing what you glanced at… what you picked up and considered, and put back on the shelf. Dynamic pricing will entice you to pick it up again.

◾City Traffic: Cars looking for parking cause 40% of traffic in city centers. Parking sensors will tell your car where to find an open spot.

◾Lighting: Streetlights and house lights will only turn on when you’re nearby.

◾Dynamic pricing: In the future, everything has dynamic pricing where supply and demand drives pricing. Uber already knows when demand is high, or when I’m stuck miles from my house, and can charge more as a result.

◾Transportation: Self-driving cars and IoE will make ALL traffic a thing of the past.

◾Healthcare: You will be the CEO of your own health. Wearables will be tracking your vitals constantly, allowing you and others to make better health decisions.

◾Forests: With connected sensors placed on trees, you can make urban forests healthier and better able to withstand — and even take advantage of — the effects of climate change.

◾Office Furniture: Software and sensors embedded in office furniture are being used to improve office productivity, ergonomics and employee health.

◾Invisibles: Forget wearables, the next big thing is sensor-based technology that you can’t see, whether they are in jewelry, attached to the skin like a bandage, or perhaps even embedded under the skin or inside the body. By 2017, 30% of wearables will be “unobtrusive to the naked eye,” according to market researcher Gartner.

Daniel Kraft, a physician, is a name to watch in this @Daniel_Kraft.

Impact of Artificial Intelligence (AI)

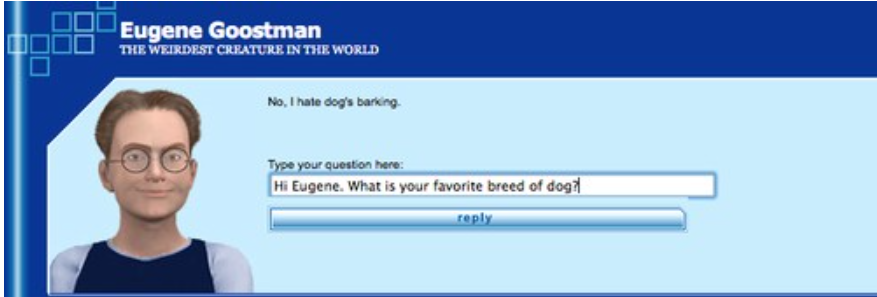
Generally, the under-the-radar spread of AI – in cell phone and tablet features such as Siri, or Google’s Now, which, incidentally, may be pulling ahead in terms of sheer accuracy – meets criteria of technology which can fundamentally change things.

It’s so easy to drive along and ask Siri for directions, or where a good restaurant is. And people focus on their cell phones in public places. There’s even the cartoon about a couple out on a date texting each other across the table.

The impact of technology on society has always been one of my favorite topics. For more than a decade, the Internet and emergent IT companies, have triggered huge, on-the-ground changes, possibly not all good. But the absorption of advertising revenues by Google has been dramatic, and a game-changer for newspapers and magazines (print technology). Online book sales put Borders Books out of business, and impacts book stores everywhere. The music business has changed forever, with singers and bands now almost wholly reliant on tours and real audiences for real revenue, with record and song sales contributing only minor funds to most.

I’d be interested in adding to this list, if readers have thoughts on this.

Top Forecasters of the US Economy, 2013-2014

Once again, Christophe Barraud, a French economist based in Paris, is ranked as the “best forecaster of the US economy” by Bloomberg (see here).

This is quite an accomplishment, considering that it is based on forecasts for 14 key monthly indicators including CPI, Durable Goods Orders, Existing Home Sales, Housing Starts, IP, ISM Manufacturing, ISM Nonmanufacturing, New Home Sales, Nonfarm Payrolls, Personal Income, Personal Spending, Retail Sales, Unemployment and GDP.

For this round, Bloomberg considered two years of data ending ended November 2014.

Barraud was #1 in the rankings for 2011-2012 also.

In case you wanted to take the measure of such talent, here is a recent interview with Barraud conducted by Figaro (in French).

The #2 slot in the Bloomberg rankings of best forecasters of the US economy went to Jim O’Sullivan of High Frequency Economics.

Here just an excerpt from an interview by subscription with O’Sullivan – again to take the measure of the man.

While I have been absorbed in analyzing a statistical/econometric problem, a lot has transpired – in Switzerland, in Greece and the Ukraine, and in various global regions. While I am optimistic in outlook presently, I suspect 2015 may prove to be a year of surprises.

Economic Outlook 2015 – I

Well, it’s that time – end of one calendar year and, soon, the beginning of another, and that means major banks and financial institutions are releasing their big picture “economic outlooks” for 2015.

Here are two well worth watching.

Jan Hatzius of Goldman Sachs provides an interesting, short discussion of the US economic outlook for 2015.

Huw Pills, also of Goldman Sachs, gives a nuanced discussion of Europe’s more vulnerable economic position for 2015.

For other regions, see Outlook 2015.

Barron’s Outlook 2015: Stick With the Bull focuses on stocks and is based on a survey of investment advisors; its outlook is decidedly upbeat.

Born in March 2009, today’s bull market is the fourth longest in history—and it isn’t about to end, despite last week’s shellacking. That’s the word from Wall Street’s top strategists, who expect the Standard & Poor’s 500 stock index to rise 10% in 2015. A gain of that magnitude surely would merit applause, coming atop an 8% rally year to date, not to mention 2013’s 30% advance. Almost six years in, the old bull still seems sprightly….

U.S. stocks are neither cheap nor expensive, based on the market’s current price/earnings ratio of 15.8 times future four-quarter earnings. Few strategists expect the multiple to expand much in the coming year.

“In isolation, U.S. stocks are on the expensive side,” says Jeffrey Knight, head of global asset allocation at Columbia Management. But measured against other financial assets—whether emerging-market equities or developed-market bonds—U.S. shares look strong, he adds.

And, in researching this article, I found Janet Yellen’s Dashboard available from the Brookings Institution website.

A lot of what happens in 2015 has to do with whether, when, and then how much the Fed raises interest rates.

I’m aiming to be as inclusive as I can in putting up these videos of the various celebrity forecasters and their outlook for 2015, so stay tuned.

Predicting the Midterm Elections

Predicting the outcome of elections is a fascinating game with more and more sophisticated predictive analytics.

The Republicans won bigtime, of course.

They won comfortable control of the US Senate and further consolidated their majority in the House of Representatives.

Counting before the Louisiana runoff election, which a Republican is expected to win, the balance is 52 to 44 in the Senate, highlighted in the following map from Politico.

senateresults

In the US House of Representatives, Republicans gained 12 seats for a 57 percent majority, 244 to 184, as illustrated in a New York Times graphic.

houseresults

Did Anyone See This Coming?

Nate Silver, who was prescient in the 2012 General Election, issued an update on his website FiveThirtyEight on November 4 stating that Republicans Have A 3 In 4 Chance Of Winning The Senate.

And so they did win.

Salon’s review of Silver’s predictions notes that,

Overall, the candidate with better-than-even odds in FiveThirtyEight’s model won or is likely to in 34 of the 36 Senate contests this year, for a success rate of 94 percent.

The track record for the governorships was less shining, with upsets in Maryland and Kansas and several wins by candidates with unfavorable odds in the FiveThirtyEight lineup.

Bias in Polls

Silver’s forecasting model weighs both polling data and fundamentals- like demographics.

After the election, Silver blamed some of his mistakes on bias in polls, claiming that, this time, the Polls Were Skewed Toward Democrats.

Based on results as reported through early Wednesday morning …. the average Senate poll conducted in the final three weeks of this year’s campaign overestimated the Democrat’s performance by 4 percentage points. The average gubernatorial poll was nearly as bad, overestimating the Democrat’s performance by 3.4 points.

He backs this up with details of bias in polls by race, and, interestingly, throws up the following exhibit, suggesting that there is nothing systematic about bias in the polls.

biaspolls

Here is another discussion of mid-term election polling error – arguing it is significantly greater during midterms than in Presidential election years.

While not my area of expertise (although I have designed and analyzed survey data), I’m think the changing demographics of “cell-only” voters, no-call lists, and people’s readiness to hang up on unsolicited calls impacts the reliability of polling data, as usually gathered. What Silver seems to show with his graphic above, is that adjusting for these changes causes another form of unreliability.

Video Friday – the Outlook for the Rest of the Year

Here is the latest Wells Fargo economic outlook video, featuring John Silvia – one of the top forecasters, according to Bloomberg.

 Then, there is David Stockman, reminding us all about geopolitical and financial risks just at the time the Malaysian airliners got shot out of the sky.

Stockman, former Reagan Budget Director and Wall Street operator, has really become what commentators generally call an “iconoclast.”

And, I’m sorry, but I find it most useful to draw opinions from across a wide range. “Triangulation” is my best method to arrive at a perspective on the future.

Mid-Year Economic Projections and Some Fireworks

Greetings and Happy Fourth of July! Always one of my favorite holidays.

Practically every American kid loves the Fourth, because there are fireworks. Of course, back in the day, we had cherry bombs and really big firecrackers. Lots of thumbs and fingers were blown off. But it’s still fun for kids, and safer no doubt.

Before that, here are two mid-year forecasts from Goldman Sachs’ Chief Economist Jan Hatzius and an equity outlook from Wells Fargo Bank.

Jan Hatzius Goldman Sachs – mid-year forecast (June 12) 

And Wells Fargo (June 23rd). 

Both these, unfortunately, did not have the information about the additional write-down of the 1st quarter real GDP that came out June 25, so we will be looking for futher updates.

Meanwhile, some fireworks.

First, Happy Fourth from the US Navy. 

And some ordinary fireworks from the National Mall, US Capitol, 2012. 

Links – early July 2014

While I dig deeper on the current business outlook and one or two other issues, here are some links for this pre-Fourth of July week.

Predictive Analytics

A bunch of papers about the widsom of smaller, smarter crowds I think the most interesting of these (which I can readily access) is Identifying Expertise to Extract the Wisdom of Crowds which develops a way by eliminating poorly performing individuals from the crowd to improve the group response.

Application of Predictive Analytics in Customer Relationship Management: A Literature Review and Classification From the Proceedings of the Southern Association for Information Systems Conference, Macon, GA, USA March 21st–22nd, 2014. Some minor problems with writing English in the article, but solid contribution.

US and Global Economy

Nouriel Roubini: There’s ‘schizophrenia’ between what stock and bond markets tell you Stocks tell you one thing, but bond yields suggest another. Currently, Roubini is guardedly optimistic – Eurozone breakup risks are receding, US fiscal policy is in better order, and Japan’s aggressively expansionist fiscal policy keeps deflation at bay. On the other hand, there’s the chance of a hard landing in China, trouble in emerging markets, geopolitical risks (Ukraine), and growing nationalist tendencies in Asia (India). Great list, and worthwhile following the links.

The four stages of Chinese growth Michael Pettis was ahead of the game on debt and China in recent years and is now calling for reduction in Chinese growth to around 3-4 percent annually.

Because of rapidly approaching debt constraints China cannot continue what I characterize as the set of “investment overshooting” economic polices for much longer (my instinct suggests perhaps three or four years at most). Under these policies, any growth above some level – and I would argue that GDP growth of anything above 3-4% implies almost automatically that “investment overshooting” policies are still driving growth, at least to some extent – requires an unsustainable increase in debt. Of course the longer this kind of growth continues, the greater the risk that China reaches debt capacity constraints, in which case the country faces a chaotic economic adjustment.

Politics

Is This the Worst Congress Ever? Barry Ritholtz decries the failure of Congress to lower interest rates on student loans, observing –

As of July 1, interest on new student loans rises to 4.66 percent from 3.86 percent last year, with future rates potentially increasing even more. This comes as interest rates on mortgages and other consumer credit hovered near record lows. For a comparison, the rate on the 10-year Treasury is 2.6 percent. Congress could have imposed lower limits on student-loan rates, but chose not to.

This is but one example out of thousands of an inability to perform the basic duties, which includes helping to educate the next generation of leaders and productive citizens. It goes far beyond partisanship; it is a matter of lack of will, intelligence and ability.

Hear, hear.

Climate Change

Climate news: Arctic seafloor methane release is double previous estimates, and why that matters This is a ticking time bomb. Article has a great graphic (shown below) which contrasts the projections of loss of Artic sea ice with what actually is happening – underlining that the facts on the ground are outrunning the computer models. Methane has more than an order of magnitude more global warming impact that carbon dioxide, per equivalent mass.

ArcticSeaIce

Dahr Jamail | Former NASA Chief Scientist: “We’re Effectively Taking a Sledgehammer to the Climate System”

I think the sea level rise is the most concerning. Not because it’s the biggest threat, although it is an enormous threat, but because it is the most irrefutable outcome of the ice loss. We can debate about what the loss of sea ice would mean for ocean circulation. We can debate what a warming Arctic means for global and regional climate. But there’s no question what an added meter or two of sea level rise coming from the Greenland ice sheet would mean for coastal regions. It’s very straightforward.

Machine Learning

EG

Computer simulating 13-year-old boy becomes first to pass Turing test A milestone – “Eugene Goostman” fooled more than a third of the Royal Society testers into thinking they were texting with a human being, during a series of five minute keyboard conversations.

The Milky Way Project: Leveraging Citizen Science and Machine Learning to Detect Interstellar Bubbles Combines Big Data and crowdsourcing.

Highlights of National and Global Energy Projections

Christof Rühl – Group Chief Economist at British Petroleum (BP) just released an excellent, short summary of the global energy situation, focused on 2013.

Ruhl

Rühl’s video is currently only available on the BP site at –

http://www.bp.com/en/global/corporate/about-bp/energy-economics/statistical-review-of-world-energy.html

Note the BP Statistical Review of World Energy June 2014 was just released (June 16).

Highlights include –

  • Economic growth is one of the biggest determinants of energy growth. This means that energy growth prospects in Asia and other emerging markets are likely to dominate slower growth in Europe – where demand is actually less now than in 2005 – and the US.
  • Tradeoffs and balancing are a theme of 2013. While oil prices remained above $100/barrel for the third year in a row, seemingly stable, underneath two forces counterbalanced one another – expanding production from shale deposits in the US and an increasing number of supply disruptions in the Middle East and elsewhere.
  • 2013 saw a slowdown in natural gas demand growth with coal the fastest growing fuel. Growth in shale gas is slowing down, partly because of a big price differential between gas and oil.
  • While CO2 emissions continue to increase, the increased role of renewables or non-fossil fuels (including nuclear) have helped hold the line.
  • The success story of the year is that the US is generating new fuels, improving its trade position and trade balance with what Rühl calls the “shale revolution.”

The BP Statistical Reviews of World Energy are widely-cited, and, in my mind, rank alongside the Energy Information Agency (EIA) Annual Energy Outlook and the International Energy Agency’s World Energy Outlook. The EIA’s International Energy Outlook is another frequently-cited document, scheduled for update in July.

Price is the key, but is difficult to predict

The EIA, to its credit, publishes a retrospective on the accuracy of its forecasts of prices, demand and production volumes. The latest is on a page called Annual Energy Outlook Retrospective Review which has a revealing table showing the EIA projections of the price of natural gas at wellhead and actual figures (as developed from the Monthly Energy Review).

I pulled together a graph showing the actual nominal price at the wellhead and the EIA forecasts.

natgasforecasterrorgraph

The solid red line indicates actual prices. The horizontal axis shows the year for which forecasts are made. The initial value in any forecast series is nowcast, since wellhead prices are available at only a year lag. The most accurate forecasts were for 2008-2009 in the 2009 and 2010 AEO documents, when the impact of the severe recession was already apparent.

Otherwise, the accuracy of the forecasts is completely underwhelming.

Indeed, the EIA presents another revealing chart showing the absolute percentage errors for the past two decades of forecasts. Natural gas prices show up with more than 30 percent errors, as do imported oil prices to US refineries.

Predicting Reserves Without Reference to Prices

Possibly as a result of the difficulty of price projections, the EIA apparently has decoupled the concept of Technically Recoverable Resources (TRR) from price projections.

This helps explain how you can make huge writedowns of TRR in the Monterey Shale without affecting forecasts of future shale oil and gas production.

Thus in Assumptions to AEO2014 and the section called the Oil and Gas Supply Module, we read –

While technically recoverable resources (TRR) is a useful concept, changes in play-level TRR estimates do not necessarily have significant implications for projected oil and natural gas production, which are heavily influenced by economic considerations that do not enter into the estimation of TRR. Importantly, projected oil production from the Monterey play is not a material part of the U.S. oil production outlook in either AEO2013 or AEO2014, and was largely unaffected by the change in TRR estimates between the 2013 and 2014 editions of the AEO. EIA estimates U.S. total crude oil production averaged 8.3 million barrels/day in April 2014. In the AEO2014 Reference case, economically recoverable oil from the Monterey averaged 57,000 barrels/day between 2010 and 2040, and in the AEO2013 the same play’s estimated production averaged 14,000 barrels/day. The difference in production between the AEO2013 and AEO2014 is a result of data updates for currently producing wells which were not previously linked to the Monterey play and include both conventionally-reservoired and continuous-type shale areas of the play. Clearly, there is not a proportional relationship between TRR and production estimates – economics matters, and the Monterey play faces significant economic challenges regardless of the TRR estimate.

This year EIA’s estimate for total proved and unproved U.S. technically recoverable oil resources increased 5.4 billion barrels to 238 billion barrels, even with a reduction of the Monterey/Santos shale play estimate of unproved technically recoverable tight oil resources from 13.7 billion barrels to 0.6 billion barrels. Proved reserves in EIA’s U.S. Crude Oil and Natural Gas Proved Reserves report for the Monterey/Santos shale play are withheld to avoid disclosure of individual company data. However, estimates of proved reserves in NEMS are 0.4 billion barrels, which result in 1 billion barrels of total TRR.

Key factors driving the adjustment included new geology information from a U. S. Geological Survey review of the Monterey shale and a lack of production growth relative to other shale plays like the Bakken and Eagle Ford. Geologically, the thermally mature area is 90% smaller than previously thought and is in a tectonically active area which has created significant natural fractures that have allowed oil to leave the source rock and accumulate in the overlying conventional oil fields, such as Elk Hills, Cat Canyon and Elwood South (offshore). Data also indicate the Monterey play is not over pressured and thus lacks the gas drive found in highly productive tight oil plays like the Bakken and Eagle Ford. The number of wells per square mile was revised down from 16 to 6 to represent horizontal wells instead of vertical wells. TRR estimates will likely continue to evolve over time as technology advances, and as additional geologic information and results from drilling activity provide a basis for further updates.

So the shale oil in the Monterey formation may have “migrated” from that convoluted geologic structure to sand deposits or elsewhere, leaving the productive potential much less.

I still don’t understand how it is possible to estimate any geologic reserve without reference to price, but there you have it.

I plan to move on to more manageable energy aggregates, like utility power loads and time series forecasts of consumption in coming posts.

But the shale oil and gas scene in the US is fascinating and a little scary. Part of the gestalt is the involvement of smaller players – not just BP and Exxon, for example. According to Chad Moutray, Economist for the National Association of Manufacturers, the fracking boom is a major stimulus to manufacturing jobs up and down the supply chain. But the productive life of a fracked oil or gas well is typically shorter than a conventional oil or gas well. So some claim that the increases in US production cannot be sustained or will not lead to any real period of “energy independence.” For my money, I need to watch this more before making that kind of evaluation, but the issue is definitely there.

The Tibshirani’s – Statistics and Machine Learning Superstars

As regular readers of this blog know, I’ve migrated to a weekly (or potentially longer) topic focus, and this week’s topic is variable selection.

And the next planned post in the series will compare and contrast ridge regression and the LASSO (least absolute shrinkage and selection operator). There also are some new results for the LASSO. But all this takes time and is always better when actual computations can be accomplished to demonstrate points.

But in researching this, I’ve come to a deeper appreciation of the Tibshiranis.

Robert Tibshirani was an early exponent of the LASSO and has probably, as much as anyone, helped integrate the LASSO into standard statistical procedures.

Here’s his picture from Wikipedia.

RobertTib2

You might ask why put his picuture up, and my answer is that Professor Robert Tibshirani (Stanford) has a son Ryan Tibshirani, whose picture is just below.

Ryan Tibsharani has a great Data Mining course online from Carnegie Mellon, where he is an Assistant Professor.

RyanTib

Professor Ryan Tibshirani’s Spring 2013 a Data Mining course can be found at http://www.stat.cmu.edu/~ryantibs/datamining/

Reviewing Ryan Tibsharani’s slides is very helpful in getting insight into topics like cross validation, ridge regression and the LASSO.

And let us not forget Professor Ryan Tibshirani is author of essential reading about how to pick your target in darts, based on your skill level (hint – don’t go for the triple-20 unless you are good).

Free Books on Machine Learning and Statistics

Robert Tibshirani et al’s text – Elements of Statistical Learning is now in the 10th version and is available online free here.

But the simpler An Introduction to Statistical Leaning is also available for an online download of a PDF file here. This is the corrected 4th printing. The book, which I have been reading today, is really dynamite – an outstanding example of scientific exposition and explanation.

These guys and their collaborators are truly gifted teachers. They create windows into new mathematical and statistical worlds, as it were.

Top Bloomberg Macro Forecaster Rankings for 2014

Bloomberg compiles global rankings for forecasters of US macro variables, based on their forecasts of a range of key monthly indicators. The rankings are based on performance over two year periods, ending November in the year the rankings are announced.

Here is a summary sheet for the past three years for the top twenty US macroeconomic forecasters or forecasting teams, with their organizational affiliation (click to enlarge).

Top Bloomberg rankings

SOURCES: http://www.christophe-barraud.com/wp-content/uploads/2014/01/Classement-Bloomberg-janvier-20141.pdf, http://www.bloomberg.com/bb/avfile/r5M7ODl4WNms, https://www.economy.com/home/products/samples/2012-01-20-Bloomberg.pdf

The list of top forecasters for the US economy has been fairly stable recently. At least seventeen out of the top twenty forecasters for the US are listed twice; six forecasters or forecasting teams made the top list in all three periods.

Interestingly, European forecasters have recently taken the lead. Bloomberg News notes Number One – Christophe Barraud is only 27 years old, and developed an interest in forecasting, apparently, as a teenager, when he and his dad bet on horses at tracks near Nice, France.

In the most recent ranking, key indicators include CPI, Durable Goods Orders, Existing Home Sales, Housing Starts, IP, ISM Manufacturing, ISM Nonmanufacturing, New Home Sales, Nonfarm Payrolls, Personal Income, Personal Spending, PPI, Retail Sales, Unemployment and GDP. A total of 68 forecasters or forecasting teams qualified for and participated in the ranking exercise.

Bloomberg Markets also announced other regional rankings, shown in this infographic

Bloombergmarkets And as a special treat this Friday, for the collectors among readers, here is the Ben Bernacke commemorative baseball card, developed at the Fed as a going away present.

Bernacke