According to Mizuno et al, the worst inflation in recent history occurred in Hungary after World War II. The exchange rate for the Hungarian Pengo to the US dollar rose from 100 in July 1945 to 6 x 1024 Pengos per dollar by July 1946.
Hyperinflations are triggered by inflationary expectations. Past increases in prices influence expectations about future prices. These expectations trigger market behavior which accelerate price increases in the current period, in a positive feedback loop. Bounds on inflationary expectations are loosened by legitimacy issues relating to the state or social organization.
Hyperinflation can become important for applied forecasting in view of the possibility of smaller countries withdrawing from the Euro.
However, that is not the primary reason I want to address this topic at this point in time.
Rather, episodes of hyperinflation share broad and interesting similarities to the movement of prices in asset bubbles – like the dotcom bubble of the late 1990’s, the Hong Kong Hang Seng Stock Market Index from 1970 to 2000, and housing price bubbles in the US, Spain, Ireland, and elsewhere more recently.
Hyperinflations exhibit faster than exponential growth in prices to some point, at which time the regime shifts. This is analogous to the faster than exponential growth of asset prices in asset bubbles, and has a similar basis. Thus, in an asset bubble, the growth of prices becomes the focus of action. Noise or momentum traders become active, buying speculatively, often financing with Ponzi-like schemes. In a hyperinflation, inflation and its acceleration gets written into to the pricing equation. People stockpile and place advance orders and, on the supply side, markup prices assuming rising factor costs.
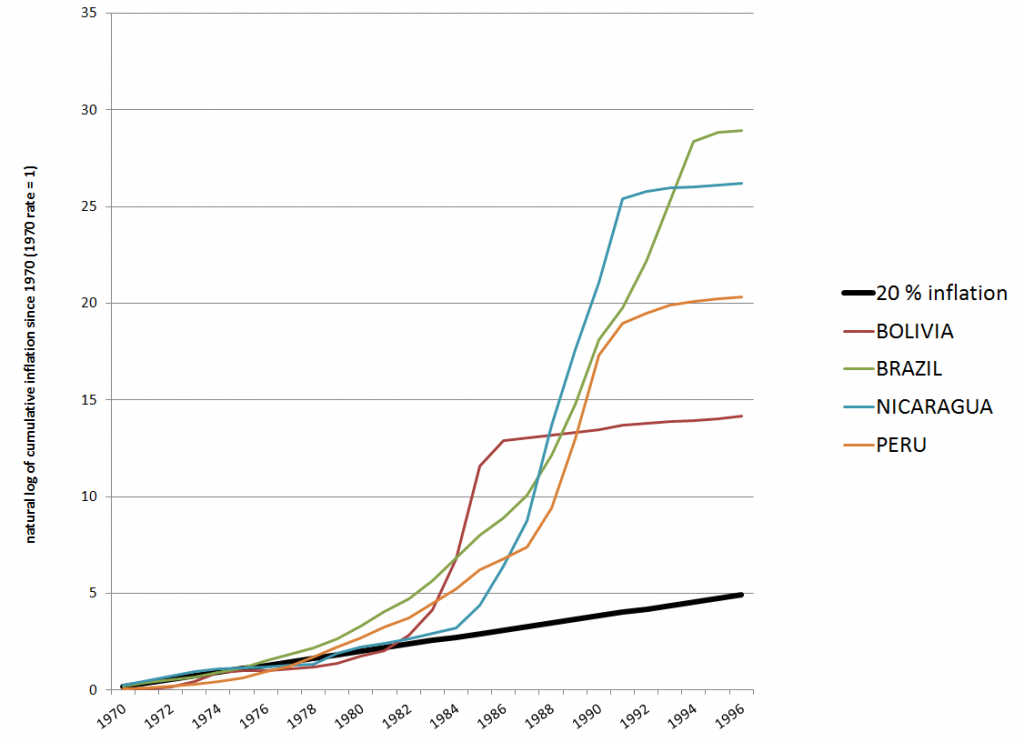
The following is a logarithmic chart of inflation indexes in four South and Central American countries from 1970 to 1996 based on archives of the IMF World Economic Outlook (click to enlarge).
The straight line indicates an exponential growth of prices of 20 percent per year, underlining the faster than exponential growth in the other curves.
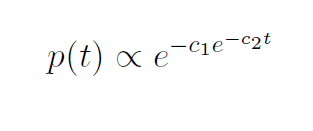
After an initial period, each of these hyperinflation curves exhibit similar mathematical properties. Mizuno et al fit negative double exponentials of the following form to the price data.
Sornette, Takayasu, and Zhouargue that the double exponential is “nothing but a discrete-time approximation of a general power law growth endowed with a finite-time singularity at some critical time tc.”
This enables the authors to develop an analysis which not only fits the ramping prices in each country, but also to predicts the end of the hyperinflation with varying success.
The rationale for this is simply that unleashing inflationary expectations, beyond a certain point, follows a common mathematical theme, and ends at a predictable point.
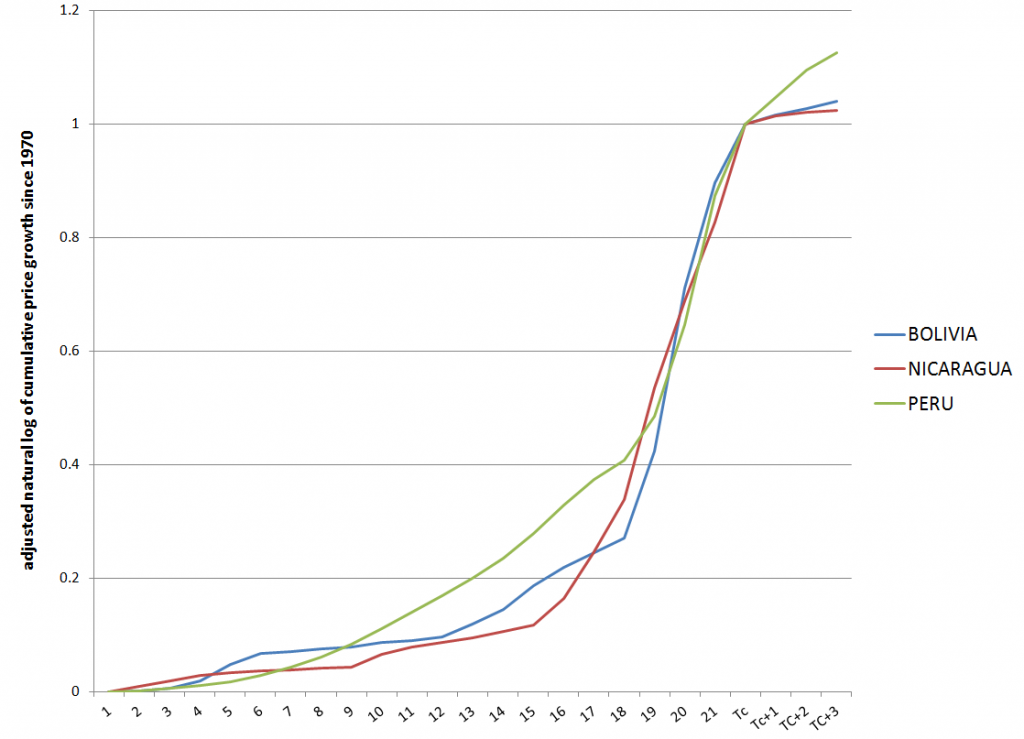
It is true that simple transformations render these hyperinflation curves very similar, as shown in the following chart.
Here I scale the logs of the cumulative price growth for Bolivia, Nicaragua, and Peru, adjusting them to the same time period (22 years). Clearly, the hyperinflation becomes more predictable after several years, and the takeoff rate to collapse seems to be approximately the same.
The same type of simple transformations would appear to regularize the market bubbles in the Macrotrends chart, although I have not yet collected all the data.
In reading the literature on asset bubbles, there is a split between so-called rational bubbles, and asset bubbles triggered, in some measure, by “bounded rationality” or what economists are prone to call “irrationality.”
Examples of how “irrational” agents might proceed to fuel an asset bubble are given in a selective review of the asset bubble literature developed recently by Anna Scherbina from which I take several extracts below.
For example, there is “feedback trading” involving traders who react solely to past price movements (momentum traders?). Scherbina writes,
In response to positive news, an asset experiences a high initial return. This is noticed by a group of feedback traders who assume that the high return will continue and, therefore, buy the asset, pushing prices above fundamentals. The further price increase attracts additional feedback traders, who also buy the asset and push prices even higher, thereby attracting subsequent feedback traders, and so on. The price will keep rising as long as more capital is being invested. Once the rate of new capital inflow slows down, so does the rate of price growth; at this point, capital might start flowing out, causing the bubble to deflate.
Other mechanisms are biased self-attribution and the representativeness heuristic. In biased self-attribution,
..people to take into account signals that confirm their beliefs and dismiss as noise signals that contradict their beliefs…. Investors form their initial beliefs by receiving a noisy private signal about the value of a security.. for example, by researching the security. Subsequently, investors receive a noisy public signal…..[can be] assumed to be almost pure noise and therefore should be ignored. However, since investors suffer from biased self-attribution, they grow overconfident in their belief after the public signal confirms their private information and further revise their valuation in the direction of their private signal. When the public signal contradicts the investors’ private information, it is appropriately ignored and the price remains unchanged. Therefore, public signals, in expectation, lead to price movements in the same direction as the initial price response to the private signal. These subsequent price moves are not justified by fundamentals and represent a bubble. The bubble starts to deflate after the accumulated public signals force investors to eventually grow less confident in their private signal.
Scherbina describes the representativeness heuristic as follows.
The fourth model combines two behavioral phenomena, the representativeness heuristic and the conservatism bias. Both phenomena were previously documented in psychology and represent deviations from optimal Bayesian information processing. The representativeness heuristic leads investors to put too much weight on attention-grabbing (“strong”) news, which causes overreaction. In contrast, conservatism bias captures investors’ tendency to be too slow to revise their models, such that they underweight relevant but non-attention-grabbing (routine) evidence, which causes underreaction… In this setting, a positive bubble will arise purely by chance, for example, if a series of unexpected good outcomes have occurred, causing investors to over-extrapolate from the past trend. Investors make a mistake by ignoring the low unconditional probability that any company can grow or shrink for long periods of time. The mispricing will persist until an accumulation of signals forces investors to switch from the trending to the mean-reverting model of earnings.
Interesting, several of these “irrationalities” can generate negative, as well as positive bubbles.
Finally, Scherbina makes an important admission, namely that
The behavioral view of bubbles finds support in experimental studies. These studies set up artificial markets with finitely-lived assets and observe that price bubbles arise frequently. The presence of bubbles is often attributed to the lack of common knowledge of rationality among traders. Traders expect bubbles to arise because they believe that other traders may be irrational. Consequently, optimistic media stories and analyst reports may help create bubbles not because investors believe these views but because the optimistic stories may indicate the existence of other investors who do, destroying the common knowledge of rationality.
I dwell on these characterizations because I think it is important to put to rest the nonsensical “perfect information, perfect foresight, infinite time horizon discounting” models which litter this literature. Behavioral economics is a fresh breeze, for sure, in this context. And behavioral economics seems to me linked with the more muscular systems dynamics and complexity theory approaches to bubbles, epitomized by the work of Sornette and his coauthors.
Let me then leave you with the fundamental equation for the price dynamics of an asset bubble.
