Several distinguished macroeconomic researchers, including Ben Bernanke, highlight the predictive power of the “paper-bill” spread.
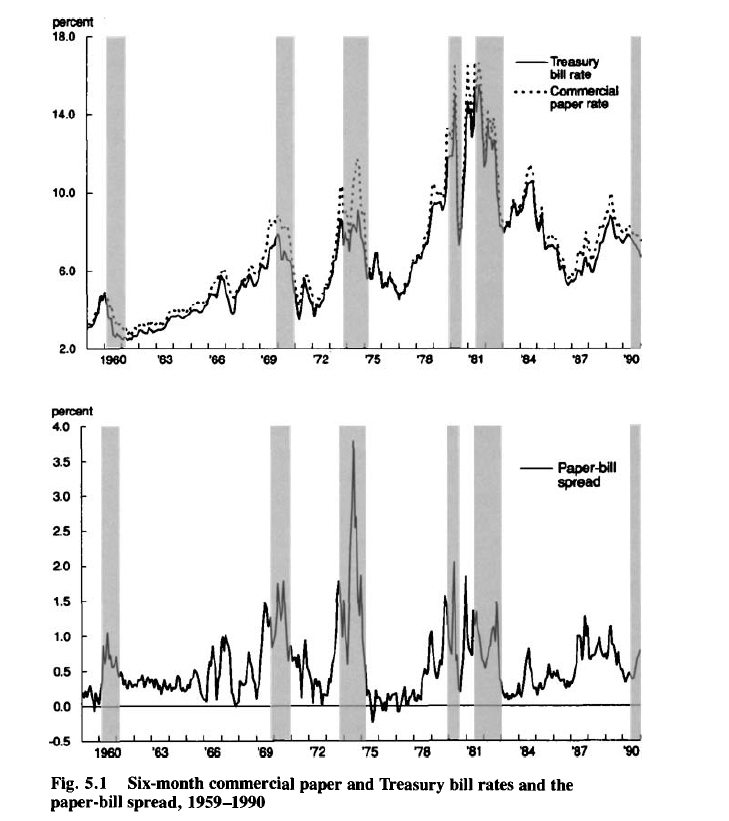
The following graphs, from a 1993 article by Benjamin M. Friedman and Kenneth N. Kuttner, show the promise of credit spreads in forecasting recessions – indicated by the shaded blocks in the charts.
Credit spreads, of course, are the differences in yields between various corporate debt instruments and government securities of comparable maturity.
The classic credit spread illustrated above is the difference between six-month commercial paper rates and 6 month Treasury bill rates.
Recent Research
More recent research underlines the importance of building up credit spreads from metrics relating to individual corporate bonds , rather than a mishmash of bonds with different duration, credit risk and other characteristics.
Credit Spreads as Predictors of Real-Time Economic Activity: A Bayesian Model-Averaging Approach is key research in this regard.
The authors first note that,
the “paper-bill” spread—the difference between yields on nonfinancial commercial paper and comparable-maturity Treasury bills—had substantial forecasting power for economic activity during the 1970s and the 1980s, but its predictive ability vanished in the subsequent decade
They then acknowledge that credit spreads based on indexes of speculative-grade or “junk” corporate bonds work fairly well for the 1990s, but their performance is uneven.
Accordingly, Faust, Gilchrist, Wright, and Zakrajsek (GYZ) write that
In part to address these problems, GYZ constructed 20 monthly credit spread indexes for different maturity and credit risk categories using secondary market prices of individual senior unsecured corporate bonds.. [measuring]..the underlying credit risk by the issuer’s expected default frequency (EDF™), a market-based default-risk indicator calculated by Moody’s/KMV that is more timely that the issuer’s credit rating]
Their findings indicate that these credit spread indexes have substantial predictive power, at both short- and longer-term horizons, for the growth of payroll employment and industrial production. Moreover, they significantly outperform the predictive ability of the standard default-risk indicators, a result that suggests that using “cleaner” measures of credit spreads may, indeed, lead to more accurate forecasts of economic activity.
Their research applies credit spreads constructed from the ground up, as it were, to out-of-sample forecasts of
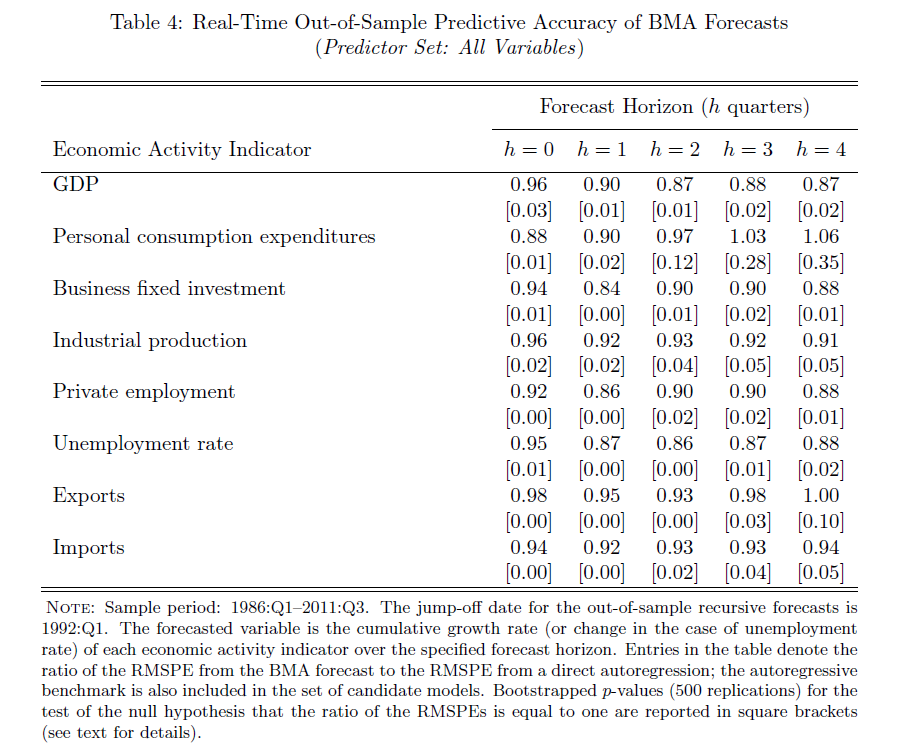
…real economic activity, as measured by real GDP, real personal consumption expenditures (PCE), real business fixed investment, industrial production, private payroll employment, the civilian unemployment rate, real exports, and real imports over the period from 1986:Q1 to 2011:Q3. All of these series are in quarter-over-quarter growth rates (actually 400 times log first differences), except for the unemployment rate, which is simply in first differences
The results are forecasts which significantly beat univariate (autoregressive) model forecass, as shown in the following table.
Here BMA is an abbreviation for Bayesian Model Averaging, the author’s method of incorporating these calculated credit spreads in predictive relationships.
Additional research validates the usefulness of credit spreads so constructed for predicting macroeconomic dynamics in several European economies –
We find that credit spreads and excess bond premiums, when used alongside monetary policy tightness indicators and leading indicators of economic performance, are highly significant for predicting the growth in the index of industrial production, employment growth, the unemployment rate and real GDP growth at horizons ranging from one quarter to two years ahead. These results are confirmed for individual countries in the euroarea and for the United Kingdom, and are robust to different measures of the credit spread. It is the unpredictable part associated with the excess bond premium that has greater influence on real activity compared to the predictable part of the credit spread. The implications of our results are that careful selection of the bonds used to construct the credit spreads, excluding those with embedded options and or illiquid secondary markets, delivers a robust indicator of financial market tightness that is distinct from tightness due to monetary policy measures or leading indicators of economic activity.
The Situation Today
A Morgan Stanley Credit Report for fixed income, released March 21, 2014, notes that
Spreads in both IG and HY are at the lowest levels we have seen since 2007, roughly 110bp for IG and 415bp for HY. A question we are commonly asked is how much tighter can spreads go in this cycle
So this is definitely something to watch.


