
A couple of months ago, I applied the stock market forecasting approach based on what I call “proximity variables” to forward-looking forecasts – as opposed to “backcasts” testing against history.
I’m surprised now that I look back at this, because I offered a forecast for 40 trading days (a little foolhardy?).
In any case, I offered forecasts for the high and low of the exchange traded fund SPY, as follows:
What about the coming period of 40 trading days, starting from this morning’s (January 22, 2015) opening price for the SPY – $203.99?
Well, subject to qualifications I will state further on here, my estimates suggest the high for the period will be in the range of $215 and the period low will be around $194. Cents attached to these forecasts would be, of course, largely spurious precision.
In my opinion, these predictions are solid enough to suggest that no stock market crash is in the cards over the next 40 trading days, nor will there be a huge correction. Things look to trade within a range not too distant from the current situation, with some likelihood of higher highs.
It sounds a little like weather forecasting.
Well, 27 trading days have transpired since January 22, 2015 – more than half the proposed 40 associated with the forecast.
How did I do?
Here is a screenshot of the Yahoo Finance table showing opening, high, low, and closing prices since January 22, 2015.
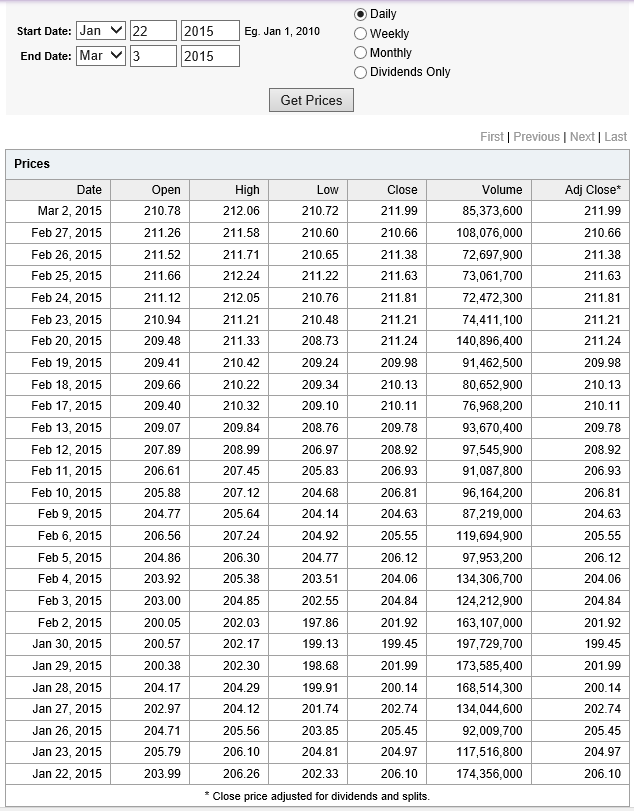
The bottom line – so far, so good. Neither the high nor low of any trading day has broached my proposed forecasts of $194 for the low and $215 for the high.
Now, I am pleased – a win just out of the gates with the new modeling approach.
However, I would caution readers seeking to use this for investment purposes. This approach recommends shorter term forecasts to focus in on the remaining days of the original forecast period. So, while I am encouraged the $215 high has not been broached, despite the hoopla about recent gains in the market, I don’t recommend taking $215 as an actual forecast at this point for the remaining 13 trading days – two or three weeks. Better forecasts are available from the model now.
“What are they?”
Well, there are a lot of moving parts in the computer programs to make these types of updates.
Still, it is interesting and relevant to forecasting practice – just how well do the models perform in real time?
So I am planning a new feature, a periodic update of stock market forecasts, with a look at how well these did. Give me a few days to get this up and running.