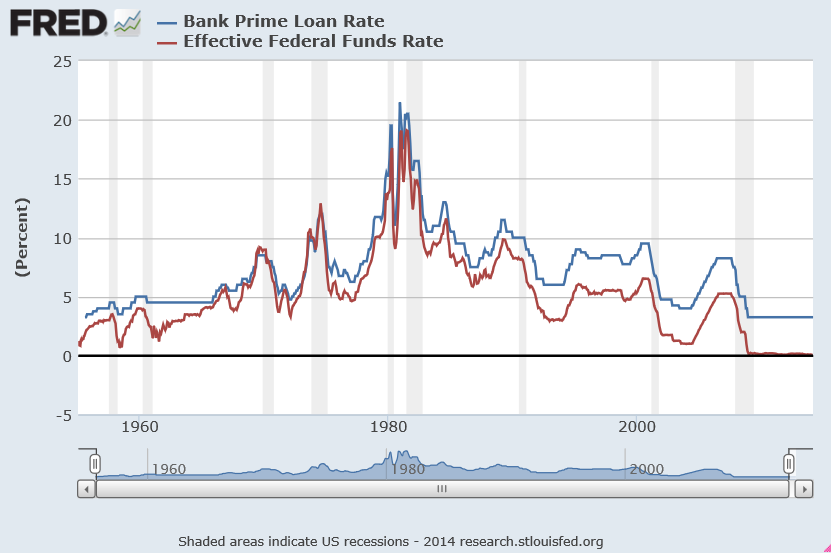
A lot relating to forecasting interest rates is encoded in the original graph I put up, several posts ago, of two major interest rate series – the federal funds and the prime rates.
This chart illustrates key features of interest rate series and signals several important questions. Thus, there is relationship between a very short term rate and a longer term interest rates – a sort of two point yield curve. Almost always, the federal funds rate is below the prime rate. If for short periods this is not the case, it indicates a radical reversion of the typical slope of the yield curve.
Credit spreads are not illustrated in this figure, but have been shown to be significant in forecasting key macroeconomic variables.
The shape of the yield curve itself can be brought into play in forecasting future rates, as can typical spreads between interest rates.
But the bottom line is that interest rates cannot be forecast with much accuracy beyond about a two quarter forecast horizon.
There is quite a bit of research showing this to be true, including –
We use individual economists’ 6-month-ahead forecasts of interest rates and exchange rates from the Wall Street Journal’s survey to test for forecast unbiasedness, accuracy, and heterogeneity. We find that a majority of economists produced unbiased forecasts but that none predicted directions of changes more accurately than chance. We find that the forecast accuracy of most of the economists is statistically indistinguishable from that of the random walk model when forecasting the Treasury bill rate but that the forecast accuracy is significantly worse for many of the forecasters for predictions of the Treasury bond rate and the exchange rate. Regressions involving deviations in economists’ forecasts from forecast averages produced evidence of systematic heterogeneity across economists, including evidence that independent economists make more radical forecasts
Then, there is research from the London School of Economics Interest Rate Forecasts: A Pathology
In this paper we have demonstrated that, in the two countries and short data periods studied, the forecasts of interest rates had little or no informational value when the horizon exceeded two quarters (six months), though they were good in the next quarter and reasonable in the second quarter out. Moreover, all the forecasts were ex post and, systematically, inefficient, underestimating (overestimating) future outturns during up (down) cycle phases. The main reason for this is that forecasters cannot predict the timing of cyclical turning points, and hence predict future developments as a convex combination of autoregressive momentum and a reversion to equilibrium
Also, the Chapter in the Handbook of Forecasting Forecasting interest rates is relevant, although highly theoretical.
Hedging Interest Rate Risk
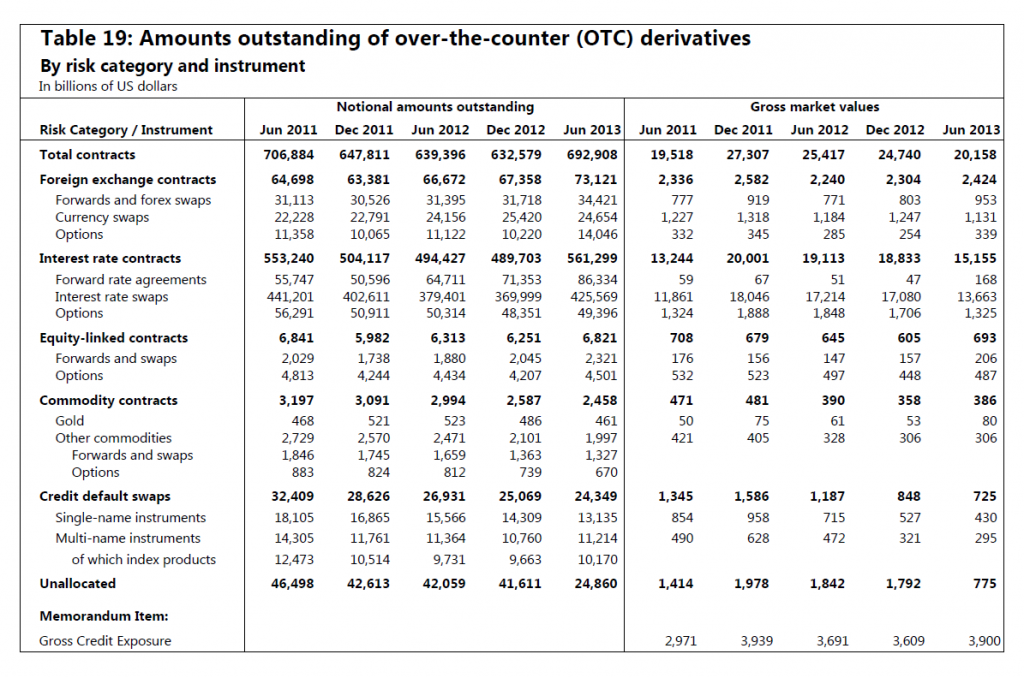
As if in validation of this basic finding – beyond about two quarters, interest rate forecasts generally do not beat a random walk forecast – interest rate swaps, are the largest category of interest rate contracts of derivatives, according to the Bank of International Settlements (BIS).
Not only that, but interest rate contracts generally are, by an order of magnitude, the largest category of OTC derivatives – totaling more than a half a quadrillion dollars as of the BIS survey in July 2013.
The gross value of these contracts was only somewhat less than the Gross Domestic Product (GDP) of the US.
A Bank of International Settlements background document defines “gross market values” as follows;
Gross positive and negative market values: Gross market values are defined as the sums of the absolute values of all open contracts with either positive or negative replacement values evaluated at market prices prevailing on the reporting date. Thus, the gross positive market value of a dealer’s outstanding contracts is the sum of the replacement values of all contracts that are in a current gain position to the reporter at current market prices (and therefore, if they were settled immediately, would represent claims on counterparties). The gross negative market value is the sum of the values of all contracts that have a negative value on the reporting date (ie those that are in a current loss position and therefore, if they were settled immediately, would represent liabilities of the dealer to its counterparties). The term “gross” indicates that contracts with positive and negative replacement values with the same counterparty are not netted. Nor are the sums of positive and negative contract values within a market risk category such as foreign exchange contracts, interest rate contracts, equities and commodities set off against one another. As stated above, gross market values supply information about the potential scale of market risk in derivatives transactions. Furthermore, gross market value at current market prices provides a measure of economic significance that is readily comparable across markets and products.
Clearly, by any account, large sums of money and considerable exposure are tied up in interest rate contracts in the over the counter (OTC) market.
A Final Thought
This link between forecastability and financial derivatives is interesting. There is no question but that, in practical terms, business is putting eggs in the basket of managing interest rate risk, as opposed to refining forecasts – which may not be possible beyond a certain point, in any case.
What is going to happen when the quantitative easing maneuvers of central banks around the world cease, as they must, and long term interest rates rise in a consistent fashion? That’s probably where to put the forecasting money.


