Why get involved with the complexity of multivariate GARCH models?
Well, because you may want to exploit systematic and persisting changes in the correlations of stocks and bonds, and other major classes of financial assets. If you know how these correlations change over, say, a forecast horizon of one month, you can do a better job of balancing risk in portfolios.
This a lively area of applied forecasting, as I discovered recently from Henry Bee of Cassia Research – based in Vancouver, British Columbia (and affiliated with CONCERT Capital Management of San Jose, California). Cassia Research provides Institutional Quant Technology for Investment Advisors.
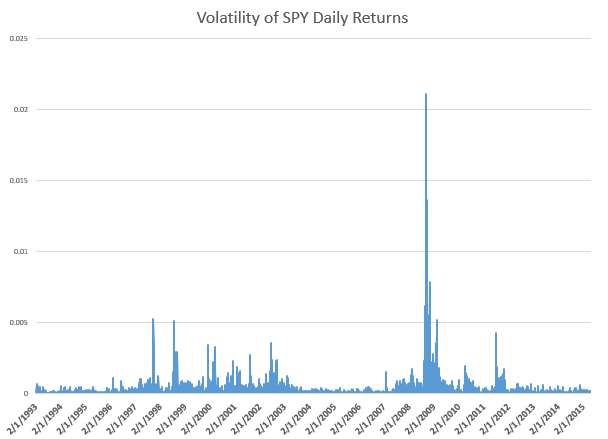
Basic Idea The key idea is that the volatility of stock prices cluster in time, and most definitely is not a random walk. Just to underline this – volatility is classically measured as the square of daily stock returns. It’s absolutely straight-forward to make a calculation and show that volatility clusters, as for example with this more than year series for the SPY exchange traded fund.
Then, if you consider a range of assets, calculating not only their daily volatilities, in terms of their own prices, but how these prices covary – you will find similar clustering of covariances.
Multivariate GARCH models provide an integrated solution for fitting and predicting these variances and covariances. For a key survey article, check out – Multivariate GARCH Models A Survey.
Some quotes from the company site provide details: We use a high-frequency multivariate GARCH model to control for volatility clustering and spillover effects, reducing drawdowns by 50% vs. historical variance. …We are able to tailor our systems to target client risk preferences and stay within their tolerance levels in any market condition…. [Dynamic Rebalancing can]..adapt quickly to market shifts and reduce drawdowns by dynamically changing rebalance frequency based on market behavior.
The COO of Cassia Research also is a younger guy – Jesse Chen. As I understand it, Jesse handles a lot of the hands-on programming for computations and is the COO.
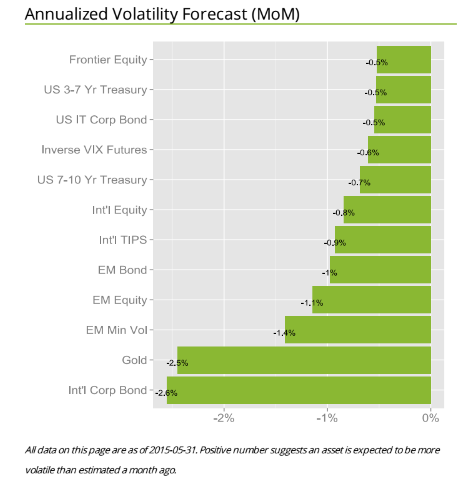
I asked Bee what he saw as the direction of stock market and investment volatility currently, and got a surprising answer. He pointed me to the following exhibit on the company site.
 The point is that for most assets considered in one of the main portfolios targeted by Cassia Research, volatilities have been dropping – as indicated by the negative signs in the chart. These are volatilities projected ahead by one month, developed by the proprietary multivariate GARCH modeling of this company – an approach which exploits intraday data for additional accuracy.
There is a wonderful 2013 article by Kirilenko and Lo called Moore’s Law versus Murphy’s Law: Algorithmic Trading and Its Discontents. Look on Google Scholar for this title and you will find a downloadable PDF file from MIT.
The Quant revolution in financial analysis is here to stay, and, if you pay attention, provides many examples of successful application of forecasting algorithms.


