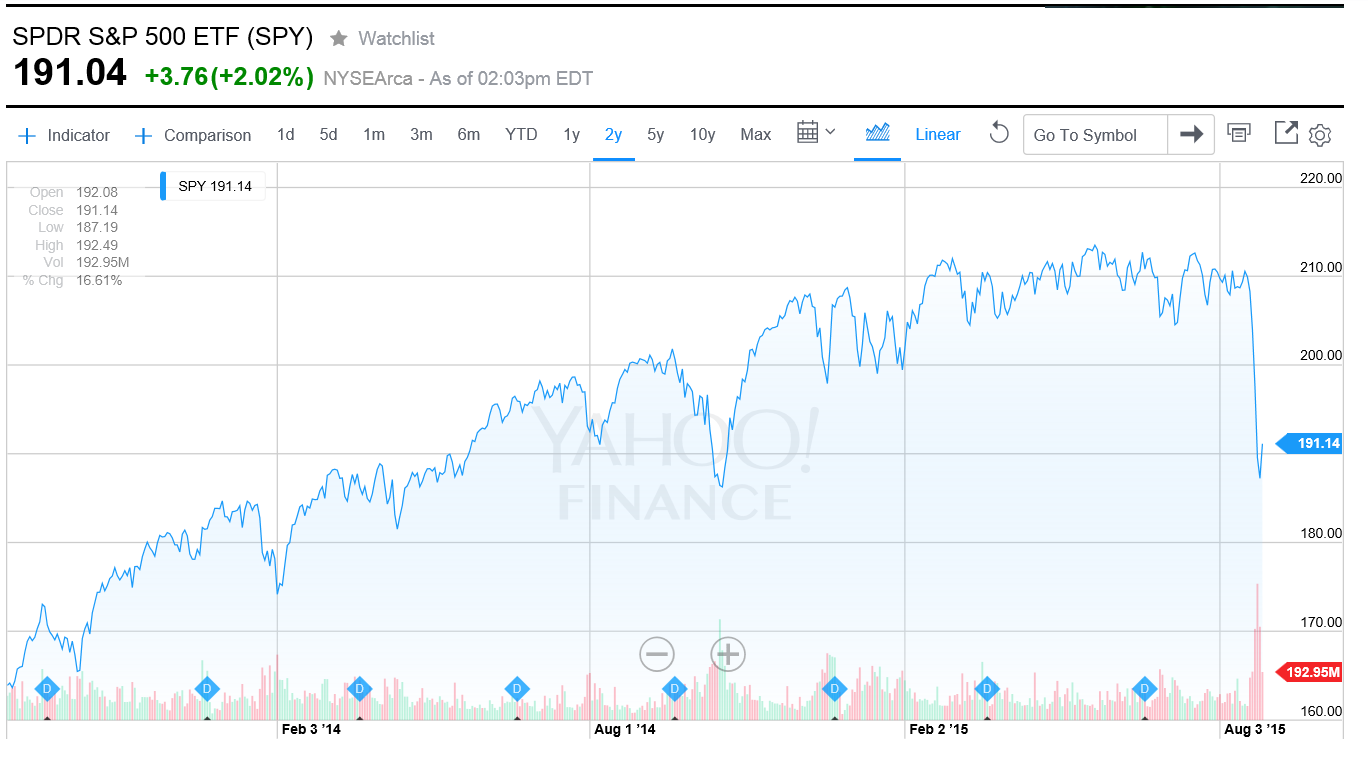
The recent drop in US stocks is dramatic, as the steep falloff of the SPY exchange traded fund (ETF) Monday, August 24th– almost the most recent action in the chart – shows.
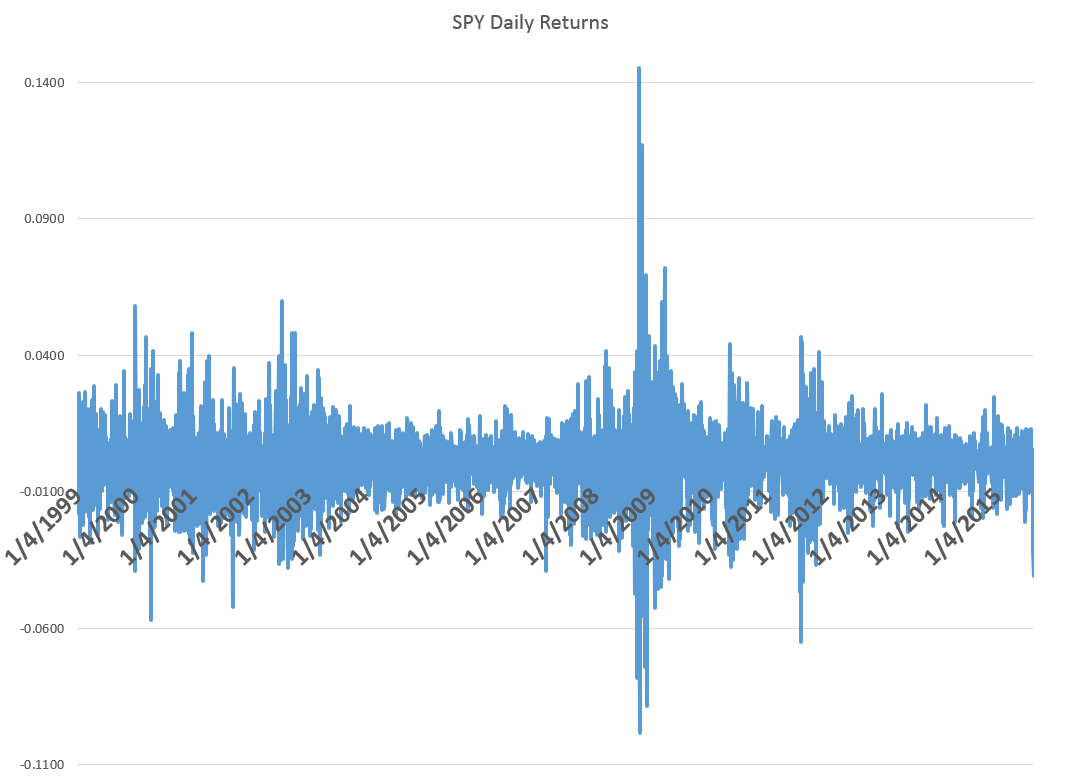
At the same time, this is by no means the steepest drop in closing prices, as the following chart of daily returns highlights.
TV commentators and others point to China and the prospective liftoff of US short term interest rates, with the Federal Reserve finally raising rates off the zero bound in – it was thought – September.
I have been impressed at the accuracy of Michael Pettis’ predictions in his China Financial Markets. Pettis has warned about a debt bubble in China for two years and consistently makes other correct calls. I have some first-hand experience doing business in China, and plan a longer post of the collapse of Chinese stock markets and the economic slowdown there.
You can imagine, if you will, a sort of global input-output table with a corresponding table of import/export flows. China has gotten a lot bigger since 2008-2009, absorbing significant amounts of the global output of iron and steel, oil, and other commodities.
Also, in 2008-2009 and in the earlier recession of 2001, China led the way to greater spending, buoying the global economy which, otherwise, was in sad shape. That’s not going to happen this time, if a real recession takes hold.
All very scary, but while the latest stuff took place, this is what I was doing.

In other words, I was the father of the groom at a splendid wedding for my younger son at the Pearl Buck estate just outside Philadelphia.
Well, that wonderful thing being done, I plan to return to more frequent posting on BusinessForecastblog.
I also apologize for having the tools to predict the current downturn, at least after developments later last week, and not signaling readers.
But frankly, I’m not sure the extreme value prediction algorithms (EVPA) reliably predict major turning points. In fact, there seem to be outside influences at key junctures. However, once a correction is underway, predictability returns. Thus, the algorithms do more than simply forecast the growth in stock prices. The EVPA also works to predict the extent of downturns.
Here’s a tip. Start watching ratios such as those between differences between the opening price in a trading day and the previous day’s high or low price, divided by the previous day’s high or low price, respectively. Very significant predictors of the change in daily highs and lows, and with significance for changes in closing prices, if you bring some data analytics to bear.