Shakespeare’s Hamlet says at one point, “There are more things Horatio, than are dreamt of in your philosophy.” This is also a worthy thought when it comes to stock market forecasts.
So here is a chart showing recent daily predictions of the midpoint (MP) of the daily price ranges for the SPY exchange traded fund (ETF), compared with the actual dollar value of the midpoint of the trading range for each day.
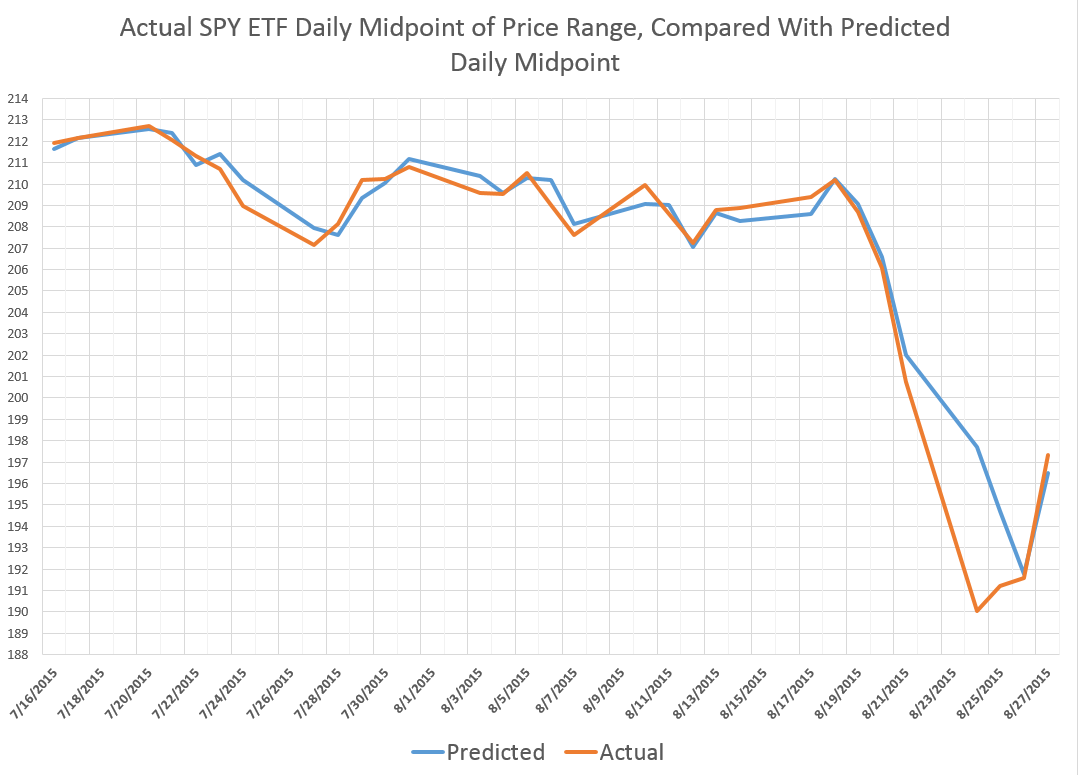
The predictions are generated by the EVPA – extreme value prediction algorithm. This is a grown-up version of the idea that ratios, like the ratio between the opening price and the previous high or low, can give us a leg up in predicting the high or low prices (or midpoint) for a trading day.
Note the EVPA is quite accurate up to recent days, when forecast errors amplify at the end of the week of August 21. In fact, in backtests to 1994, EVPA forecasts the daily MP with a mean absolute percent error (MAPE) less that 0.4%.
Here is a chart of the forecast errors corresponding to the predicted and actuals in the first chart above.
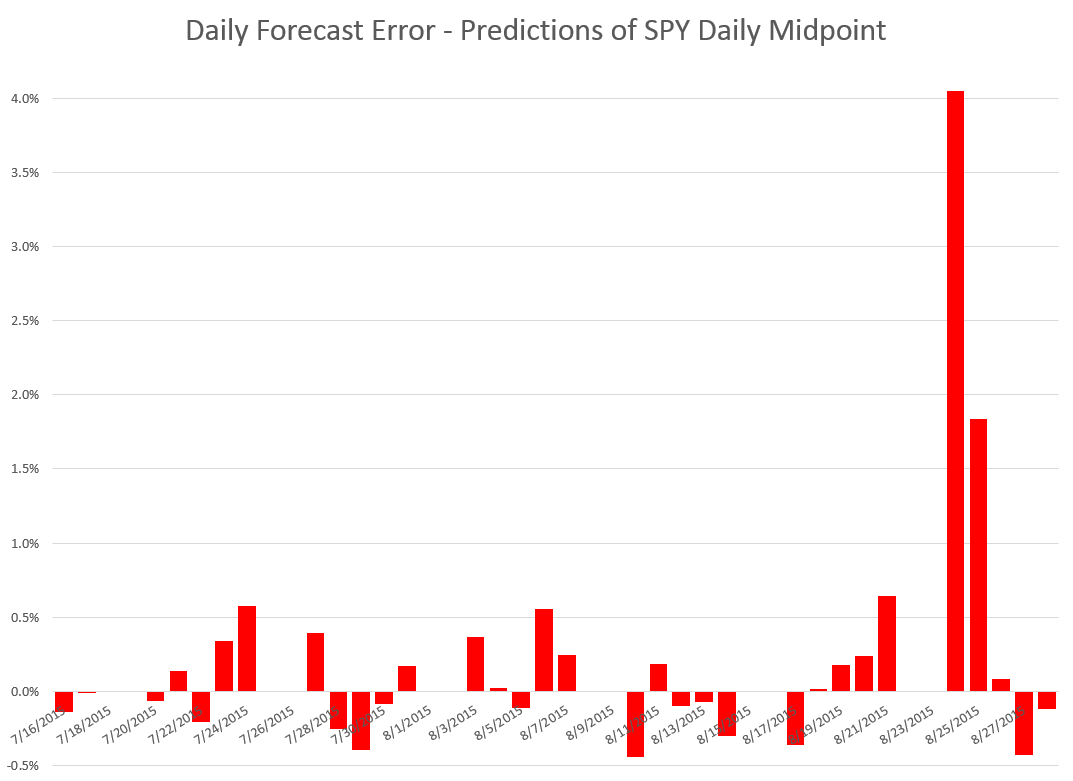
Note the apparently missing bars for some dates are just those forecasts which show such tiny errors they don’t even make it to the display, which is dominated by the forecast error August 24 at about 4 percent.
Note also, the EVPA adjusts quickly, so that by Monday August 28th – when the most dramatic drop in the midpoint (closing price, etc.) occurs – the forecasts (or backcasts) show much lower forecast error (-0.1%).
Where This Is All Going
The EVPA keys off the opening price, which this morning is listed as 198.11 – lower than Friday’s closing price of 199.24.
This should tell you that the predictions for the day are not particularly rosy, and, indeed, the EVPA forecast for the week’s MP of the trading range is almost flat, compared to the midpoint of the trading range for last week. My forecast of the MP for this week is up 0.13%.
What that means, I am not quite sure.
Here is a chart showing the performance of the weekly EVPA forecasts of the SPY MP for recent weeks.
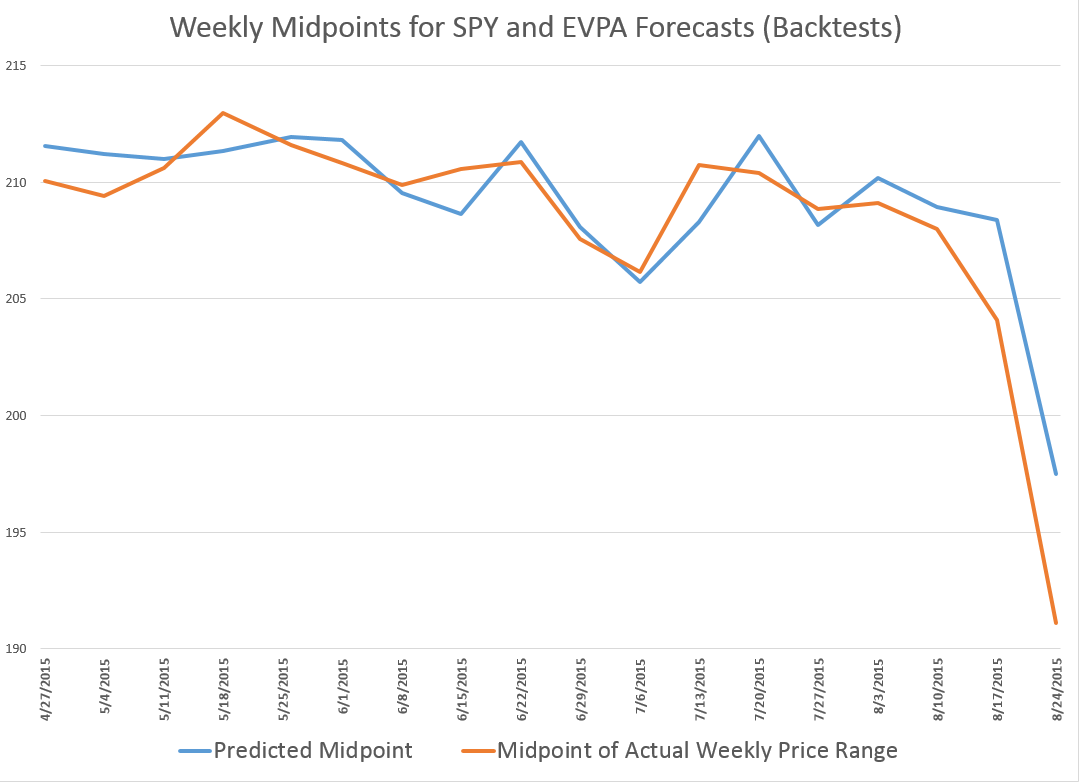
This chart does not include the forecast for the current week.
What I find really interesting is that, according to this model, the slide in the SPY might have been spotted as early as the second week in August.
The EVPA is an amazing piece of data analytics, but it exists in an environment of enormous complexity. Studies showing that various international stock markets are cointegrated, and the sense of this clearly applies to Chinese and US stock markets. Also, there is talk of pulling the punchbowl of “free money” or zero interest rates, and that seems to have a dampening effect on the trading outlook.
Quite frankly, in recent weeks I have been so absorbed in R programming, testing various approaches, and, as noted in my previous post, weddings, that I have neglected these simple series. No longer. I plan to make these two prediction series automatic with my systems.
We will see.