Last Spring I started writing about “forecasting controversies.”
A short list of these includes Google’s flu forecasting algorithm, impacts of Quantitative Easing, estimates of energy reserves in the Monterey Shale, seasonal adjustment of key series from Federal statistical agencies, and China – Trade Colossus or Assembly Site?
Well, the end of the year is a good time to revisit these, particularly if there are any late-breaking developments.
Google Flu Trends
Google Flu Trends got a lot of negative press in early 2014. A critical article in Nature – When Google got flu wrong – kicked it off. A followup Times article used the phrase “the limits of big data,” while the Guardian wrote of Big Data “hubris.”
The problem was, as the Google Trends team admits –
In the 2012/2013 season, we significantly overpredicted compared to the CDC’s reported U.S. flu levels.
Well, as of October, Google Flu Trends has a new engine. This like many of the best performing methods … in the literature—takes official CDC flu data into account as the flu season progresses.
Interestingly, the British Royal Society published an account at the end of October – Adaptive nowcasting of influenza outbreaks using Google searches – which does exactly that – merges Google Flu Trends and CDC data, achieving impressive results.
The authors develop ARIMA models using “standard automatic model selection procedures,” citing a 1998 forecasting book by Hyndman, Wheelwright, and Makridakis and a recent econometrics text by Stock and Watson. They deploy these adaptively-estimated models in nowcasting US patient visits due to influenza-like illnesses (ILI), as recorded by the US CDC.
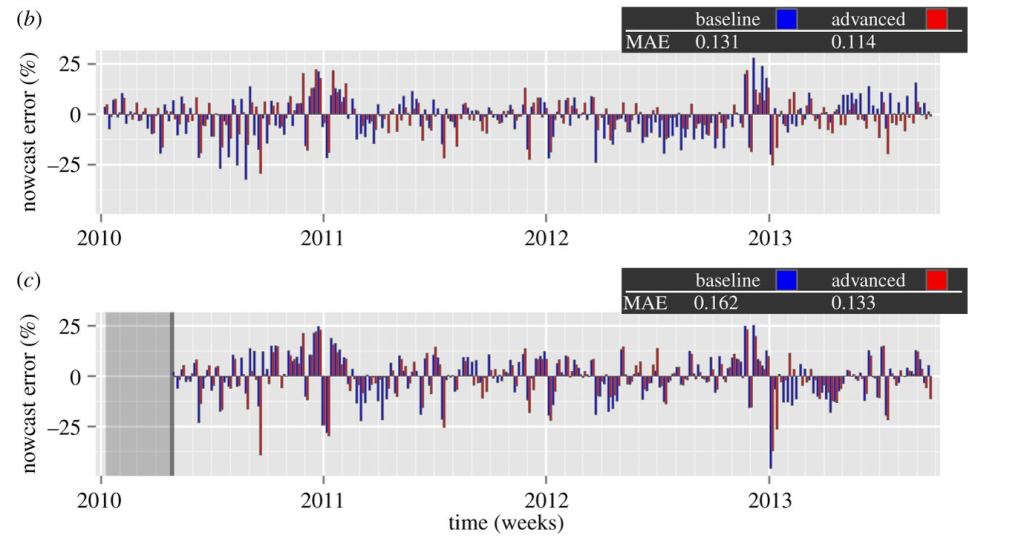
The results are shown in the following panel of charts.
Definitely click on this graphic to enlarge it, since the key point is the red bars are the forecast or nowcast models incorporating Google Flu Trends data, while the blue bars only utilize more conventional metrics, such as those supplied by the Centers for Disease Control (CDC). In many cases, the red bars are smaller than the blue bar for the corresponding date.
The lower chart labeled ( c ) documents out-of-sample performance. Mean Absolute Error (MAE) for the models with Google Flu Trends data are 17 percent lower.
It’s relevant , too, that the authors, Preis and Moat, utilize unreconstituted Google Flu Trends output – before the recent update, for example – and still get highly significant improvements.
I can think of ways to further improve this research – for example, deploy the Hyndman R programs to automatically parameterize the ARIMA models, providing a more explicit and widely tested procedural referent.
But, score one for Google and Hal Varian!
The other forecasting controversies noted above are less easily resolved, although there are developments to mention.
Stay tuned.

