Category Archives: global warming

Links, end of September

Information Technology (IT)

This is how the “Shell Shock” bug imperils the whole internet

It’s a hacker’s wet dream: a software bug discovered in the practically ubiquitous computer program known as “Bash” makes hundreds of millions of computers susceptible to hijacking. The impact of this bug is likely to be higher than that of the Heartbleed bug, which was exposed in April. The National Vulnerability Database, a US government system which tracks information security flaws, gave the bug the maximum score for “Impact” and “Exploitability,” and rated it as simple to exploit.

The bug, which has been labeled “Shell Shock” by security experts, affects computers running Unix-based operating systems like Mac OS X and Linux. That means most of the internet: according to a September survey conducted by Netcraft, a British internet services company, just 13% of the busiest one million websites use Microsoft web servers. Almost everyone else likely serves their website via a Unix operating system that probably uses Bash.

Microsoft’s Bing Predicts correctly forecasted the Scottish Independence Referendum vote

Bing Predicts was beta tested in the UK for this referendum. The prediction engine uses machine-learning models to analyse and detect patterns from a range of big data sources such as the web and social activity in order to make accurate predictions about the outcome of events.

Bing got the yes/no vote right, but missed the size of the vote to stay united with England, Wales, and Northern Ireland.

Is the profession of science broken (a possible cause of the great stagnation)? Fascinating discussion which mirrors many friends’ comments that too much time is taken up applying for and administering grants, and not enough time is left for the actual research, for unconventional ideas.

What has changed is the bureaucratic culture. The increasing interpenetration of government, university, and private firms has led everyone to adopt the language, sensibilities, and organizational forms that originated in the corporate world. Although this might have helped in creating marketable products, since that is what corporate bureaucracies are designed to do, in terms of fostering original research, the results have been catastrophic.

Climate

Climate Science Is Not Settled The Wall Street Journal piece by a former Obama adviser and BP scientist inflamed the commentariat, after publication September 16, on the eve of the big climate talks and march in New York City. See On eve of climate march, Wall Street Journal publishes call to wait and do nothing for a critical perspective.

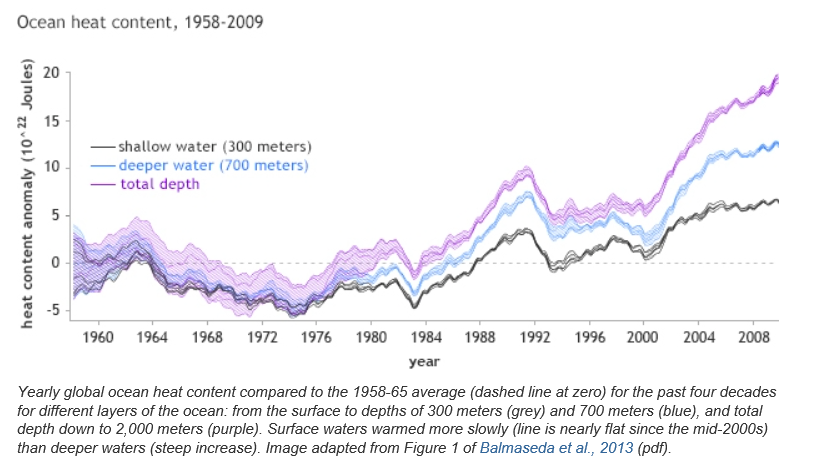
This chart, from NOAA, is one key – showing the divergence in heat stored in various layers of the oceans –

oceanheat

Nicholas Stern: The state of the climate — and what we might do about it TED talk.

Ebola

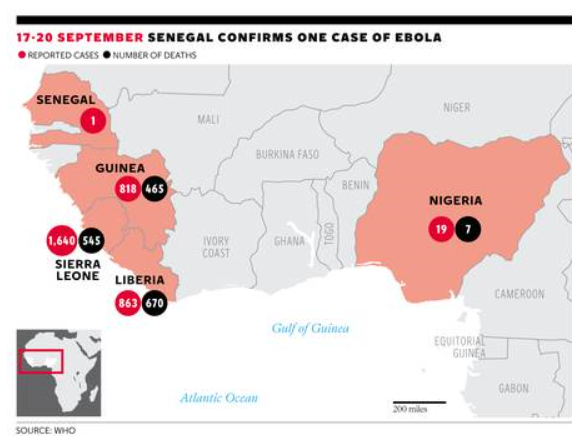
The public response to the Ebola epidemic is ramping up, but the situation is still dire and total cases and deaths are still increasing exponentially.

Ebola outbreak: Death toll passes 3,000 as WHO warns numbers are ‘vastly underestimated’

“The Ebola epidemic ravaging parts of West Africa is the most severe acute public health emergency seen in modern times.Never before in recorded history has a biosafety level four pathogen infected so many people so quickly, over such a broad geographical area, for so long.”

 ebolamap 

Global Economy

What Does a ‘Good’ Chinese Adjustment Look Like? Michael Pettis argues that what some see as a “soft landing” is in fact a preparation for later financial collapse. Instead, based on an intricate argument regarding interest rates and the nominal GDP growth rates in China, he proposes a reduction in Chinese GDP growth going forward through control of credit – in order to rebalance the Chinese consumer economy. Pettis is to my way of thinking always relevant, and often brilliant in the way he makes his analysis.

What Went Wrong? Russia Sanctions, EU, and the Way Out

Washington, Brussels and Moscow are in a vicious circle, which would spare none of them and which has potential to undermine global recovery.

Venture Capital

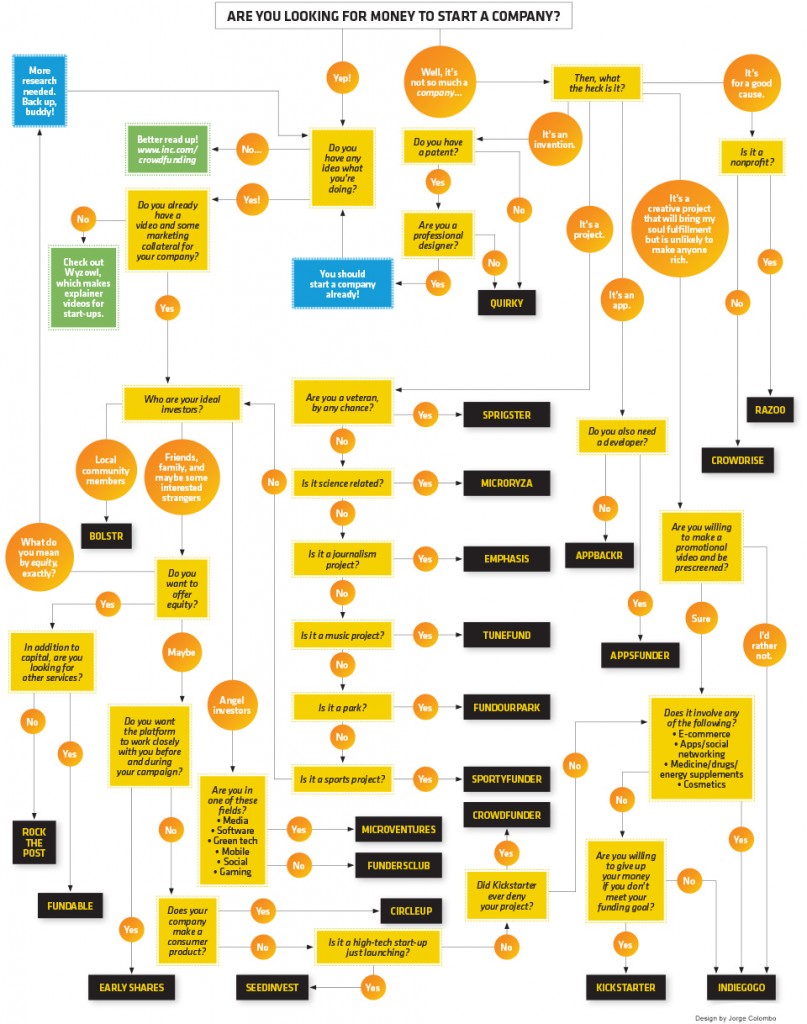
22 Crowdfunding Sites (and How To Choose Yours!)

inc-magazine-crowdfunding-infographic-june-2013_26652

Climate Change by 2030

Is climate change real? Is it predictable? How much warming can we expect by 2020 and then by 2030 in a business as usual scenario? How bad can it get? What about mitigation? Is there any credibility to the loud protestations of the climate change deniers? What about the so-called hockey stick and the exchange of sinister emails?

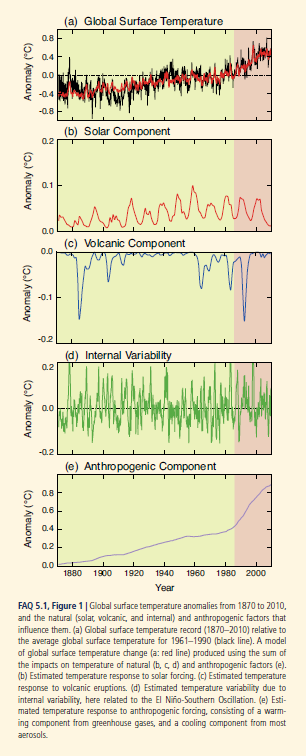
The Fifth Assessment Report of the Intergovernmental Panel on Climate Change (IPCC) addresses some of these questions. Its section The Physical Science Basis, which collates contributions of 250 scientists, contains this interesting graphic (click to enlarge) showing the upward trend in global temperature and the importance of the anthropogenic component, along with contributions from fluctuations in solar intensity and volcanic activity.

IPCCtemp

The Hockey Stick

Paleoclimate studies, also documented in this report, are the basis for the famous (notorious) hockey stick chart of long term global temperatures.

I was surprised to read, in catching up on this controversy, that the climate scientist Michael Mann who originated this chart has been totally vindicated (See The Hockey Stick: The Most Controversial Chart in Science, Explained).

Currently, scientific evidence suggests,

… present-day (2011) concentrations of the atmospheric greenhouse gases (GHGs) carbon dioxide (CO2), methane (CH4) and nitrous oxide (N2O) exceed the range of concentrations recorded in ice cores during the past 800,000 years. Past changes in atmospheric GHG concentrations can be determined with very high confidence1 from polar ice cores. Since AR4 these records have been extended from 650,000 years to 800,000 years ago.

The Drumbeat

In preparation for a September 23 summit, the UN has commissioned videos of weather forecasters supposedly announcing dire droughts, floods, and other weather catastrophes in 2050.

The IPCC also has videos. I include two – one on the physical science basis and the second on mitigation.

IPCC video 2013 –The Physical Science Basis

Climate summit 2014 – Mitigation

I personally am persuaded by the basic physics involved. As global GDP rises, so will energy consumption (although the details of this need to be examined carefully – conservation and change of technology can make big differences). In any case, more carbon dioxide and other similar gases will increase the greenhouse effect, raising global temperatures. It’s a good idea to call this climate change, rather than global warming, however, since volatility of weather patterns is a main result. There will be more climatic extremes, more droughts, but also more precipitation and flooding. Additionally, there could be changes in regional weather and climate patterns which could wreak havoc with the current distribution of population over geographic space. More rapid desertification is likely, and, of course, melting of glacial and polar ice will result in increases in sea level. And, as IPCC reports document, a lot of this is already happening.

There are, however, several problems that offer intellectual grounds for stalling the type of economic sacrifice that probably will be necessary to slow or reduce emissions.

First, there is the complexity of the evidence and argument, an issue flagged by Nate Silver recently. Secondly, there is the problem that, despite increases in greenhouse gas emissions after the turn of the century, there has been some leveling of global temperature increase, according to some metrics. Finally, there is the related problem of whether current climate models predict the recent past, whether they “retrodict.”

I’d like to address these issues or problems in a future post, along with my take on these projections or forecasts for 2020 and 2030.

LInks – late May

US and Global Economic Prospects

Goldman’s Hatzius: Rationale for Economic Acceleration Is Intact

We currently estimate that real GDP fell -0.7% (annualized) in the first quarter, versus a December consensus estimate of +2½%. On the face of it, this is a large disappointment. It raises the question whether 2014 will be yet another year when initially high hopes for growth are ultimately dashed.

 Today we therefore ask whether our forecast that 2014-2015 will show a meaningful pickup in growth relative to the first four years of the recovery is still on track. Our answer, broadly, is yes. Although the weak first quarter is likely to hold down real GDP for 2014 as a whole, the underlying trends in economic activity are still pointing to significant improvement….

 The basic rationale for our acceleration forecast of late 2013 was twofold—(1) an end to the fiscal drag that had weighed on growth so heavily in 2013 and (2) a positive impulse from the private sector following the completion of the balance sheet adjustments specifically among US households. Both of these points remain intact.

Economy and Housing Market Projected to Grow in 2015

Despite many beginning-of-the-year predictions about spring growth in the housing market falling flat, and despite a still chugging economy that changes its mind quarter-to-quarter, economists at the National Association of Realtors and other industry groups expect an uptick in the economy and housing market through next year.

The key to the NAR’s optimism, as expressed by the organization’s chief economist, Lawrence Yun, earlier this week, is a hefty pent-up demand for houses coupled with expectations of job growth—which itself has been more feeble than anticipated. “When you look at the jobs-to-population ratio, the current period is weaker than it was from the late 1990s through 2007,” Yun said. “This explains why Main Street America does not fully feel the recovery.”

Yun’s comments echo those in a report released Thursday by Fitch Ratings and Oxford Analytica that looks at the unusual pattern of recovery the U.S. is facing in the wake of its latest major recession. However, although the U.S. GDP and overall economy have occasionally fluctuated quarter-to-quarter these past few years, Yun said that there are no fresh signs of recession for Q2, which could grow about 3 percent.

Report: San Francisco has worse income inequality than Rwanda

If San Francisco was a country, it would rank as the 20th most unequal nation on Earth, according to the World Bank’s measurements.

Googlebus

Climate Change

When Will Coastal Property Values Crash And Will Climate Science Deniers Be The Only Buyers?

sea

How Much Will It Cost to Solve Climate Change?

Switching from fossil fuels to low-carbon sources of energy will cost $44 trillion between now and 2050, according to a report released this week by the International Energy Agency.

Natural Gas and Fracking

How The Russia-China Gas Deal Hurts U.S. Liquid Natural Gas Industry

This could dampen the demand – and ultimately the price for – LNG from the United States. East Asia represents the most prized market for producers of LNG. That’s because it is home to the top three importers of LNG in the world: Japan, South Korea and China. Together, the three countries account for more than half of LNG demand worldwide. As a result, prices for LNG are as much as four to five times higher in Asia compared to what natural gas is sold for in the United States.

The Russia-China deal may change that.

If LNG prices in Asia come down from their recent highs, the most expensive LNG projects may no longer be profitable. That could force out several of the U.S. LNG projects waiting for U.S. Department of Energy approval. As of April, DOE had approved seven LNG terminals, but many more are waiting for permits.

LNG terminals in the United States will also not be the least expensive producers. The construction of several liquefaction facilities in Australia is way ahead of competitors in the U.S., and the country plans on nearly quadrupling its LNG capacity by 2017. More supplies and lower-than-expected demand from China could bring down prices over the next several years.

Write-down of two-thirds of US shale oil explodes fracking mythThis is big!

Next month, the US Energy Information Administration (EIA) will publish a new estimate of US shale deposits set to deal a death-blow to industry hype about a new golden era of US energy independence by fracking unconventional oil and gas.

EIA officials told the Los Angeles Times that previous estimates of recoverable oil in the Monterey shale reserves in California of about 15.4 billion barrels were vastly overstated. The revised estimate, they said, will slash this amount by 96% to a puny 600 million barrels of oil.

The Monterey formation, previously believed to contain more than double the amount of oil estimated at the Bakken shale in North Dakota, and five times larger than the Eagle Ford shale in South Texas, was slated to add up to 2.8 million jobs by 2020 and boost government tax revenues by $24.6 billion a year.

China

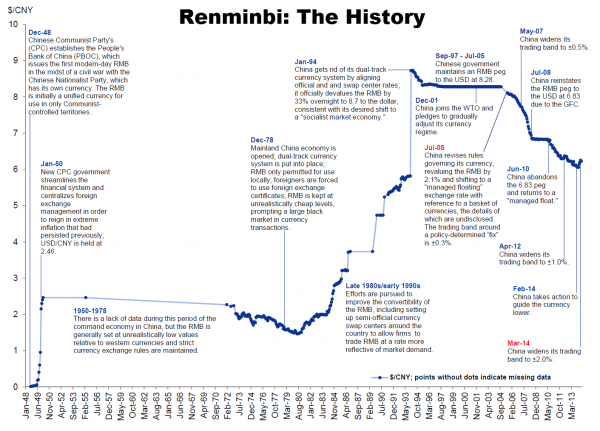
The Annotated History Of The World’s Next Reserve Currency
yuanhistory

Goldman: Prepare for Chinese property bust

…With demand poised to slow given a tepid economic backdrop, weaker household affordability, rising mortgage rates and developer cash flow weakness, we believe current construction capacity of the domestic property industry may be excessive. We estimate an inventory adjustment cycle of two years for developers, driving 10%-15% price cuts in most cities with 15% volume contraction from 2013 levels in 2014E-15E. We also expect M&A activities to take place actively, favoring developers with strong balance sheet and cash flow discipline.

China’s Shadow Banking Sector Valued At 80% of GDP

The China Banking Regulatory Commission has shed light on the country’s opaque shadow banking sector. It was as large as 33 trillion yuan ($5.29 trillion) in mid-2013 and equivalent to 80% of last year’s GDP, according to Yan Qingmin, a vice chairman of the commission.

In a Tuesday WeChat blog sent by the Chong Yang Institute for Financial Studies, Renmin University, Yan wrote that his calculation is based on shadow lending activities from asset management businesses to trust companies, a definition he said was very broad.  Yan said the rapid expansion of the sector, which was equivalent to 53% of GDP in 2012, entailed risks of some parts of the shadow banking business, but not necessarily the Chinese economy.

Yan’s estimation is notably higher than that of the Chinese Academy of Social Sciences. The government think tank said on May 9 that the sector has reached 27 trillion yuan ($4.4 trillion in 2013) and is equivalent to nearly one fifth of the domestic banking sector’s total assets.

Massive, Curvaceous Buildings Designed to Imitate a Mountain Forest

Chinamassive

Information Technology (IT)

I am an IT generalist. Am I doomed to low pay forever? Interesting comments and suggestions to this question on a Forum maintained by The Register.

I’m an IT generalist. I know a bit of everything – I can behave appropriately up to Cxx level both internally and with clients, and I’m happy to crawl under a desk to plug in network cables. I know a little bit about how nearly everything works – enough to fill in the gaps quickly: I didn’t know any C# a year ago, but 2 days into a project using it I could see the offshore guys were writing absolute rubbish. I can talk to DB folks about their DBs; network guys about their switches and wireless networks; programmers about their code and architects about their designs. Don’t get me wrong, I can do as well as talk, programming, design, architecture – but I would never claim to be the equal of a specialist (although some of the work I have seen from the soi-disant specialists makes me wonder whether I’m missing a trick).

My principle skill, if there is one – is problem resolution, from nitty gritty tech details (performance and functionality) to handling tricky internal politics to detoxify projects and get them moving again.

How on earth do I sell this to an employer as a full-timer or contractor? Am I doomed to a low income role whilst the specialists command the big day rates? Or should I give up on IT altogether

Crowdfunding is brutal… even when it works

China bans Windows 8

China has banned government use of Windows 8, Microsoft Corp’s latest operating system, a blow to a US technology company that has long struggled with sales in the country.

The Central Government Procurement Center issued the ban on installing Windows 8 on Chinese government computers as part of a notice on the use of energy-saving products, posted on its website last week.

Data Analytics

Statistics of election irregularities – good forensic data analytics.

Predicting the Hurricane Season

I’ve been focusing recently on climate change and extreme weather events, such as hurricanes and tornados. This focus is interesting in its own right, offering significant challenges to data analysis and predictive analytics, and I also see strong parallels to economic forecasting.

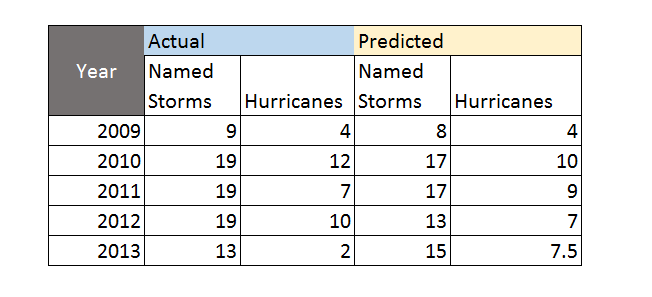
The Florida State University Center for Ocean-Atmospheric Prediction Studies (COAPS) garnered good press 2009-2012, for its accurate calls on the number of hurricanes and named tropical storms in the North Atlantic. Last year was another story, however, and it’s interesting to explore why 2013 was so unusual – there being only two (2) hurricanes and no major hurricanes over the whole season.

Here’s the track record for COAPS, since it launched its new service.

Hurricaneforecastaccuracy

The forecast for 2013 was a major embarrassment, inasmuch as the Press Release at the beginning of June 2013 predicted an “above-average season.”

Tim LaRow, associate research scientist at COAPS, and his colleagues released their fifth annual Atlantic hurricane season forecast today. Hurricane season begins June 1 and runs through Nov. 30.

This year’s forecast calls for a 70 percent probability of 12 to 17 named storms with five to 10 of the storms developing into hurricanes. The mean forecast is 15 named storms, eight of them hurricanes, and an average accumulated cyclone energy (a measure of the strength and duration of storms accumulated during the season) of 135.

“The forecast mean numbers are identical to the observed 1995 to 2010 average named storms and hurricanes and reflect the ongoing period of heightened tropical activity in the North Atlantic,” LaRow said.

The COAPS forecast is slightly less than the official National Oceanic and Atmospheric Administration (NOAA) forecast that predicts a 70 percent probability of 13 to 20 named storms with seven to 11 of those developing into hurricanes this season…

What Happened?

Hurricane forecaster Gary Bell is quoted as saying,

“A combination of conditions acted to offset several climate patterns that historically have produced active hurricane seasons,” said Gerry Bell, Ph.D., lead seasonal hurricane forecaster at NOAA’s Climate Prediction Center, a division of the National Weather Service. “As a result, we did not see the large numbers of hurricanes that typically accompany these climate patterns.”

More informatively,

Forecasters say that three main features loom large for the inactivity: large areas of sinking air, frequent plumes of dry, dusty air coming off the Sahara Desert, and above-average wind shear. None of those features were part of their initial calculations in making seasonal projections. Researchers are now looking into whether they can be predicted in advance like other variables, such as El Niño and La Niña events.

I think it’s interesting NOAA stuck to its “above-normal season” forecast as late as August 2013, narrowing the numbers only a little. At the same time, neutral conditions with respect to la Nina and el Nino in the Pacific were acknowledged as influencing the forecasts. The upshot – the 2013 hurricane season in the North Atlantic was the 7th quietest in 70 years.

Risk Behaviors and Extreme Events

Apparently, it’s been more than 8 years since a category 3 hurricane hit the mainland of the US. This is chilling, inasmuch as Sandy, which caused near-record damage on the East Coast, was only a category 1 when it made landfall in New Jersey in 2012.

Many studies highlight a “ratchet pattern” in risk behaviors following extreme weather, such as a flood or hurricane. Initially, after the devastation, people engage in lots of protective, pre-emptive behavior. Typically, flood insurance coverage shoots up, only to gradually fall off, when further flooding has not been seen for a decade or more.

Similarly, after a volcanic eruption, in Indonesia, for example, and destruction of fields and villages by lava flows or ash – people take some time before they re-claim those areas. After long enough, these events can give rise to rich soils, supporting high crop yields. So since the volcano has not erupted for, say, decades or a century, people move back and build even more intensively than before.

This suggests parallels with economic crisis and its impacts, and measures taken to make sure “it never happens again.”

I also see parallels between weather and economic forecasting.

Maybe there is a chaotic element in economic dynamics, just as there almost assuredly is in weather phenomena.

Certainly, the curse of dimension in forecasting models translates well from weather to economic forecasting. Indeed, a major review of macroeconomic forecasting, especially of its ability to predict recessions, concludes that economic models are always “fighting the last war,” in the sense that new factors seem to emerge and take control during every major economic crises. Things do not repeat themselves exactly. So, if the “true” recession forecasting model has legitimately 100 drivers or explanatory variables, it takes a long historic record to sort out the separate influences of these – and the underlying technological basis of the economy is changing all the time.

Climate Gotterdammerung

For video fans, here are three videos on climate change and global warming. Be sure and see the third – it’s very dramatic.

White House smacks down climate deniers in new video

“If you’ve been hearing that extreme cold spells like the one that we’re having in the United States now disprove global warming, don’t believe it,” Holdren [White House Science Advisor] says in the video, before launching into a succinct explanation of how uneven global temperature changes are destabilizing the polar vortex and making it “wavier.”

“The waviness means that there can be increased, larger excursions of wintertime cold air southward,” Holdren says. He adds that “increased excursions of relatively warmer” air can also move into the “far north” as the globe warms.

NASA Graphic Shows Six Terrifying Decades Of Global Warming (VIDEO)

Largest Glacier Calving Ever Filmed

This is from “Chasing Ice.” James Balog, the National Geographic photographer, speaks at the end of the film, and his assistants, are staked out on a high ridge above all this and took the videos.

Some of shards of ice are three times taller than the skyscrapers in Lower Manhattan – a comparable area to the breakup zone.