Category Archives: IT market analysis

e-commerce and Forecasting

The Census Bureau announced numbers from its latest e-commerce survey August 15.

The basic pattern continues. US retail e-commerce sales increased about 16 percent on a year-over-year basis from the second quarter of 2013. By comparison, total retail sales for the second quarter 2014 increased just short of 5 percent on a year-over-year basis.

 ecommercepercent

As with other government statistics relating to IT (information technology), one can quarrel with the numbers (they may, for example, be low), but there is impressive growth no matter how you cut it.

Some of the top e-retailers from the standpoint of clicks and sales numbers are listed in Panagiotelis et al. Note these are sample data, from comScore with the totals for each company or site representing a small fraction of their actual 2007 online sales.

eretailers

Forecasting Issues

Forecasting issues related to e-commerce run the gamut.

Website optimization and target marketing raise questions such as the profitability of “stickiness” to e-commerce retailers. There are advanced methods to tease out nonlinear, nonnormal multivariate relationships between, say, duration and page views and the decision to purchase – such as copulas previously applied in financial risk assessment and health studies.

Mobile e-commerce is a rapidly growing area with special platform and communications characteristics all its own.

Then, there are the pros and cons of expanding tax collection for online sales.

All in all, Darrell Rigby’s article in the Harvard Business Review – The Future of Shopping – is hard to beat. Traditional retailers generally have to move to a multi-channel model, supplementing brick-and-mortar stores with online services.

I plan several posts on these questions and issues, and am open for your questions.

Top graphic by DIGISECRETS

Links early August 2014

Economy/Business

Economists React to July’s Jobs Report: ‘Not Weak, But…’

U.S. nonfarm employers added 209,000 jobs in July, slightly below forecasts and slower than earlier gains, while the unemployment rate ticked up to 6.2% from June. But employers have now added 200,000 or more jobs in six consecutive months for the first time since 1997.

The most important charts to see before the huge July jobs report – interesting to see what analysts were looking at just before the jobs announcement.

Despite sharp selloff, too early to worry about a correction

Venture Capital: Deals Beyond the Valley

7 Most Expensive Luxury Cars

BMW

Base price $136,000.

Contango And Backwardation Strategy For VIX ETFs Here you go!

Climate/Weather

Horrid California Drought Gets Worse Has a map showing drought conditions at intervals since 2011, dramatic.

IT

Amazon’s Cloud Is Growing So Fast It’s Scaring Shareholders

Amazon has pulled off a pretty amazing trick over the past decade. It’s invented and then built a nearly $5 billion cloud computing business catering to fickle software developers and put the rest of the technology industry on the defensive. Big enterprise software companies such as IBM and HP and even Google are playing catchup, even as they acknowledge that cloud computing is the tech industry’s future.

But what kind of a future is that to be? Yesterday Amazon said that while its cloud business grew by 90 percent last year, it was significantly less profitable. Amazon’s AWS cloud business makes up the majority of a balance sheet item it labels as “other” (along with its credit card and advertising revenue) and that revenue from that line of business grew by 38 percent. Last quarter, revenue grew by 60 percent. In other words, Amazon is piling on customers faster than it’s adding dollars to its bottom line.

The Current Threat

Infographic: Ebola By the Numbers

ebola

Data Science

Statistical inference in massive data sets Interesting and applicable procedure illustrated with Internet traffic numbers.

The NASDAQ 100 Daily Returns and Laplace Distributed Errors

I once ran into Norman Mailer at the Museum of Modern Art in Manhattan. We were both looking at Picasso’s “Blue Boy” and, recognizing him, I started up some kind of conversation, and Mailer was quite civil about the whole thing.

I mention this because I always associate Mailer with his collection Advertisements for Myself.

And that segues – loosely – into my wish to let you know that, in fact, I developed a generalization of the law of demand for the situation in which a commodity is sold at a schedule of rates and fees, instead of a uniform price. That was in 1987, when I was still a struggling academic and beginning a career in business consulting.

OK, and that relates to a point I want to suggest here. And that is that minor players can have big ideas.

So I recognize an element of “hubris” in suggesting that the error process of S&P 500 daily returns – up to certain transformations – is described by a Laplace distribution.

What about other stock market indexes, then? This morning, I woke up and wondered whether the same thing is true for, say, the NASDAQ 100.

NASDAQ100

So I downloaded daily closing prices for the NASDAQ 100 from Yahoo Finance dating back to October 1, 1985. Then, I took the natural log of each of these closing prices. After that, I took trading day by trading day differences. So the series I am analyzing comes from the first differences of the natural log of the NASDAQ 100 daily closing prices.

Note that this series of first differences is sometimes cast into a histogram by itself – and this also frequently is a “pointy peaked” relatively symmetric distribution. You could motivate this graph with the idea that stock prices are a random walk. So if you take first differences, you get the random component that generates the random walk.

I am troubled, however, by the fact that this component has considerable structure in and of itself. So I undertake further analysis.

For example, the autocorrelation function of these first differences of the log of NASDAQ 100 daily closing prices looks like this.

NASDAQAC

Now if you calculate bivariate regressions on these first differences and their lagged values, many of them produce coefficient estimates with t-statistics that exceed the magic value of 2.

Just selecting these significant regressors from the first 47 lags produces this regression equation, I get this equation.

Regression

Now this regression is estimated over all 7200 observations from October 1 1984 to almost right now.

Graphing the residuals, I get the familiar pointy-peaked distribution that we saw with the S&P 500.

LaplaceNASDAQ100

Here is a fit of the Laplace distribution to this curve (Again using EasyFit).

EFLNQ

Here are the metrics for this fit and fits to a number of other probability distributions from this program.

EFtable

I have never seen as clear a linkage of returns from stock indexes and the Laplace distribution (maybe with a slight asymmetry – there are also asymmetric Laplace distributions).

One thing is for sure – the distribution above for the NASDAQ 100 data and the earlier distribution developed for the S&P 500 are not close to be normally distributed. Thus, in the table above that the normal distribution is number 12 on the list of possible candidates identified by EasyFit.

Note “Error” listed in the above table, is not the error function related to the normal distribution. Instead it is another exponential distribution with an absolute value in the exponent like the Laplace distribution. In fact, it looks like a transformation of the Laplace, but I need to do further investigation. In any case, it’s listed as number 2, even though the metrics show the same numbers.

The plot thickens.

Obviously, the next step is to investigate individual stocks with respect to Laplacian errors in this type of transformation.

Also, some people will be interested in whether the autoregressive relationship listed above makes money under the right trading rules. I will report further on that.

Anyway, thanks for your attention. If you have gotten this far – you believe numbers have power. Or you maybe are interested in finance and realize that indirect approaches may be the best shot at getting to something fundamental.

LInks – late May

US and Global Economic Prospects

Goldman’s Hatzius: Rationale for Economic Acceleration Is Intact

We currently estimate that real GDP fell -0.7% (annualized) in the first quarter, versus a December consensus estimate of +2½%. On the face of it, this is a large disappointment. It raises the question whether 2014 will be yet another year when initially high hopes for growth are ultimately dashed.

 Today we therefore ask whether our forecast that 2014-2015 will show a meaningful pickup in growth relative to the first four years of the recovery is still on track. Our answer, broadly, is yes. Although the weak first quarter is likely to hold down real GDP for 2014 as a whole, the underlying trends in economic activity are still pointing to significant improvement….

 The basic rationale for our acceleration forecast of late 2013 was twofold—(1) an end to the fiscal drag that had weighed on growth so heavily in 2013 and (2) a positive impulse from the private sector following the completion of the balance sheet adjustments specifically among US households. Both of these points remain intact.

Economy and Housing Market Projected to Grow in 2015

Despite many beginning-of-the-year predictions about spring growth in the housing market falling flat, and despite a still chugging economy that changes its mind quarter-to-quarter, economists at the National Association of Realtors and other industry groups expect an uptick in the economy and housing market through next year.

The key to the NAR’s optimism, as expressed by the organization’s chief economist, Lawrence Yun, earlier this week, is a hefty pent-up demand for houses coupled with expectations of job growth—which itself has been more feeble than anticipated. “When you look at the jobs-to-population ratio, the current period is weaker than it was from the late 1990s through 2007,” Yun said. “This explains why Main Street America does not fully feel the recovery.”

Yun’s comments echo those in a report released Thursday by Fitch Ratings and Oxford Analytica that looks at the unusual pattern of recovery the U.S. is facing in the wake of its latest major recession. However, although the U.S. GDP and overall economy have occasionally fluctuated quarter-to-quarter these past few years, Yun said that there are no fresh signs of recession for Q2, which could grow about 3 percent.

Report: San Francisco has worse income inequality than Rwanda

If San Francisco was a country, it would rank as the 20th most unequal nation on Earth, according to the World Bank’s measurements.
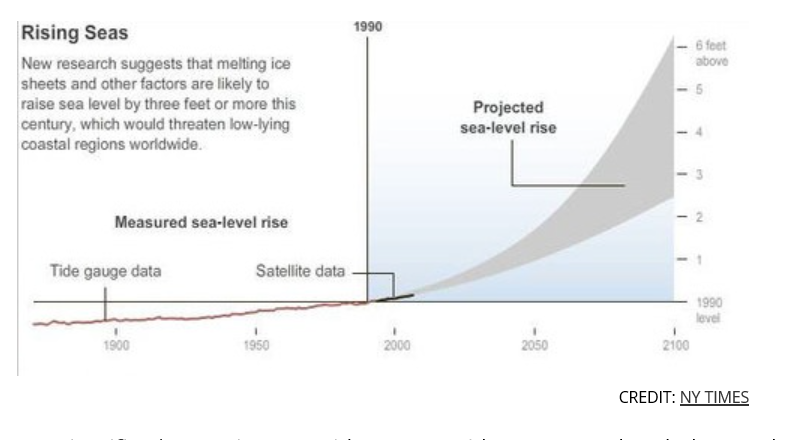
Googlebus

Climate Change

When Will Coastal Property Values Crash And Will Climate Science Deniers Be The Only Buyers?

sea

How Much Will It Cost to Solve Climate Change?

Switching from fossil fuels to low-carbon sources of energy will cost $44 trillion between now and 2050, according to a report released this week by the International Energy Agency.

Natural Gas and Fracking

How The Russia-China Gas Deal Hurts U.S. Liquid Natural Gas Industry

This could dampen the demand – and ultimately the price for – LNG from the United States. East Asia represents the most prized market for producers of LNG. That’s because it is home to the top three importers of LNG in the world: Japan, South Korea and China. Together, the three countries account for more than half of LNG demand worldwide. As a result, prices for LNG are as much as four to five times higher in Asia compared to what natural gas is sold for in the United States.

The Russia-China deal may change that.

If LNG prices in Asia come down from their recent highs, the most expensive LNG projects may no longer be profitable. That could force out several of the U.S. LNG projects waiting for U.S. Department of Energy approval. As of April, DOE had approved seven LNG terminals, but many more are waiting for permits.

LNG terminals in the United States will also not be the least expensive producers. The construction of several liquefaction facilities in Australia is way ahead of competitors in the U.S., and the country plans on nearly quadrupling its LNG capacity by 2017. More supplies and lower-than-expected demand from China could bring down prices over the next several years.

Write-down of two-thirds of US shale oil explodes fracking mythThis is big!

Next month, the US Energy Information Administration (EIA) will publish a new estimate of US shale deposits set to deal a death-blow to industry hype about a new golden era of US energy independence by fracking unconventional oil and gas.

EIA officials told the Los Angeles Times that previous estimates of recoverable oil in the Monterey shale reserves in California of about 15.4 billion barrels were vastly overstated. The revised estimate, they said, will slash this amount by 96% to a puny 600 million barrels of oil.

The Monterey formation, previously believed to contain more than double the amount of oil estimated at the Bakken shale in North Dakota, and five times larger than the Eagle Ford shale in South Texas, was slated to add up to 2.8 million jobs by 2020 and boost government tax revenues by $24.6 billion a year.

China

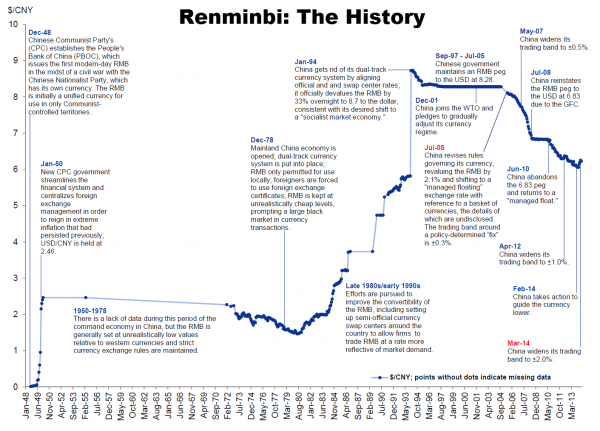
The Annotated History Of The World’s Next Reserve Currency

yuanhistory

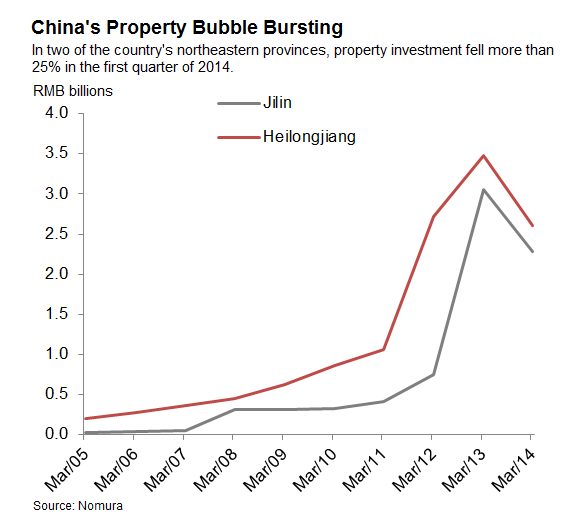
Goldman: Prepare for Chinese property bust

…With demand poised to slow given a tepid economic backdrop, weaker household affordability, rising mortgage rates and developer cash flow weakness, we believe current construction capacity of the domestic property industry may be excessive. We estimate an inventory adjustment cycle of two years for developers, driving 10%-15% price cuts in most cities with 15% volume contraction from 2013 levels in 2014E-15E. We also expect M&A activities to take place actively, favoring developers with strong balance sheet and cash flow discipline.

China’s Shadow Banking Sector Valued At 80% of GDP

The China Banking Regulatory Commission has shed light on the country’s opaque shadow banking sector. It was as large as 33 trillion yuan ($5.29 trillion) in mid-2013 and equivalent to 80% of last year’s GDP, according to Yan Qingmin, a vice chairman of the commission.

In a Tuesday WeChat blog sent by the Chong Yang Institute for Financial Studies, Renmin University, Yan wrote that his calculation is based on shadow lending activities from asset management businesses to trust companies, a definition he said was very broad.  Yan said the rapid expansion of the sector, which was equivalent to 53% of GDP in 2012, entailed risks of some parts of the shadow banking business, but not necessarily the Chinese economy.

Yan’s estimation is notably higher than that of the Chinese Academy of Social Sciences. The government think tank said on May 9 that the sector has reached 27 trillion yuan ($4.4 trillion in 2013) and is equivalent to nearly one fifth of the domestic banking sector’s total assets.

Massive, Curvaceous Buildings Designed to Imitate a Mountain Forest

Chinamassive

Information Technology (IT)

I am an IT generalist. Am I doomed to low pay forever? Interesting comments and suggestions to this question on a Forum maintained by The Register.

I’m an IT generalist. I know a bit of everything – I can behave appropriately up to Cxx level both internally and with clients, and I’m happy to crawl under a desk to plug in network cables. I know a little bit about how nearly everything works – enough to fill in the gaps quickly: I didn’t know any C# a year ago, but 2 days into a project using it I could see the offshore guys were writing absolute rubbish. I can talk to DB folks about their DBs; network guys about their switches and wireless networks; programmers about their code and architects about their designs. Don’t get me wrong, I can do as well as talk, programming, design, architecture – but I would never claim to be the equal of a specialist (although some of the work I have seen from the soi-disant specialists makes me wonder whether I’m missing a trick).

My principle skill, if there is one – is problem resolution, from nitty gritty tech details (performance and functionality) to handling tricky internal politics to detoxify projects and get them moving again.

How on earth do I sell this to an employer as a full-timer or contractor? Am I doomed to a low income role whilst the specialists command the big day rates? Or should I give up on IT altogether

Crowdfunding is brutal… even when it works

China bans Windows 8

China has banned government use of Windows 8, Microsoft Corp’s latest operating system, a blow to a US technology company that has long struggled with sales in the country.

The Central Government Procurement Center issued the ban on installing Windows 8 on Chinese government computers as part of a notice on the use of energy-saving products, posted on its website last week.

Data Analytics

Statistics of election irregularities – good forensic data analytics.

Links May 2014

If there is a theme for this current Links page, it’s that trends spotted a while ago are maturing, becoming clearer.

So with the perennial topic of Big Data and predictive analytics, there is an excellent discussion in Algorithms Beat Intuition – the Evidence is Everywhere. There is no question – the machines are going to take over; it’s only a matter of time.

And, as far as freaky, far-out science, how about Scientists Create First Living Organism With ‘Artificial’ DNA.

Then there are China trends. Workers in China are better paid, have higher skills, and they are starting to use the strike. Striking Chinese Workers Are Headache for Nike, IBM, Secret Weapon for Beijing . This is a long way from the poor peasant women from rural areas living in dormitories, doing anything for five or ten dollars a day.

The Chinese dominance in the economic sphere continues, too, as noted by the Economist. Crowning the dragon – China will become the world’s largest economy by the end of the year

China

But there is the issue of the Chinese property bubble. China’s Property Bubble Has Already Popped, Report Says

Chinaproperty

Then, there are issues and trends of high importance surrounding the US Federal Reserve Bank. And I can think of nothing more important and noteworthy, than Alan Blinder’s recent comments.

Former Fed Leader Alan Blinder Sees Market-rattling Infighting at Central Bank

“The Fed may get more raucous about what to do next as tapering draws to a close,” Alan Blinder, a banking industry consultant and economics professor at Princeton University said in a speech to the Investment Management Consultants Association in Boston.

The cacophony is likely to “rattle the markets” beginning in late summer as traders debate how precipitously the Fed will turn from reducing its purchases of U.S. government debt and mortgage securities to actively selling it.

The Open Market Committee will announce its strategy in October or December, he said, but traders will begin focusing earlier on what will happen with rates as some members of the rate-setting panel begin openly contradicting Fed Chair Janet Yellen, he said.

Then, there are some other assorted links with good infographics, charts, or salient discussion.

Alibaba IPO Filing Indicates Yahoo Undervalued Heck of an interesting issue.

Alibaba

Twitter Is Here To Stay

Three Charts on Secular Stagnation Krugman toying with secular stagnation hypothesis.

Rethinking Property in the Digital Era Personal data should be viewed as property

Larry Summers Goes to Sleep After Introducing Piketty at Harvard Great pic. But I have to have sympathy for Summers, having attended my share of sleep-inducing presentations on important economics issues.

lawrencesummers

Turkey’s Institutions Problem from the Stockholm School of Economics, nice infographics, visual aids. Should go along with your note cards on an important emerging economy.

Post-Crash economics clashes with ‘econ tribe’ – economics students in England are proposing reform of the university economics course of study, but, as this link points out, this is an uphill battle and has been suggested before.

The Life of a Bond – everybody needs to know what is in this infographic.

Very Cool Video of Ocean Currents From NASA

perpetualocean_cover_1024x676

Links – April 26, 2014

These Links help orient forecasting for companies and markets. I pay particular attention to IT developments. Climate change is another focus, since it is, as yet, not fully incorporated in most longer run strategic plans. Then, primary global markets, like China or the Eurozone, are important. I usually also include something on data science, predictive analytics methods, or developments in economics. Today, I include an amazing YouTube of an ape lighting a fire with matches.

China

Xinhua Insight: Property bubble will not wreck China’s economy

Information Technology (IT)

Thoughts on Amazon earnings for Q1 2014

Amazon

This chart perfectly captures Amazon’s current strategy: very high growth at 1% operating margins, with the low margins caused by massive investment in the infrastructure necessary to drive growth. It very much feels as though Amazon recognizes that there’s a limited window of opportunity for it to build the sort of scale and infrastructure necessary to dominate e-commerce before anyone else does, and it’s scraping by with minimal margins in order to capture as much as possible of that opportunity before it closes.

Apple just became the world’s biggest-dividend stock

Apple

The Disruptive Potential of Artificial Intelligence Applications Interesting discussion of vertical search, virtual assistants, and online product recommendations.

Hi-tech giants eschew corporate R&D, says report

..the days of these corporate “idea factories” are over according to a new study published by the American Institute of Physics (AIP). Entitled Physics Entrepreneurship and Innovation (PDF), the 308-page report argues that many large businesses are closing in-house research facilities and instead buying in new expertise and technologies by acquiring hi-tech start-ups.

Climate Change

Commodity Investors Brace for El Niño

Commodities investors are bracing themselves for the ever-growing possibility for the occurrence of a weather phenomenon known as El Niño by mid-year which threatens to play havoc with commodities markets ranging from cocoa to zinc.

The El Niño phenomenon, which tends to occur every 3-6 years, is associated with above-average water temperatures in the central and eastern Pacific and can, in its worst form, bring drought to West Africa (the world’s largest cocoa producing region), less rainfall to India during its vital Monsoon season and drier conditions for the cultivation of crops in Australia.

Economics

Researchers Tested The ‘Gambler’s Fallacy’ On Real-Life Gamblers And Stumbled Upon An Amazing Realization I love this stuff. I always think of my poker group.

..gamblers appear to be behaving as though they believe in the gambler’s fallacy, that winning or losing a bunch of bets in a row means that the next bet is more likely to go the other way. Their reactions to that belief — with winners taking safer bets under the assumption they’re going to lose and losers taking long-shot bets believing their luck is about to change — lead to the opposite effect of making the streaks longer

Foreign Affairs Focus on Books: Thomas Piketty on Economic Inequality


Is the U.S. Shale Boom Going Bust?

Among drilling critics and the press, contentious talk of a “shale bubble” and the threat of a sudden collapse of America’s oil and gas boom have been percolating for some time. While the most dire of these warnings are probably overstated, a host of geological and economic realities increasingly suggest that the party might not last as long as most Americans think.

Apes Can Definitely Use Tools

Bonobo Or Boy Scout? Great Ape Lights Fire, Roasts Marshmallows


The Future of Digital- I

The recent Business Insider presentation on the “Digital
Future
” is outstanding. The slides are a paean to digital media, mobile, and more specifically Android, which appears to have won the platform wars – at least for the time being.

Here are some highlights.

BI charts the global internet population at just less than three billion, a figure which includes, however, almost all the more affluent consumers.

New media – Apple, Google, Amazon, Facebook, Yahoo – dominate the old media – 21st Century Fox, CBS, Viacom, Time Warner, Comcast, and Disney.

Multiple devices and screens are key to the new media landscape from a hardware standpoint. As “connected devices,” smartphones and tablets now dominate PC’s. Sales of smartphones are still booming, and tablets are cannibalizing PCF’s.

SMartPhonesPCs

Demand for “phablets” is skyrocketing, especially in Asia. PC manufacturers are taking a hit.

BI estimates one fifth of internet traffic is now via mobile devices.

The Chinese smartphone users are now twice the size of US market.

But it is with respect to the “platform wars” that the BI presentation takes the strongest stand. Their estimates suggest 80 percent of smartphones run Android, and 60 percent of tables.

platformstats1

They say Android has caught up in the app development department. The exhibit showing the “fragmentation” of Android caught my eye.

Androidfrag

US digital advertising is now bigger than TV, and, according to BI, shows a 20 percent CAGR 2002-2012.

Advertising

Newspaper ads have plummeted, as Google takes the lion’s share of digital advertising.

GoogleversusROWads

Here’ the link.

http://www.businessinsider.com/the-future-of-digital-2013-2013-11?op=1

You can convert the 134 slides in the BI presentation to a PDF file, if you register for a trial membership to BI services.

I’ll have more to say about these topics soon.