Tag Archives: Chinese real estate bubble

Perspectives

Blogging gets to be enjoyable, although demanding. It’s a great way to stay in touch, and probably heightens personal mental awareness, if you do it enough.

The “Business Forecasting” focus allows for great breadth, but may come with political constraints.

On this latter point, I assume people have to make a living. Populations cannot just spend all their time in mass rallies, and in political protests – although that really becomes dominant at certain crisis points. We have not reached one of those for a long time in the US, although there have been mobilizations throughout the Mid-East and North Africa recently.

Nate Silver brought forth the “hedgehog and fox” parable in his best seller – The Signal and the Noise. “The fox knows many things, but the hedgehog knows one big thing.”

My view is that business and other forecasting endeavors should be “fox-like” – drawing on many sources, including, but not limited to quantitative modeling.

What I Think Is Happening – Big Picture

Global dynamics often are directly related to business performance, particularly for multinationals.

And global dynamics usually are discussed by regions – Europe, North America, Asia-Pacific, South Asia, the Mid-east, South American, Africa.

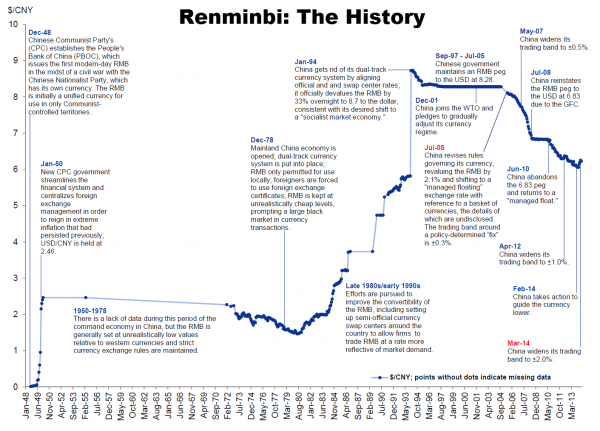
The big story since around 2000 has been the emergence of the People’s Republic of China as a global player. You really can’t project the global economy without a fairly detailed understanding of what’s going on in China, the home of around 1.5 billion persons (not the official number).

Without delving much into detail, I think it is clear that a multi-centric world is emerging. Growth rates of China and India far surpass those of the United States and certainly of Europe – where many countries, especially those along the southern or outer rim – are mired in high unemployment, deflation, and negative growth since just after the financial crisis of 2008-2009.

The “old core” countries of Western Europe, the United States, Canada, and, really now, Japan are moving into a “post-industrial” world, as manufacturing jobs are outsourced to lower wage areas.

Layered on top of and providing support for out-sourcing, not only of manufacturing but also skilled professional tasks like computer programming, is an increasingly top-heavy edifice of finance.

Clearly, “the West” could not continue its pre-World War II monopoly of science and technology (Japan being in the pack here somewhere). Knowledge had to diffuse globally.

With the GATT (General Agreement on Tariffs and Trade) and the creation of the World Trade Organization (WTO) the volume of trade expanded with reduction on tariffs and other barriers (1980’s, 1990’s, early 2000’s).

In the United States the urban landscape became littered with “Big Box stores” offering shelves full of clothing, electronics, and other stuff delivered to the US in the large shipping containers you see stacked hundreds of feet high at major ports, like San Francisco or Los Angeles.

There is, indeed, a kind of “hollowing out” of the American industrial machine.

Possibly it’s only the US effort to maintain a defense establishment second-to-none and of an order of magnitude larger than anyone elses’ that sustains certain industrial activities shore-side. And even that is problematical, since the chain of contracting out can be complex and difficult and costly to follow, if you are a US regulator.

I’m a big fan of post-War Japan, in the sense that I strongly endorse the kinds of evaluations and decisions made by the Japanese Ministry of International Trade and Investment (MITI) in the decades following World War II. Of course, a nation whose industries and even standing structures lay in ruins has an opportunity to rebuild from the ground up.

In any case, sticking to a current focus, I see opportunities in the US, if the political will could be found. I refer here to the opportunity for infrastructure investment to replace aging bridges, schools, seaport and airport facilities.

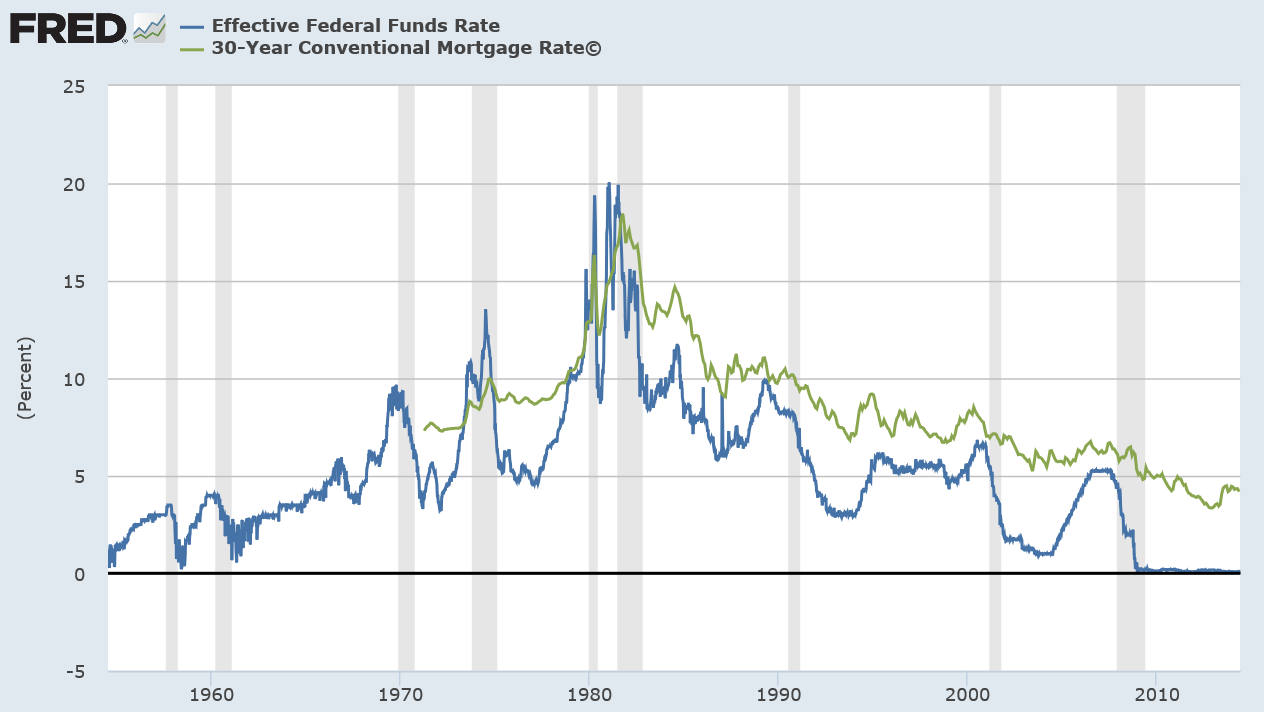
In case you had not noticed, interest rates are almost zero. Issuing bonds to finance infrastructure could not face more favorable terms.

Another option, in my mind – and a hat-tip to the fearsome Walt Rostow for this kind of thinking – is for the US to concentrate its resources into medicine and medical care. Already, about one quarter of all spending in the US goes to health care and related activities. There are leading pharma and biotech companies, and still a highly developed system of biomedical research facilities affiliated with universities and medical schools – although the various “austerities” of recent years are taking their toll.

So, instead of pouring money down a rathole of chasing errant misfits in the deserts of the Middle East, why not redirect resources to amplify the medical industry in the US? Hospitals, after all, draw employees from all socioeconomic groups and all ethnicities. The US and other national populations are aging, and will want and need additional medical care. If the world could turn to the US for leading edge medical treatment, that in itself could be a kind of foreign policy, for those interested in maintaining US international dominance.

Tangential Forces

While writing in this vein, I might as well offer my underlying theory of social and economic change. It is that major change occurs primarily through the impact of tangential forces, things not fully seen or anticipated. Perhaps the only certainty about the future is that there will be surprises.

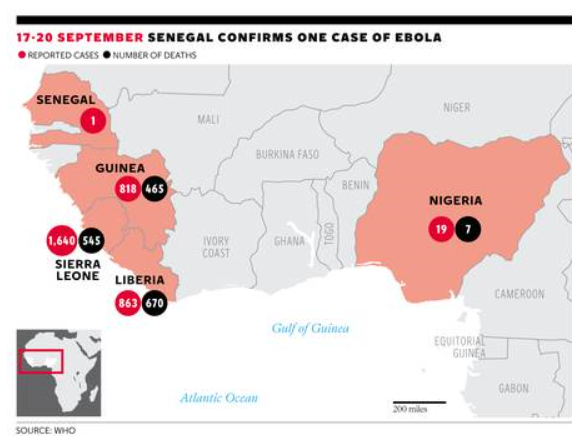
Quite a few others subscribe to this theory, and the cottage industry in alarming predictions of improbable events – meteor strikes, flipping of the earth’s axis, pandemics – is proof of this.

Really, it is quite amazing how the billions on this planet manage to muddle through.

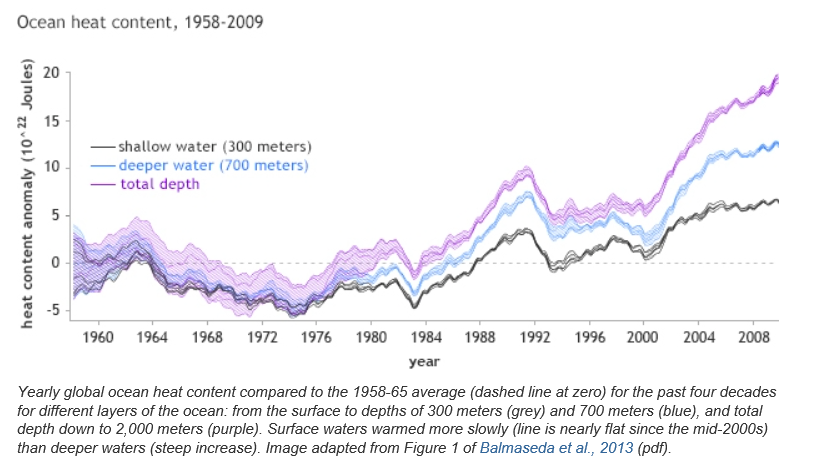
But I am thinking here of climate change as a tangential force.

And it is also a huge challenge.

But it is a remarkably subtle thing, not withstanding the on-the-ground reality of droughts, hurricanes, tornados, floods, and so forth.

And it is something smack in the sweet spot of forecasting.

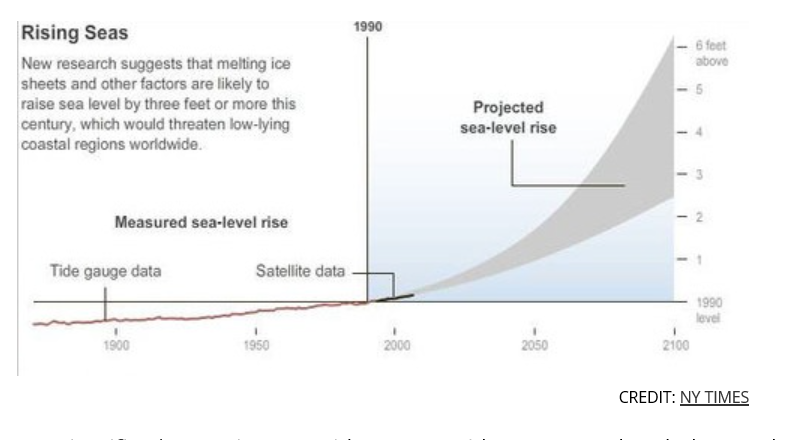
There is no discussion of suitable responses to climate change without reference to forecasts of global temperature and impacts, say, of significant increases in sea level.

But these things take place over many years and, then, boom a whole change of regime may be triggered – as ice core and other evidence suggests.

Flexibility, Redundancy, Avoidance of Over-Specialization

My brother (by a marriage) is a priest, formerly a tax lawyer. We have begun a dialogue recently where we are looking for some basis for a new politics and new outlook, really that would take the increasing fragility of some of our complex and highly specialized systems into account – creating some backup systems, places, refuges, if you will.

I think there is a general principle that we need to empower people to be able to help themselves – and I am not talking about eliminating the social safety net. The ruling groups in the United States, powerful interests, and politicians would be well advised to consider how we can create spaces for people “to do their thing.” We need to preserve certain types of environments and opportunities, and have a politics that speaks to this, as well as to how efficiency is going to be maximized by scrapping local control and letting global business from wherever come in and have its way – no interference allowed.

The reason Reid and I think of this as a search for a new politics is that, you know, the counterpoint is that all these impediments to getting the best profits possible just result in lower production levels, meaning then that you have not really done good by trying to preserve land uses or local agriculture, or locally produced manufactures.

I got it from a good source in Beijing some years ago that the Chinese Communist Party believes that full-out growth of production, despite the intense pollution, should be followed for a time, before dealing with that problem directly. If anyone has any doubts about the rationality of limiting profits (as conventionally defined), I suggest they spend some time in China during an intense bout of urban pollution somewhere.

Maybe there are abstract, theoretical tools which could be developed to support a new politics. Why not, for example, quantify value experienced by populations in a more comprehensive way? Why not link achievement of higher value differently measured with direct payments, somehow? I mean the whole system of money is largely an artifact of cyberspace anyway.

Anyway – takeaway thought, create spaces for people to do their thing. Pretty profound 21st Century political concept.

Coming attractions here – more on predicting the stock market (a new approach), summaries of outlooks for the year by major sources (banks, government agencies, leading economists), megatrends, forecasting controversies.

Top picture from FIREBELLY marketing

Links, end of September

Information Technology (IT)

This is how the “Shell Shock” bug imperils the whole internet

It’s a hacker’s wet dream: a software bug discovered in the practically ubiquitous computer program known as “Bash” makes hundreds of millions of computers susceptible to hijacking. The impact of this bug is likely to be higher than that of the Heartbleed bug, which was exposed in April. The National Vulnerability Database, a US government system which tracks information security flaws, gave the bug the maximum score for “Impact” and “Exploitability,” and rated it as simple to exploit.

The bug, which has been labeled “Shell Shock” by security experts, affects computers running Unix-based operating systems like Mac OS X and Linux. That means most of the internet: according to a September survey conducted by Netcraft, a British internet services company, just 13% of the busiest one million websites use Microsoft web servers. Almost everyone else likely serves their website via a Unix operating system that probably uses Bash.

Microsoft’s Bing Predicts correctly forecasted the Scottish Independence Referendum vote

Bing Predicts was beta tested in the UK for this referendum. The prediction engine uses machine-learning models to analyse and detect patterns from a range of big data sources such as the web and social activity in order to make accurate predictions about the outcome of events.

Bing got the yes/no vote right, but missed the size of the vote to stay united with England, Wales, and Northern Ireland.

Is the profession of science broken (a possible cause of the great stagnation)? Fascinating discussion which mirrors many friends’ comments that too much time is taken up applying for and administering grants, and not enough time is left for the actual research, for unconventional ideas.

What has changed is the bureaucratic culture. The increasing interpenetration of government, university, and private firms has led everyone to adopt the language, sensibilities, and organizational forms that originated in the corporate world. Although this might have helped in creating marketable products, since that is what corporate bureaucracies are designed to do, in terms of fostering original research, the results have been catastrophic.

Climate

Climate Science Is Not Settled The Wall Street Journal piece by a former Obama adviser and BP scientist inflamed the commentariat, after publication September 16, on the eve of the big climate talks and march in New York City. See On eve of climate march, Wall Street Journal publishes call to wait and do nothing for a critical perspective.

This chart, from NOAA, is one key – showing the divergence in heat stored in various layers of the oceans –

oceanheat

Nicholas Stern: The state of the climate — and what we might do about it TED talk.

Ebola

The public response to the Ebola epidemic is ramping up, but the situation is still dire and total cases and deaths are still increasing exponentially.

Ebola outbreak: Death toll passes 3,000 as WHO warns numbers are ‘vastly underestimated’

“The Ebola epidemic ravaging parts of West Africa is the most severe acute public health emergency seen in modern times.Never before in recorded history has a biosafety level four pathogen infected so many people so quickly, over such a broad geographical area, for so long.”

 ebolamap 

Global Economy

What Does a ‘Good’ Chinese Adjustment Look Like? Michael Pettis argues that what some see as a “soft landing” is in fact a preparation for later financial collapse. Instead, based on an intricate argument regarding interest rates and the nominal GDP growth rates in China, he proposes a reduction in Chinese GDP growth going forward through control of credit – in order to rebalance the Chinese consumer economy. Pettis is to my way of thinking always relevant, and often brilliant in the way he makes his analysis.

What Went Wrong? Russia Sanctions, EU, and the Way Out

Washington, Brussels and Moscow are in a vicious circle, which would spare none of them and which has potential to undermine global recovery.

Venture Capital

22 Crowdfunding Sites (and How To Choose Yours!)

inc-magazine-crowdfunding-infographic-june-2013_26652

Recession and Economic Projections

I’ve been studying the April 2014 World Economic Outlook (WEO) of the International Monetary Fund (IMF) with an eye to its longer term projections of GDP.

Downloading the WEO database and summing the historic and projected GDP’s suggests this chart.

GlobalGDP

The WEO forecasts go to 2019, almost to our first benchmark date of 2020. Global production is projected to increase from around $76.7 trillion in current US dollar equivalents to just above $100 trillion. An update in July marked the estimated 2014 GDP growth down from 3.7 to 3.4 percent, leaving the 2015 growth estimate at a robust 4 percent.

The WEO database is interesting, because it’s country detail allows development of charts, such as this.

gbobalproout

So, based on this country detail on GDP and projections thereof, the BRIC’s (Brazil, Russia, India, and China) will surpass US output, measured in current dollar equivalents, in a couple of years.

In purchasing power parity (PPP) terms, China is currently or will soon pass the US GDP, incidentally. Thus, according to the Big Mac index, a hamburger is 41 percent undervalued in China, compared to the US. So boosting Chinese production 41 percent puts its value greater than US output. However, the global totals would change if you take this approach, and it’s not clear the Chinese proportion would outrank the US yet.

The Impacts of Recession

The method of caging together GDP forecasts to the year 2030, the second benchmark we want to consider in this series of posts, might be based on some type of average GDP growth rate.

However, there is a fundamental issue with this, one I think which may play significantly into the actual numbers we will see in coming years.

Notice, for example, the major “wobble” in the global GDP curve historically around 2008-2009. The Great Recession, in fact, was globally synchronized, although it only caused a slight inflection in Chinese and BRIC growth. Europe and Japan, however, took a major hit, bringing global totals down for those years.

Looking at 2015-2020 and, certainly, 2015-2030, it would be nothing short of miraculous if there were not another globally synchronized recession. Currently, for example, as noted in an earlier post here, the Eurozone, including Germany, moved into zero to negative growth last quarter, and there has been a huge drop in Japanese production. Also, Chinese economic growth is ratcheting down from it atmospheric levels of recent years, facing a massive real estate bubble and debt overhang.

But how to include a potential future recession in economic projections?

One guide might be to look at how past projections have related to these types of events. Here, for example, is a comparison of the 2008 and 2014 US GDP projections in the WEO’s.

WEOUS

So, according to the IMF, the Great Recession resulted in a continuing loss of US production through until the present.

This corresponds with the concept that, indeed, the GDP time series is, to a large extent, a random walk with drift, as Nelson and Plosser suggested decades ago (triggering a huge controversy over unit roots).

And this chart highlights a meaning for potential GDP. Thus, the capability to produce things did not somehow mysteriously vanish in 2008-2009. Rather, there was no point in throwing up new housing developments in a market that was already massively saturated, Not only that, but the financial sector was unable to perform its usual duties because it was insolvent – holding billions of dollars of apparently worthless collateralized mortgage securities and other financial innovations.

There is a view, however, that over a long period of time some type of mean reversion crops up.

This is exemplified in the 2014 Congressional Budget Office (CBO) projections, as shown in this chart from the underlying detail.

CBOpotentialGDP

This convergence on potential GDP, which somehow is shown in the diagram with a weaker growth rate just after 2008, is based on the following forecasts of underlying drivers, incidentally.

CBOdrivers

So again, despite the choppy historical detail for US real GDP growth in the chart on the upper left, the forecast adopted by the CBO blithely assumes no recession through 2024 as well as increase in US interest rates back to historic levels by 2019.

I think this clearly suggests the Congressional Budget Office is somewhere in la-la land.

But the underlying question still remains.

How would one incorporate the impacts of an event – a recession – which is probably almost a certainty by the end of these forecast horizons, but whose timing is uncertain?

Of course, there are always scenarios, and I think, particularly for budget discussions, it would be good to display one or two of these.

I’m interested in reader suggestions on this.

Links – July 10, 2014

Did China Just Crush The US Housing Market? Zero Hedge has established that Chinese money is a major player in the US luxury housing market with charts like these.

pieNAR

NASbarchart

Then, looking within China, it’s apparent that the source of this money could be shut off – a possibility which evokes some really florid language from Zero Hedge –

Because without the Chinese bid in a market in which the Chinese are the biggest marginal buyer scooping up real estate across the land, sight unseen, and paid for in laundered cash (which the NAR blissfully does not need to know about due to its AML exemptions), watch as suddenly the 4th dead cat bounce in US housing since the Lehman failure rediscovers just how painful gravity really is.

IPO market achieves liftoff More IPO’s coming to market now.

IPO

The Mouse That Wouldn’t Die: How a Lack of Public Funding Holds Back a Promising Cancer Treatment Fascinating. Dr. Zheng Cui has gone from identifying, then breeding cancer resistant mice, to discovering the genetics and mechanism of this resistance, focusing on a certain type of white blood cell. Then, moving on to human research, Dr. Cui has identified similar genetics in humans, and successfully treated advanced metastatic cancer in trials. But somehow – maybe since transfusions are involved and Big pharma can’t make money on it – the research is losing support.

Scientists Create ‘Dictionary’ of Chimp Gestures to Decode Secret Meanings

Some of those discovered meanings include the following:

•When a chimpanzee taps another chimp, it means “Stop that”

•When a chimpanzee slaps an object or flings its hand, it means “Move away” or “Go away”

•When a chimpanzee raises its arm, it means “I want that”

Chimp-Gestures

Medicine w/o antibiotics

The Hillary Clinton Juggernaut Courts Wall Street and Neocons Describes Hillary as the “uber-establishment candidate.”

US-AFGHANISTAN-WOMEN-RIGHTS-CLINTON

The Next Recession – Will It Be A Global Meltdown?

One my focuses is the global economy and any cracks in the firmament which might presage the next recession. I rely a lot on my Twitter account to keep me on the crest of the wave, in this regard.

I’m really concerned, as are many of my colleagues and contacts in business and government.

We’ve hardly escaped the effects of last recession 2008-2009. Those are US dates, of course, set by the National Bureau of Economic Research (NBER) the official recession “dater” in this country.

There have been a series of rolling impacts and consequences of this so-called “Great Recession.”

Europe

Housing or real estate bubbles were present in Europe, too, particularly in Spain and Ireland. Then, there was the problem of the Greek economy and state, which did not support the level of public debt that had been garnered by, in some cases, corrupt public officials. And European problems were complicated by the currency union of the euro in a context where there is not, as yet, a centralized EU state. Anyway, not to reprise the whole matter blow-by-blow, but most of Europe, with the exception of Germany, plunged into recession and struggled with austerity policies that made things worse for Main Street or, as they like to say in Britain, “High Street.”

Many European countries are just now coming out of recession, and overall, the growth rate in the EU area is almost indistinguishable from zero.

So another recession in the next one to two years would really set them back.

China

Part of the problem China has been experiencing is related to the persisting downturn in most of Europe, since Europe is a big trading partner. And so, for that matter is the United States, which bought less from China during the recession years.

But another problem is that China now is experiencing a mojo big property bubble of its own.

Newly wealthy Chinese do not really have any place to put their money, except real estate. The Chinese, like the Japanese, are big savers, and for many middle class families, buying the second apartment or even a house is an investment for the future. Yet Chinese real estate prices have skyrocketed, leaving the average Chinese wage earner in the dust, with less and less hope of ever owning a residence.

Apparently, in connection with this real estate speculation, a large shadow banking system has emerged. Some estimates circulate on Twitter suggesting this rivals the size of the official Chinese banking system.

Can “market socialism” or “market Leninism” experience a financial crisis, based on too many debts that cannot be paid?

I’ve been to China a few times, and done some business there – all the while trying to understand how things are set up. My feeling is that one should not impute banking practices that seem pro forma in, say, Great Britain or the US, to the Chinese. I think they are much more ready to “break the rules” in order to keep the party going (which is sort of a pun).

Having said that, I do think a Chinese crisis could develop if property values collapse, as they are wont to do in bubble mode.

Again, it’s hard to say how this might play out, since the victims and suffering would be among the nouveau riche of China, of whom there are millions, and many more average families who have invested their nest egg in a hot property.

But I can’t think that collapse of real estate values in modern China would not have worldwide repurcussions.

The Rest of the World

Regrettably, I cannot go through other major regions, one-by-one, but I’d have to say that things are not so good. The BRIC’s as a group all have more problems than a few years back, when they were hailed as the bright new centers of economic growth by that Goldman Sachs analyst. That’s Brazil, Russia, India, and China, of course.

Possibilities of Increased Conflict

There is a kind of axiom of geopolitics and social interaction that when the pie is growing and everybody can get more, even though their slice may not have been very big to begin with, there is a tendency for people to make do, go about their business and so forth. Reverse this and you have the concept that shrinking the pie – as austerity policies and the Great Recession have done – tends to increase levels of conflict. At first, to the extent that people have the idea that “we are all in this together” there may be increased cooperation. But that is not the current situation in almost any society. Quite the contrary, as Piketty and the Occupy Movement highlight, there is growing awareness of inequality of wealth and income.

There are armed conflicts in Syria, the Ukraine, Afghanistan (resurgent Taliban), and areas and regions in Africa. The Indian elections recently installed a Hindu nationalist who hopefully will be a reformer, but may, if the going gets tough, revert or acquiesce to more conflict with Pakistan and with non-Hindu populations within India. Pakistan, one of the world’s nuclear powers, appears to be extremely unstable politically. There are deep civil divisions in Thailand between city and rural areas that parallel class divisions. China is flexing its muscles in the South China Sea.

And we may be moving from an era of US-centric global capitalism to a time when the Eurasian supercontinent will become significantly more important and perhaps decoupled from Wall Street and the City of London. Already, there are threats to dollar supremacy, and, historically, as US economic power is eclipsed by the more rapidly growing economies of Asia, some adjustment seems predictable.

In all this, Hollywood can be counted on to roll out some really corking new international intrigue films, perhaps (although I doubt it) with more complex plots.

The Situation with the US Federal Reserve Bank

The point of this international survey and reprise of recent business history is to highlight areas where surprises may originate, shaking the markets, and perhaps triggering the next recession.

But the most likely suspect is the US Federal Reserve Bank.

Two graphs speak volumes.

interestratesnew

Fedassets

Seeking to encourage economic recovery, the US Federal Reserve dropped the federal funds rate to a number effectively almost zero – a historically low number. This zero bound federal funds rate has persisted since the end of 2009, or for about five years.

The Fed also has engaged in new policies, whereby it goes into private bond markets and buys long term bonds – primarily mortgage-backed securities. The second chart tracks this inasmuch as a good portion of the more than 4 trillion in Fed assets (for which there are corresponding liabilities, of course) are these mortgage-backed securities. In effect, the Fed has purchased a sizeable portion of the US housing market – one might say “nationalize” except that would be forgetting the fact that the Fed is actually a private institution whose governance is appointed by the Executive Branch of the US government.

In any case, this bond-buying is the famous “quantitative easing” (QE) and is mirrored in the accumulation of excess reserves by the banking system. Generally, that is, banks and financial institutions issue mortgages, sell them among themselves to be packaged in mortgage-backed securities, and the Fed has been buying these.

Banks can easily loan these excess reserves, but they consistently have not. Why is an interesting question beyond the scope of this discussion, but the consequence is that the Fed’s actions are “firewalled” from increasing the rate of inflation, which is what ordinarily you might think would occur given that various metrics of money supply also have surged upward.

Now “Fed-watching” is its own little cottage industry among financial commentators, and I am not going to second-guess the media here. The Fed has announced a plan to “taper” these purchases of long term bonds. This is likely to increase the mortgage rates and, probably to some extent, based on expectations already has.

So, the long and the short of it are that this set of policies – zero federal funds rate and bond buying cannot go on forever.

If economic growth has been low-grade since 2010 with these low interest rates, what is the reasonable outlook for a higher interest rate regime?

Timing of the Next Recession

When is the most likely time for a recession, for example? Would it be later in 2014, in 2015, or thereafter, maybe in 2016.

Here is a table of all the recessions in the US since the middle 1850’s along with facts about their duration (source: NBER).

NBERRecess

Without even considering averages, the maximum period of trough to trough – that is, from the bottom of one recession to the bottom of the next – has been 128 months or ten years and eight months. Here, incidentally, the month numbers begin January 1800, for what that’s worth.

Thus, at the outside, based on these empirics, the trough of the next recession is likely to occur no later than early 2020.

Note that we have already blown through the average length from trough to trough of about 58.4 months or about five years from June 2009.

On a simple probabilistic basis, therefore, we are moving into the tail of the distribution of business cycle durations, suggesting that the chances of a downturn are in some sense already above 50 percent.

And note that the experience of the current business recovery is nothing like this historically maximum span in the 1990’s between the trough of the recession of 1990-1991 and the trough of November 2001.

This business recovery persistently seems to move ahead just above or, in the last quarter of 2013, below “stall speed.”

Seemingly, a fairly minor perturbation could set off a chain reaction, given the advanced frothiness in the stock market and softness in housing prices.

More of the Same, Worse

Neil Baroifsky was special inspector with oversight authority for the TARP during the bailout phase of the Great Recession, and currently is a partner in the Litigation Department of national law firm Jenner & Block LLP.

He’s also an author and often is called on for his opinion about developments in malfeasance writ large among the finance giants – such as the Credit Suisse settlement. In connection with a recent NPR interview, Barofsky said,

Although it is good that we averted a catastrophe back in 2008, the way that we did so I believe has unfortunately set the stage for an even more devastating financial crisis in the future.

HOBSON: In the future? How far?

BAROFSKY: Well, if I knew that, Michael Lewis would be writing his next book about people who made billions on timing the markets perfectly about me, which would be great.

(LAUGHTER)

BAROFSKY: But if you look, a lot of the same broken incentives from 2008 are still there. It’s just a question of when, not if. You can’t look at the fundamental broken incentives in the financial system and really come to a conclusion other than that we’re headed down the same dangerous path that we were that culminated in the explosion of ’08.

Barofsky’s point is readily supported by facts, such as –

The US and global financial system is even more concentrated today than in 2007, making “too big to fail”and even bigger potential problem now, than before the Great Recession. Even Alan Greenspan has taken note.

And the “pass the buck” system, whereby bond rating agencies are paid by the originators to evaluate exotic securities (“financial innovations”) created by the banking and shadow banking industries, securities which are then passed on to pension funds and hapless investors – this system appears to still be completely in place. Talk about the concept of “moral hazard.”

Global Impact

I think you get the picture.

For one reason or another, some fairly minor event is likely to set off a cascade of consequences in US and global financial markets, leading to the next recession. Probably, within one, two, or three years, as a matter of fact. Because the US Fed, and, for that matter, other central banks will still be working their way out of the last recession, there may be fewer “policy tools” to halt the stampede to sell, cutback, and so forth. Governments could respond with aggressive fiscal policy, but that option appears limited unless there are major changes in the political climate in the US and Europe.

Personally, I think wholly new directions of policy should be contemplated at the personal, local, regional, and of course at national levels.

We need to create what I have started to call “islands of stability.” This is the old idea of local self-reliance, but in new packaging. I really think there should be discussions widely across the US at least about how to decouple from the global economy and, indeed, from the financial concentrations on Wall Street. As a matter of self-preservation, until such time as more courageous national policies can be undertaken to reign in such obvious risks.

LInks – late May

US and Global Economic Prospects

Goldman’s Hatzius: Rationale for Economic Acceleration Is Intact

We currently estimate that real GDP fell -0.7% (annualized) in the first quarter, versus a December consensus estimate of +2½%. On the face of it, this is a large disappointment. It raises the question whether 2014 will be yet another year when initially high hopes for growth are ultimately dashed.

 Today we therefore ask whether our forecast that 2014-2015 will show a meaningful pickup in growth relative to the first four years of the recovery is still on track. Our answer, broadly, is yes. Although the weak first quarter is likely to hold down real GDP for 2014 as a whole, the underlying trends in economic activity are still pointing to significant improvement….

 The basic rationale for our acceleration forecast of late 2013 was twofold—(1) an end to the fiscal drag that had weighed on growth so heavily in 2013 and (2) a positive impulse from the private sector following the completion of the balance sheet adjustments specifically among US households. Both of these points remain intact.

Economy and Housing Market Projected to Grow in 2015

Despite many beginning-of-the-year predictions about spring growth in the housing market falling flat, and despite a still chugging economy that changes its mind quarter-to-quarter, economists at the National Association of Realtors and other industry groups expect an uptick in the economy and housing market through next year.

The key to the NAR’s optimism, as expressed by the organization’s chief economist, Lawrence Yun, earlier this week, is a hefty pent-up demand for houses coupled with expectations of job growth—which itself has been more feeble than anticipated. “When you look at the jobs-to-population ratio, the current period is weaker than it was from the late 1990s through 2007,” Yun said. “This explains why Main Street America does not fully feel the recovery.”

Yun’s comments echo those in a report released Thursday by Fitch Ratings and Oxford Analytica that looks at the unusual pattern of recovery the U.S. is facing in the wake of its latest major recession. However, although the U.S. GDP and overall economy have occasionally fluctuated quarter-to-quarter these past few years, Yun said that there are no fresh signs of recession for Q2, which could grow about 3 percent.

Report: San Francisco has worse income inequality than Rwanda

If San Francisco was a country, it would rank as the 20th most unequal nation on Earth, according to the World Bank’s measurements.

Googlebus

Climate Change

When Will Coastal Property Values Crash And Will Climate Science Deniers Be The Only Buyers?

sea

How Much Will It Cost to Solve Climate Change?

Switching from fossil fuels to low-carbon sources of energy will cost $44 trillion between now and 2050, according to a report released this week by the International Energy Agency.

Natural Gas and Fracking

How The Russia-China Gas Deal Hurts U.S. Liquid Natural Gas Industry

This could dampen the demand – and ultimately the price for – LNG from the United States. East Asia represents the most prized market for producers of LNG. That’s because it is home to the top three importers of LNG in the world: Japan, South Korea and China. Together, the three countries account for more than half of LNG demand worldwide. As a result, prices for LNG are as much as four to five times higher in Asia compared to what natural gas is sold for in the United States.

The Russia-China deal may change that.

If LNG prices in Asia come down from their recent highs, the most expensive LNG projects may no longer be profitable. That could force out several of the U.S. LNG projects waiting for U.S. Department of Energy approval. As of April, DOE had approved seven LNG terminals, but many more are waiting for permits.

LNG terminals in the United States will also not be the least expensive producers. The construction of several liquefaction facilities in Australia is way ahead of competitors in the U.S., and the country plans on nearly quadrupling its LNG capacity by 2017. More supplies and lower-than-expected demand from China could bring down prices over the next several years.

Write-down of two-thirds of US shale oil explodes fracking mythThis is big!

Next month, the US Energy Information Administration (EIA) will publish a new estimate of US shale deposits set to deal a death-blow to industry hype about a new golden era of US energy independence by fracking unconventional oil and gas.

EIA officials told the Los Angeles Times that previous estimates of recoverable oil in the Monterey shale reserves in California of about 15.4 billion barrels were vastly overstated. The revised estimate, they said, will slash this amount by 96% to a puny 600 million barrels of oil.

The Monterey formation, previously believed to contain more than double the amount of oil estimated at the Bakken shale in North Dakota, and five times larger than the Eagle Ford shale in South Texas, was slated to add up to 2.8 million jobs by 2020 and boost government tax revenues by $24.6 billion a year.

China

The Annotated History Of The World’s Next Reserve Currency

yuanhistory

Goldman: Prepare for Chinese property bust

…With demand poised to slow given a tepid economic backdrop, weaker household affordability, rising mortgage rates and developer cash flow weakness, we believe current construction capacity of the domestic property industry may be excessive. We estimate an inventory adjustment cycle of two years for developers, driving 10%-15% price cuts in most cities with 15% volume contraction from 2013 levels in 2014E-15E. We also expect M&A activities to take place actively, favoring developers with strong balance sheet and cash flow discipline.

China’s Shadow Banking Sector Valued At 80% of GDP

The China Banking Regulatory Commission has shed light on the country’s opaque shadow banking sector. It was as large as 33 trillion yuan ($5.29 trillion) in mid-2013 and equivalent to 80% of last year’s GDP, according to Yan Qingmin, a vice chairman of the commission.

In a Tuesday WeChat blog sent by the Chong Yang Institute for Financial Studies, Renmin University, Yan wrote that his calculation is based on shadow lending activities from asset management businesses to trust companies, a definition he said was very broad.  Yan said the rapid expansion of the sector, which was equivalent to 53% of GDP in 2012, entailed risks of some parts of the shadow banking business, but not necessarily the Chinese economy.

Yan’s estimation is notably higher than that of the Chinese Academy of Social Sciences. The government think tank said on May 9 that the sector has reached 27 trillion yuan ($4.4 trillion in 2013) and is equivalent to nearly one fifth of the domestic banking sector’s total assets.

Massive, Curvaceous Buildings Designed to Imitate a Mountain Forest

Chinamassive

Information Technology (IT)

I am an IT generalist. Am I doomed to low pay forever? Interesting comments and suggestions to this question on a Forum maintained by The Register.

I’m an IT generalist. I know a bit of everything – I can behave appropriately up to Cxx level both internally and with clients, and I’m happy to crawl under a desk to plug in network cables. I know a little bit about how nearly everything works – enough to fill in the gaps quickly: I didn’t know any C# a year ago, but 2 days into a project using it I could see the offshore guys were writing absolute rubbish. I can talk to DB folks about their DBs; network guys about their switches and wireless networks; programmers about their code and architects about their designs. Don’t get me wrong, I can do as well as talk, programming, design, architecture – but I would never claim to be the equal of a specialist (although some of the work I have seen from the soi-disant specialists makes me wonder whether I’m missing a trick).

My principle skill, if there is one – is problem resolution, from nitty gritty tech details (performance and functionality) to handling tricky internal politics to detoxify projects and get them moving again.

How on earth do I sell this to an employer as a full-timer or contractor? Am I doomed to a low income role whilst the specialists command the big day rates? Or should I give up on IT altogether

Crowdfunding is brutal… even when it works

China bans Windows 8

China has banned government use of Windows 8, Microsoft Corp’s latest operating system, a blow to a US technology company that has long struggled with sales in the country.

The Central Government Procurement Center issued the ban on installing Windows 8 on Chinese government computers as part of a notice on the use of energy-saving products, posted on its website last week.

Data Analytics

Statistics of election irregularities – good forensic data analytics.

Asset Bubbles

It seems only yesterday when “rational expectations” ruled serious discussions of financial economics. Value was determined by the CAPM – capital asset pricing model. Markets reflected the operation of rational agents who bought or sold assets, based largely on fundamentals. Although imprudent, stupid investors were acknowledged to exist, it was impossible for a market in general to be seized by medium- to longer term speculative movements or “bubbles.”

This view of financial and economic dynamics is at the same time complacent and intellectually aggressive. Thus, proponents of the efficient market hypothesis contest the accuracy of earlier discussions of the Dutch tulip mania.

Now, however, there seems no doubt that bubbles in asset markets are both real and intractable to regulation and management, despite their catastrophic impacts.

But asset bubbles are so huge now that Larry Summers suggests, before the International Monetary Fund (IMF) recently, that the US is in a secular stagnation, and that the true, “market-clearing” interest rate is negative. Thus, given the unreality of implementing a negative interest rate, we face a long future of the zero bound – essentially zero interest rates.

Furthermore, as Paul Krugman highlights in a follow-on blog post – Summers says the economy needs bubbles to generate growth.

We now know that the economic expansion of 2003-2007 was driven by a bubble. You can say the same about the latter part of the 90s expansion; and you can in fact say the same about the later years of the Reagan expansion, which was driven at that point by runaway thrift institutions and a large bubble in commercial real estate.

So you might be tempted to say that monetary policy has consistently been too loose. After all, haven’t low interest rates been encouraging repeated bubbles?

But as Larry emphasizes, there’s a big problem with the claim that monetary policy has been too loose: where’s the inflation? Where has the overheated economy been visible?

So how can you reconcile repeated bubbles with an economy showing no sign of inflationary pressures? Summers’s answer is that we may be an economy that needs bubbles just to achieve something near full employment – that in the absence of bubbles the economy has a negative natural rate of interest. And this hasn’t just been true since the 2008 financial crisis; it has arguably been true, although perhaps with increasing severity, since the 1980s.

Re-enter the redoubtable “liquidity trap” stage left.

Summers and Krugman move at a fairly abstract and theoretical level, regarding asset bubbles and the current manifestation.

But more and more, the global financial press points the finger at the US Federal Reserve and its Quantitative Easing (QE) as the cause of emerging bubbles around the world.

One of the latest to chime in is the Chinese financial magazine Caixin with Heading Toward a Cliff.

The Fed’s QE policy has caused a gigantic liquidity bubble in the global economy, especially in emerging economies and asset markets. The improvement in the global economy since 2008 is a bubble phenomenon, centering around the demand from bubble goods or wealth effect. Hence, real Fed tightening would prick the bubble and trigger another recession. This is why some talk of the Fed tightening could trigger the global economy to trend down…

The odds are that the world is experiencing a bigger bubble than the one that unleashed the 2008 Global Financial Crisis. The United States’ household net wealth is much higher than at the peak in the last bubble. China’s property rental yields are similar to what Japan experienced at the peak of its property bubble. The biggest part of today’s bubble is in government bonds valued at about 100 percent of global GDP. Such a vast amount of assets is priced at a negative real yield. Its low yield also benefits other borrowers. My guesstimate is that this bubble subsidizes debtors to the tune of 10 percent of GDP or US$ 7 trillion dollars per annum. The transfer of income from savers to debtors has never happened on such a vast scale, not even close. This is the reason that so many bubbles are forming around the world, because speculation is viewed as an escape route for savers.The property market in emerging economies is the second-largest bubble. It is probably 100 percent overvalued. My guesstimate is that it is US$ 50 trillion overvalued.Stocks, especially in the United States, are significantly overvalued too. The overvaluation could be one-third or about US$ 20 trillion.There are other bubbles too. Credit risk, for example, is underpriced. The art market is bubbly again. These bubbles are not significant compared to the big three above.

The Caixin author – Andy Xie – goes on to predict inflation as the eventual outcome – a prediction I find far-fetched given the coming reaction to Fed tapering.

And the reach of the Chinese real estate bubble is highlighted by a CBS 60 Minutes video filmed some months ago.

Anatomy of a Bubble

The Great Recession of 2008-2009 alerted us – what goes up, can come down. But are there common patterns in asset bubbles? Can the identification of these patterns help predict the peak and subsequent point of rapid decline?

Macrotrends is an interesting resource in this regard. The following is a screenshot of a Macrotrends chart which, in the original, has interactive features.

Macrotrends.org_The_Four_Biggest_US_Bubbles              

Scaling the NASDAQ, gold, and oil prices in terms of percentage changes from points several years preceding price peaks suggests bubbles share the same cadence, in some sense.

These curves highlight that asset bubbles can occur over significant periods – several years to a decade. This is the part of the seduction. At first, when commentators cry “bubble,” prudent investors stand aside to let prices peak and crash. Yet prices may continue to rise for years, leaving investors increasingly feeling they are “being left behind.”

Here are data from three asset bubbles – the Hong Kong Hang Seng Index, oil prices to refiners (combined), and the NASDAQ 100 Index. Click to enlarge.

BubbleAnatomy

I arrange these time series so their peak prices – the peak of the bubble – coincide, despite the fact that these peaks occurred at different historical times (October 2007, August 2008, March 2000, respectively).

I include approximately 5 years of prior values of each time series, and scale the vertical dimensions so the peaks equal 100 percent.

This produces a chart which suggests three distinct phases to an asset bubble.

Phase 1 is a ramp-up. In this initial phase, prices surge for 2-3 years, then experience a relatively minor drop.

Phase 2 is the beginning of a sustained period of faster-than-exponential growth, culminating in the market peak, followed immediately by the market collapse. Within a few months of the peak, the rates of growth of prices in all three series are quite similar, indeed almost identical. These rates of price growth are associated with “an accelerating acceleration” of growth, in fact – as a study of first and second differences of the rates of growth show.

The critical time point, at which peak price occurs, looks like the point at which traders can see the vertical asymptote just a month or two in front of them, given the underlying dynamics.

Phase 3 is the market collapse. Prices drop maybe 80 percent of the value they rose from the initial point, and rapidly – in the course of 1-2 years. This is sometimes modeled as a “negative bubble.” It is commonly considered that the correction overshoots, and then adjusts back.

There also seems to be a Phase 4, when prices can recover some or perhaps almost all of their lost glory, but where volatility can be substantial.

Predictability

It seems reasonable that the critical point, or peak price, should be more or less predictable, a few months into Phase 2.

The extent of the drop from the peak in Phase 3 seems more or less predictable, also.

The question really is whether the dynamics of Phase 1 are truly informative. Is there something going on in Phase 1 that is different than in immediately preceding periods? Phase 1 seems to “set the stage.”

But there is no question the lure of quick riches involved in the advanced stages of an asset bubble can dazzle the most intelligent among us – and as a case in point, I give you Sir Isaac Newton, co-inventor with Liebnitz of the calculus, discoverer of the law of gravitation, and exponent of a vast new science, in his time, of mathematical physics.

SirIsaacNewton

A post on Business Insider highlights his unhappy case with the South Seas stock bubble. Newton was in this scam early, and then got out. But the Bubble kept levitating, so he entered the market again near the top – in Didier Sornette’s terminology, near the critical point of the process, only to lose what in his time was vast fortune of worth $2.4 million dollars in today’s money.