Category Archives: probability theory

The Arc Sine Law and Competitions

There is a topic I think you can call the “structure of randomness.” Power laws are included, as are various “arcsine laws” governing the probability of leads and changes in scores in competitive games and, of course, in winnings from gambling.

I ran onto a recent article showing how basketball scores follow arcsine laws.

Safe Leads and Lead Changes in Competitive Team Sports is based on comprehensive data from league games over several seasons in the National Basketball Association (NBA).

“..we find that many …statistical properties are explained by modeling the evolution of the lead time X as a simple random walk. More strikingly, seemingly unrelated properties of lead statistics, specifically, the distribution of the times t: (i) for which one team is leading..(ii) for the last lead change..(and (iii) when the maximal lead occurs, are all described by the ..celebrated arcsine law..”

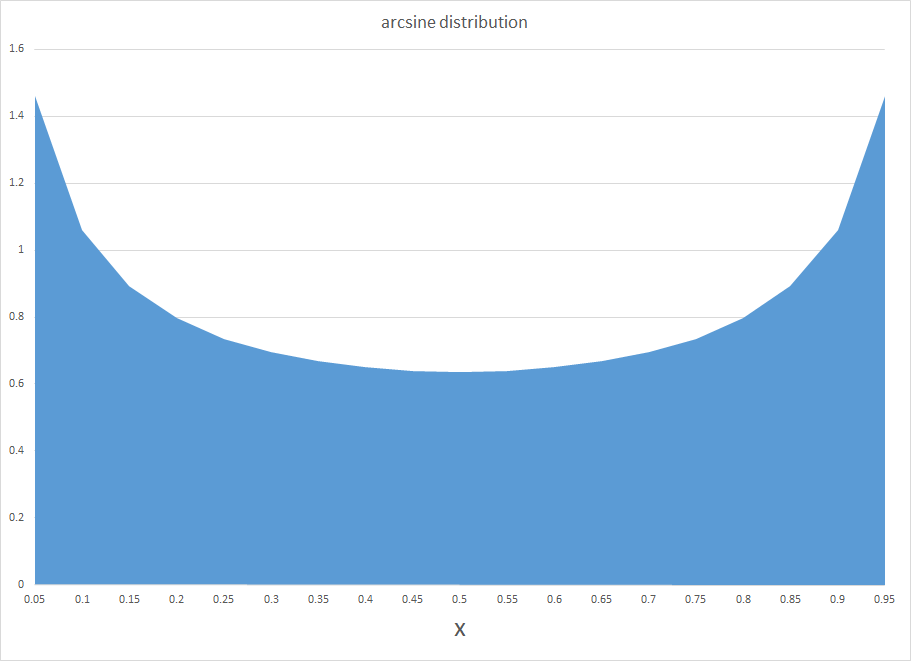
The chart below shows the arcsine probability distribution function (PDF). This probability curve is almost the opposite or reverse of the widely known normal probability distribution. Instead of a bell-shape with a maximum probability in the middle, the arcsine distribution has the unusual property that probabilities are greatest at the lower and upper bounds of the range. Of course, what makes both curves probability distributions is that the area they span adds up to 1.

arcsine

So, apparently, the distribution of time that a basketball team holds a lead in a basketball game is well-described by the arcsine distribution. This means lead changes are most likely at the beginning and end of the game, and least likely in the middle.

An earlier piece in the Financial Analysts Journal (The Arc Sine Law and the Treasure Bill Futures Market) notes,

..when two sports teams play, even though they have equal ability, the arc sine law dictates that one team will probably be in the lead most of the game. But the law also says that games with a close final score are surprisingly likely to be “last minute, come from behind” affairs, in which the ultimate winner trailed for most of the game..[Thus] over a series of games in which close final scores are common, one team could easily achieve a string of several last minute victories. The coach of such a team might be credited with being brilliantly talented, for having created a “second half” team..[although] there is a good possibility that he owes his success to chance.

There is nice mathematics underlying all this.

The name “arc sine distribution” derives from the integration of the PDF in the chart – a PDF which has the formula –

f(x) = 1/(π (x(1-x).5)

Here, the integral of f(x) yields the cumulative distribution function F(x) and involves an arcsine function,

F(x) = 2/(π arcsin(x.5))

Fundamentally, the arcsine law relates to processes where there are probabilities of winning and losing in sequential trials. The PDF follows from the application of Stirling’s formula to estimate expressions with factorials, such as the combination of p+q things taken p at a time, which quickly becomes computationally cumbersome as p+q increases in size.

There is probably no better introduction to the relevant mathematics than Feller’s exposition in his classic An Introduction to Probability Theory and Its Applications, Volume I.

Feller had an unusual ability to write lucidly about mathematics. His Chapter III “Fluctuations in Coin Tossing and Random Walks” in IPTAIA is remarkable, as I have again convinced myself by returning to study it again.

Feller

He starts out this Chapter III with comments:

We shall encounter theoretical conclusions which not only are unexpected but actually come as a shock to intuition and common sense. They will reveal that commonly accepted motions concerning chance fluctuations are without foundation and that the implications of the law of large numbers are widely misconstrued. For example, in various applications it is assumed that observations on an individual coin-tossing game during a long time interval will yield the same statistical characteristics as the observation of the results of a huge number of independent games at one given instant. This is not so..

Most pointedly, for example, “contrary to popular opinion, it is quite likely that in a long coin-tossing game one of the players remains practically the whole time on the winning side, the other on the losing side.”

The same underlying mathematics produces the Ballot Theorem, which states the chances a candidate will be ahead from an early point in vote counting, based on the final number of votes for that candidate.

This application, of course, comes very much to the fore in TV coverage of the results of on-going primaries at the present time. CNN’s initial announcement, for example, that Bernie Sanders beat Hillary Clinton in the New Hampshire primary came when less than half the precincts had reported in their vote totals.

In returning to Feller’s Volume 1, I recommend something like Sholmo Sternberg’s Lecture 8. If you read Feller, you have to be prepared to make little derivations to see the links between formulas. Sternberg cleared up some puzzles for me, which, alas, otherwise might have absorbed hours of my time.

The arc sine law may be significant for social and economic inequality, which perhaps can be considered in another post.

Predicting Financial Crisis – the Interesting Case of Nassim Taleb

Note: This is good post from the old series, and I am re-publishing it with the new citation to Taleb’s book in progress Hidden Risk and a new video.

———————————————–

One of the biggest questions is whether financial crises can be predicted in any real sense. This is a major concern of mine. I was deep in the middle of forecasting on an applied basis during 2008-2010, and kept hoping to find proxies to indicate, for example, when we were coming out of it, or whether it would “double-dip.”

Currently, as noted in this blog, a chorus of voices (commentators, analysts, experts) says that all manner of asset bubbles are forming globally, beginning with the US stock and the Chinese real estate markets.

But does that mean that we can predict the timing of this economic and financial crisis, or are we all becoming “Chicken Littles?”

What we want is well-described by Mark Buchanan, when he writes

The challenge for economists is to find those indicators that can provide regulators with reliable early warnings of trouble. It’s a complicated task. Can we construct measures of asset bubbles, or devise ways to identify “too big to fail” or “too interconnected to fail” institutions? Can we identify the architectural features of financial networks that make them prone to cascades of distress? Can we strike the right balance between the transparency needed to make risks evident, and the privacy required for markets to function?

And, ah yes – there is light at the end of the tunnel –

Work is racing ahead. In the U.S., the newly formed Office of Financial Research has published various papers on topics such as stress tests and data gaps — including one that reviews a list of some 31 proposed systemic-risk measures. The economists John Geanakoplos and Lasse Pedersen have offered specific proposals on measuring the extent to which markets are driven by leverage, which tends to make the whole system more fragile.

The Office of Financial Research (OFR) in the Treasury Department was created by the Dodd-Frank legislation, and it is precisely here Nassim Taleb enters the picture, at a Congressional hearing on formation of the OFR.

   untitled

Mr. Chairman, Ranking Member, Members of the Committee, thank you for giving me the opportunity to testify on the analytical ambitions and centralized risk-management plans of Office of Financial Research (OFR). I am here primarily as a practitioner of risk —not as an analyst but as a decision-maker, an eyewitness of the poor, even disastrous translation of risk research into practice. I spent close to two decades as a derivatives trader before becoming a full-time scholar and researcher in the areas of risk and probability, so I travelled the road between theory and practice in the opposite direction of what is commonly done. Even when I was in full-time practice I specialized in errors linked to theories, and the blindness from the theories of risk management. Allow me to present my conclusions upfront and in no uncertain terms: this measure, if I read it well, aims at the creation of an omniscient Soviet-style central risk manager. It makes us fall into the naive illusion of risk management that got us here —the same illusion has led in the past to the blind accumulation of Black Swan risks. Black Swans are these large, consequential, but unpredicted deviations in the eyes of a given observer —the observer does not see them coming, but, by some mental mechanism, thinks that he predicted them. Simply, there are limitations to our ability to measure the risks of extreme events and throwing government money on it will carry negative side effects. 1) Financial risks, particularly those known as Black Swan events cannot be measured in any possible quantitative and predictive manner; they can only be dealt with nonpredictive ways.  The system needs to be made robust organically, not through centralized risk management. I will keep repeating that predicting financial risks has only worked on computers so far (not in the real world) and there is no compelling reason for that to change—as a matter of fact such class of risks is becoming more unpredictable

A reviewer in the Harvard Business Review notes Taleb is a conservative with a small c. But this does not mean that he is a toady for the Koch brothers or other special interests. In fact, in this Congressional testimony, Taleb also recommends, as his point #3

..risks need to be handled by the entities themselves, in an organic way, paying for their mistakes as they go. It is far more effective to make bankers accountable for their mistakes than try the central risk manager version of Soviet-style central planner, putting hope ahead of empirical reality.

Taleb’s argument has a mathematical side. In an article in the International Journal of Forecasting appended to his testimony, he develops infographics to suggest that fat-tailed risks are intrinsically hard to evaluate. He also notes, correctly, that in 2008, despite manifest proof to the contrary, leading financial institutions often applied risk models based on the idea that outcomes followed a normal or Gaussian probability distribution. It’s easy to show that this is not the case for daily stock and other returns. The characteristic distributions exhibit excess kurtosis, and are hard to pin down in terms of specific distributions. As Taleb points out, the defining events that might tip the identification one way or another are rare. So mistakes are easy to make, and possibly have big effects.

But, Taleb’s extraordinary talent for exposition is on full view in an recent article How To Prevent Another Financial Crisis, coauthored with George Martin. The first paragraphs give us the conclusion,

We believe that “less is more” in complex systems—that simple heuristics and protocols are necessary for complex problems as elaborate rules often lead to “multiplicative branching” of side effects that cumulatively may have first order effects. So instead of relying on thousands of meandering pages of regulation, we should enforce a basic principle of “skin in the game” when it comes to financial oversight: “The captain goes down with the ship; every captain and every ship.” In other words, nobody should be in a position to have the upside without sharing the downside, particularly when others may be harmed. While this principle seems simple, we have moved away from it in the finance world, particularly when it comes to financial organizations that have been deemed “too big to fail.”

Then, the authors drive this point home with a salient reference –

The best risk-management rule was formulated nearly 4,000 years ago. Hammurabi’s code specifies: “If a builder builds a house for a man and does not make its construction firm, and the house which he has built collapses and causes the death of the owner of the house, that builder shall be put to death.” Clearly, the Babylonians understood that the builder will always know more about the risks than the client, and can hide fragilities and improve his profitability by cutting corners—in, say, the foundation. The builder can also fool the inspector (or the regulator). The person hiding risk has a large informational advantage over the one looking for it.

My hat’s off to Taleb. A brilliant example, and the rest of the article bears reading too.

While I have not thrown in the towel when it comes to devising metrics to signal financial crisis, I have to say that thoughts like Taleb’s probability argument occurred to me recently, when considering the arguments over extreme weather events.

Here’s a recent video.