Seasonal sales patterns in the United States are more or less synchronized with Europe, Japan, China, and, to a lesser extent, the rest of the world.
Here are some stylized facts:
- Sales tend to peak at the end of the calendar year. This is the well-known “Christmas effect,” and is a strong enough factor to “cannibalize” demand, to an extent, at the first of the following year.
- Sales of final goods tend to be lower – in terms of growth rates and, in some cases, absolutely, in the first calendar quarter of the year.
- Supply chain effects, related to pulses of sales of final goods, can be identified for various lines of production depending on production lead times. Semiconductor orders, for example, tend to peak earlier than sales of consumer electronics, which are sharply influenced by the Christmas season.
To validate this picture, let me offer some evidence.
First, consider retail and food service sales data for the US, a benchmark of consumer activity – the recently discussed data downloaded from FRED.
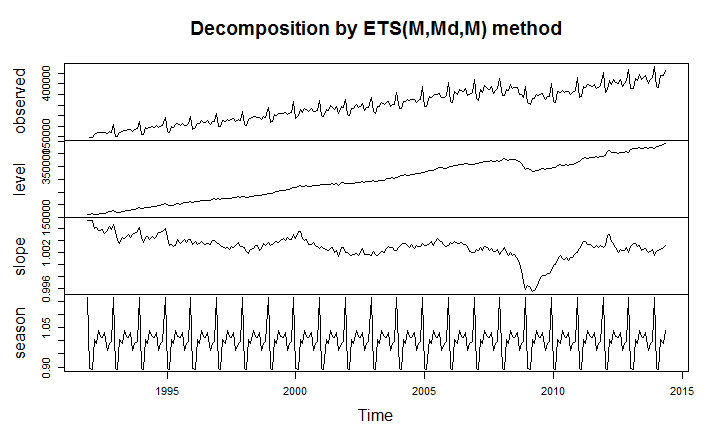
Applying the automatic model selection of the Hyndman R Forecast package, we get a decomposition of this time series into level, trend, and seasonals, as shown in the following diagram.
The optimal exponential smoothing forecast model is a model with a damped trend and multiplicative seasonals.
If we look at the lower part of this diagram, we see that the seasonal factor for December – which is shown by the major peaks in the curve – is a multiple of more than 1.15. On the other hand, the immediately following month – January – shows a multiple of 0.9. These factors are multiplied into the product of the level and trend to get the sales for December and January. In other words, you can suppose that, roughly speaking, December retail sales will be 15 percent above trend, while January sales will be 90 percent of trend.
And, if you inspect this diagram in the lower panel carefully, you can detect the lull in late summer and fall in retail sales.
With “just-in-time” inventories and lean production models, actual production activity closely tracks these patterns in final demand – although it does take some lead time to produce stuff.
These stylized facts have not changed in their outlines since the ground-breaking research of Jeffrey Miron in the the late 1980’s. Miron refers to a worldwide seasonal cycle in aggregate economic activity whose major features are a fourth quarter boom in output.., a third quarter trough in manufacturing production, and a first quarter trough in all economic activity.
The Effects of Different Calendars – the Chinese New Year and Ramadan
The Gregorian calendar has achieved worldwide authority, and almost every country follows on the conventions of counting the year (currently 2014).
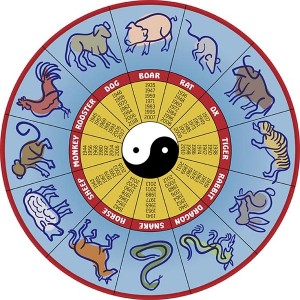
The Chinese calendar, however, is still important for determining the timing of festivals for Chinese communities around the world, and, especially, in China.
Similarly, the Islamic calendar governs the timing of important ritual periods and religious festivals – such as the month of Ramadan, which falls in June and July in 2014.
Because these festival periods overlap with multiple Gregorian months, there can be significant localized impacts on estimates of seasonal variation of economic activity.
Taiwanese researchers looking at this issue find significant holiday effects, related the fact that,
The three most important Chinese holidays, Chinese New Year, the Dragon-boat Festival, and Mid-Autumn Holiday have dates determined by a lunar calendar and move between two solar months. Consumption, production, and other economic behavior in countries with large Chinese population including Taiwan are strongly affected by these holidays. For example, production accelerates before lunar new year, almost completely stops during the holidays and gradually rises to an average level after the holidays.
Similarly, researchers in Pakistan consider the impacts of the Islamic festivals on standard macroeconomic and financial time series.


