
Well, using EasyFit from Mathwave, I fit a Laplace distribution to the residuals of the regression on S&P daily returns I discussed yesterday.
Here is the result.
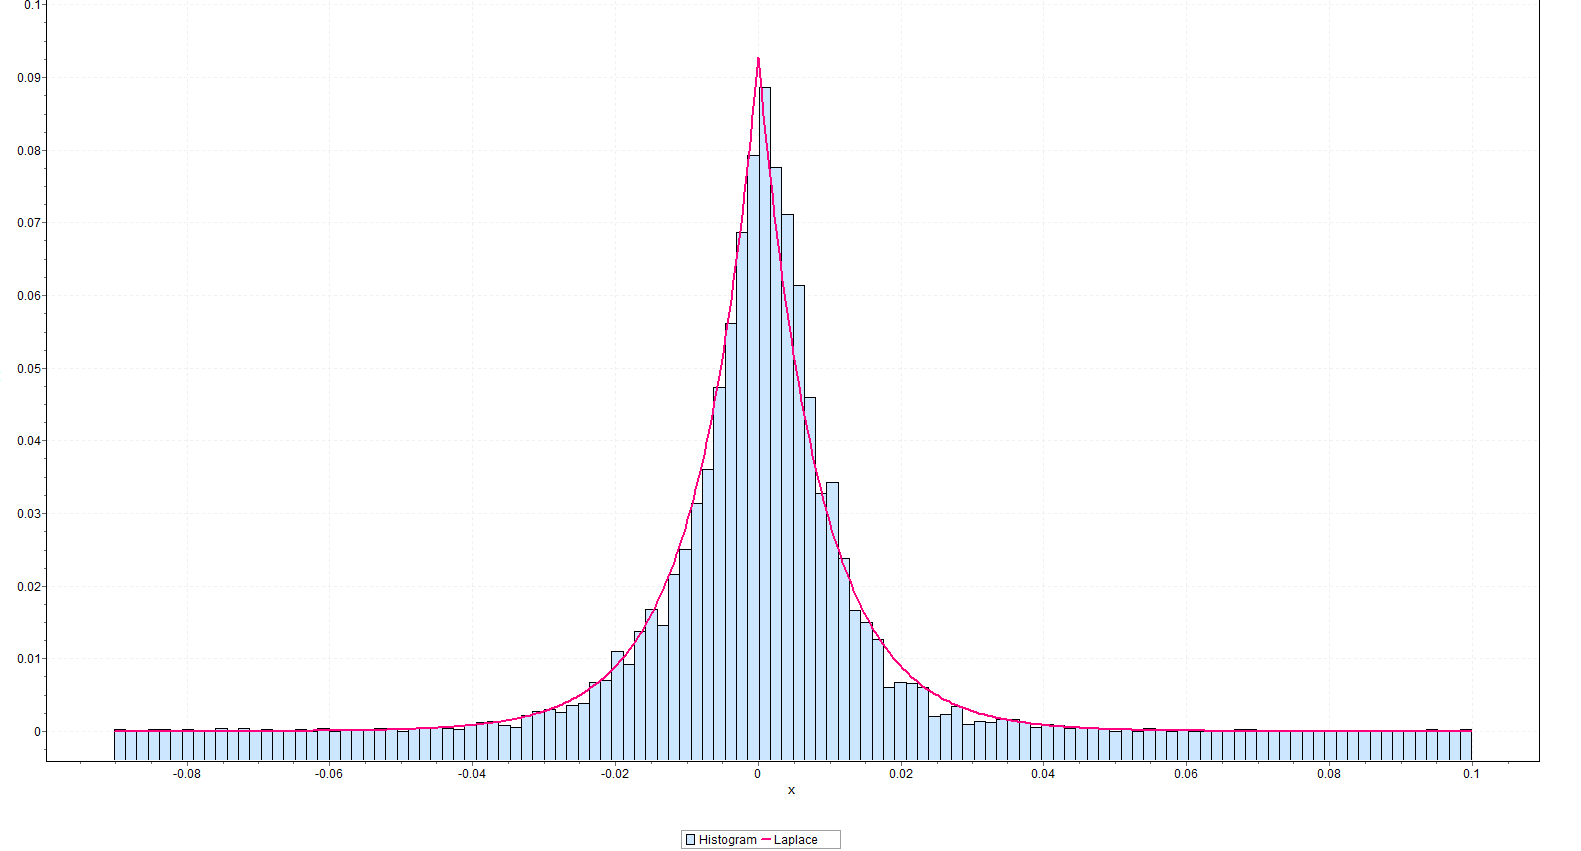
This beats a normal distribution hands down. It also appears to beat the Matlab fit of a t distribution, but I have to run down more details on forms of the t-distribution to completely understand what is going on in the Matlab setup.
Note that EasyFit is available for a free 30-day trial download. It’s easy to use and provides metrics on goodness of fit to make comparisons between distributions.
There is a remarkable book online called The Laplace Distribution and Generalizations. If you have trouble downloading it from the site linked here, Google the title and find the download for a free PDF file.
This book, dating from 2001, runs to 458 pages, has a good introductory discussion, extensive mathematical explorations, as well as applications to engineering, physical science, and finance.
The French mathematical genius Pierre Simon Laplace proposed the distribution named after him as a first law of errors when he was 25, before his later discussions of the normal distribution.
The normal probability distribution, of course, “took over” – in part because of its convenient mathematical properties and also, probably, because a lot of ordinary phenomena are linked with Gaussian processes.
John Maynard Keynes, the English economist, wrote an early monograph (Keynes, J.M. (1911). The principal averages and the laws of error which lead to them, J. Roy. Statist. Soc. 74, New Series, 322-331) which substantially focuses on the Laplace distribution, highlighting the importance it gives to the median, rather than average, of sample errors.
The question I’ve struggled with is “why should stock market trading, stock prices, stock indexes lead, after logarithmic transformation and first differencing to the Laplace distribution?”
Of course, the Laplace distribution can be generated as a difference of exponential distributions, or as combination of a number of distributions, as the following table from Kotz, Kozubowski, and Podgorski’s book shows.
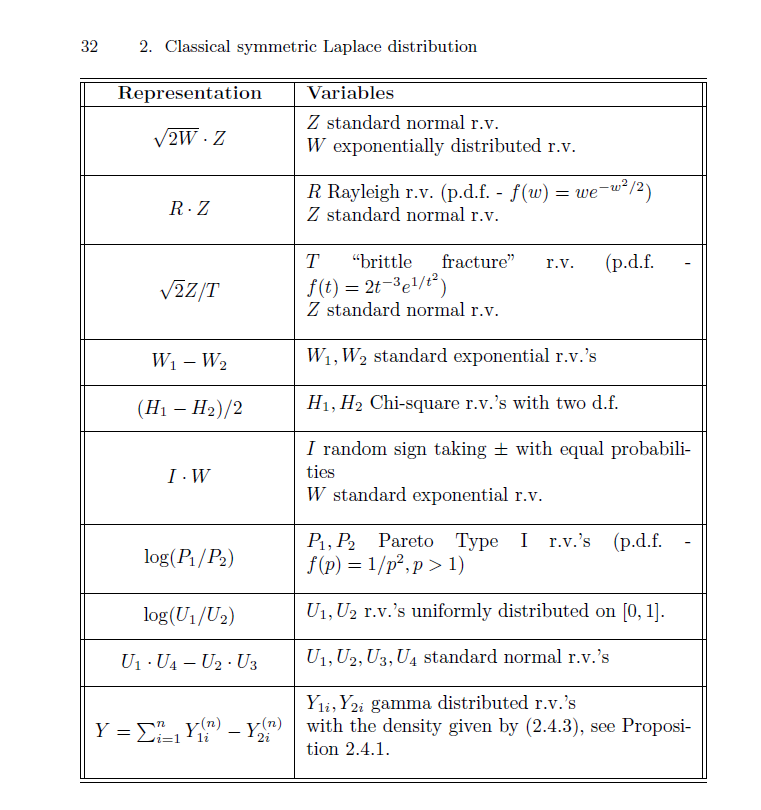
This is all very suggestive, but how can it be related to the process of trading?
Indeed, there are quite a number of questions which follow from this hypothesis – that daily trading activity is fundamentally related to a random component following a Laplace distribution.
What about regression, if the error process is not normally distributed? By following the standard rules on “statistical significance,” might we be led to disregard variables which are drivers for daily returns or accept bogus variables in predictive relationships?
Distributional issues are important, but too frequently disregarded.
I recall a blog discussion by a hedge fund trader lamenting excesses in the application of the Black-Scholes Theorem to options in 2007 and thereafter.
Possibly, the problem is as follows. The residuals of autoregressions on daily returns and their various related transformations tend to cluster right around zero, but have big outliers. This clustering creates false confidence, making traders vulnerable to swings or outliers that occur much more frequently than suggested by a normal or Gaussian error distribution.