The reason why most people would be interested in and concerned with exponential smoothing (ES) is that it is an effective forecasting technique.
So, with that in mind, I want to discuss two automatic forecasting programs – Forecast Pro and Hyndman’s Forecast program for R – applied to a monthly time series for public construction spending in the US. I do this more or less “black box” in that I am not spending a lot of time on the underlying theory – which is basically a state space model framework – but focus on the process of getting the forecasts and their comparison.
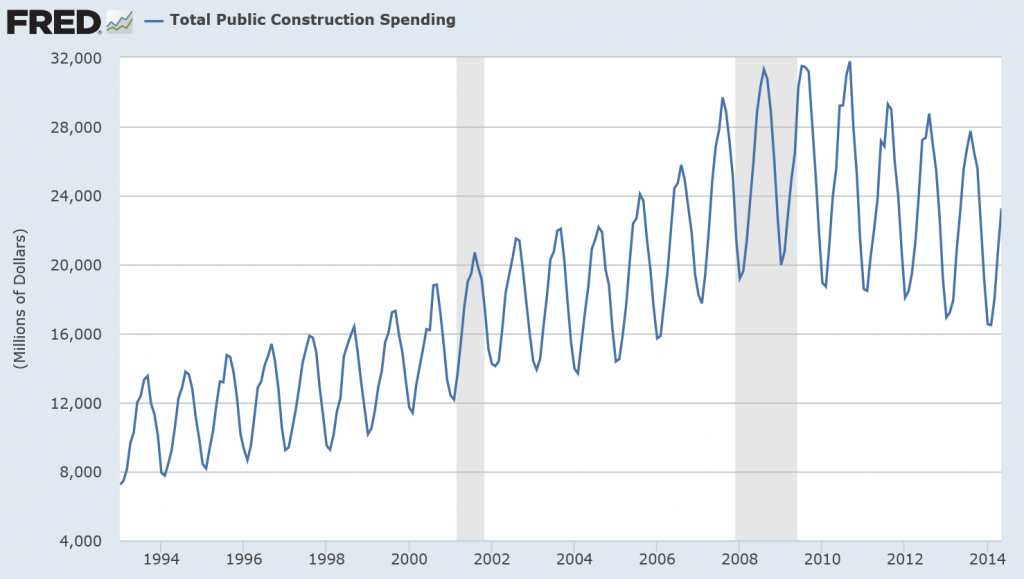
I am testing these programs with a backcasting exercise. Thus, the data for this time series, available from FRED begin January 1993 and extend through May 2014. However, I only use data up to May 2010 to develop forecasting models with these programs. Then, I can compare the forecasts from the models with actual values. So instead of forecasting, you might say I am backcasting. Sometimes this is also called retrodiction, in contrast to prediction.

My plan is to feed both programs data up to and including May 2010, in order to forecast values for the next 24 months.
Forecast Pro
Data input is the first step, and this can be accomplished with Forecast Pro by means of an Excel spreadsheet. There are requirements for how you lay out the data. Basically, the first column, below the first six rows, can contain dates. The first time series is placed in the second column, after noting its name and description, the starting year, starting period (month, quarter, etc), periods per year, and any information on cycles. Then, of course, you store the spreadsheet in a directory where the program can pick it up – but all that is covered in the Forecast Pro manual.
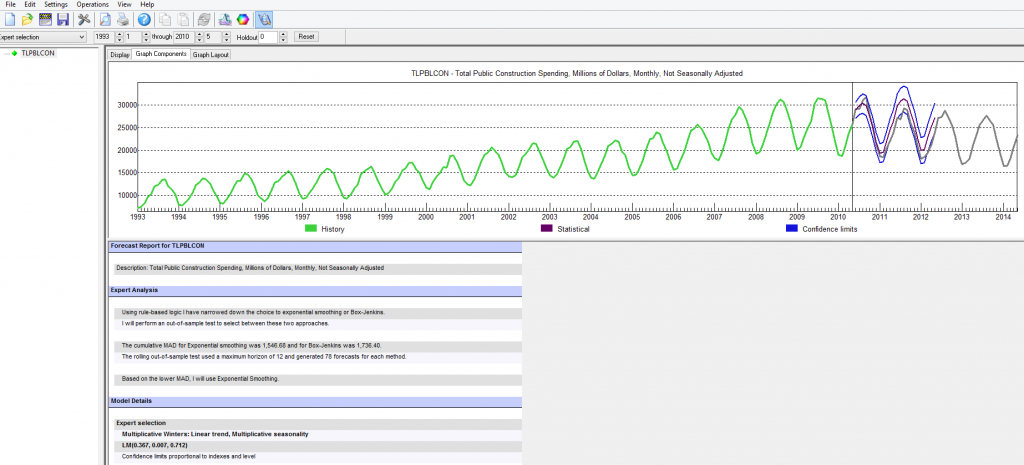
Here’s what the program panel looks like, after you trigger the automatic forecasting procedure (click to enlarge).

So basically you see a graph of the historic data you are feeding into the program. If you look down to Model Details you will see that expert selection picked a multiplicative Winters linear trend, multiplicative seasonality model. The estimated parameters are then given.
Above this, under Expert Analysis, the screen tells you that it looked at both Box-Jenkins (ARIMA) and ES models, picking the ES model based on out-of-sample tests.
Further down on this screen (not shown), the program lists the forecasts, which are graphed with confidence intervals above (shown).
I’ll discuss these forecasts, but first let me say a few words about the Hyndman R Forecast package analysis.
The Hyndman R Forecast Package
R is very big in some of the enterprise IT outfits. I have friends, for example, who view it as essential, and who have helped me recently come up to speed, to an extent, in using it.
After some fumbling around, I settled on running my R programs in R Studio. There is something called the Comprehensive R Archive Network (CRAN) with important open source R programs. Hyndman et al have their Forecast program listed there, and it pops up in R Studio, which is hugely convenient.
Again, there is an issue of data input. In this case, correctly positioning a csv spreadsheet file works well.
The R code I used to generate ES forecasts is as follows:

Note I screw up the spelling of ExponentialSmooth in naming the subdirectory. Oh well.
So after you import the csv file with the read command, you convert it to a time series format. Then, you can apply the operation ets(.) to the time series file, producing the parameters of the optimal ES model, based on comparisons of Akaike information criteria from the maximum likelihood estimations used to calculate the parameters of all the models.
Forecast selects ETS(M,Ad,M) as the optimal model. This indicates an additive trend is used, but is damped, and that the seasonal effects are multiplicative – more or less as in the Forecast Pro analysis.
The Forecasts
I called for 24 months of forecasts from both programs.
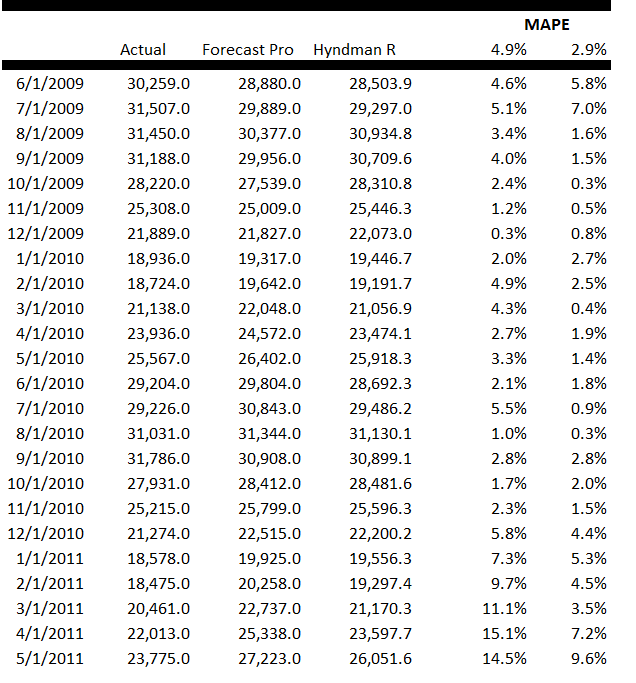
Here is a table comparing the forecasts from both packages with the actual values of this public construction time series.

The Hyndman et al R Forecast package produces significantly lower Mean Absolute Percentage Error (MAPE) than Forecast Pro in these forecasts – 2.9% compared with 4.9%.
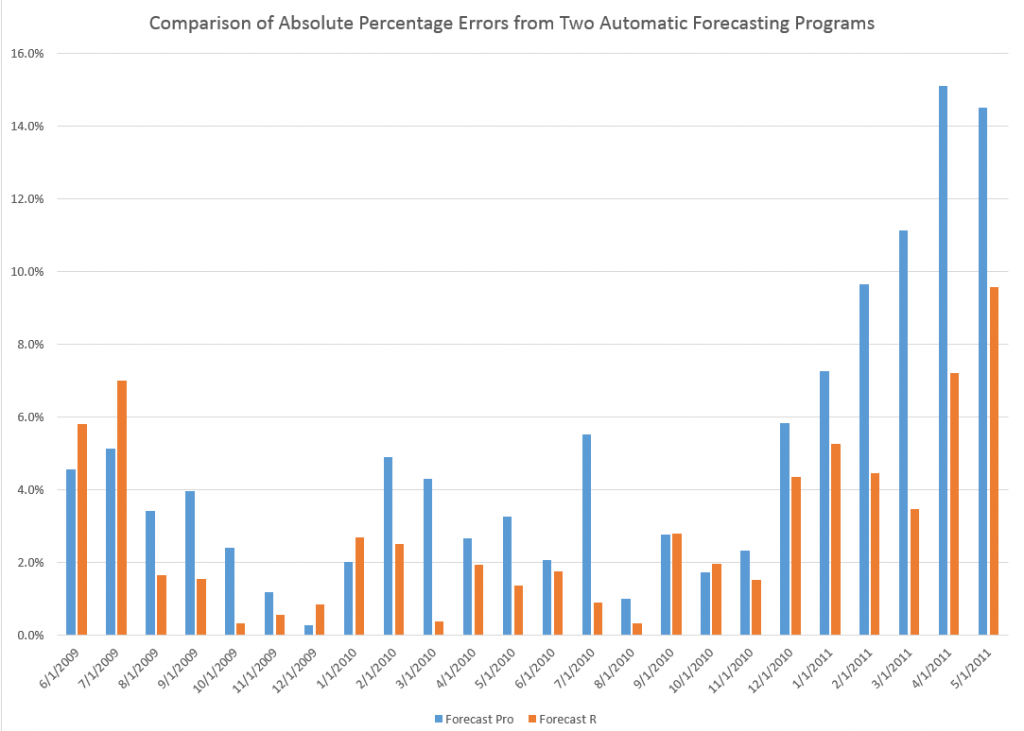
Here is a chart comparing the absolute percent error by month over the forecast horizon.

Conclusions
This particular example is a case of random selection. I really have not run other forecasts with this data and these two models, except for actual future projections. So it’s interesting that an explicitly damped linear trend applied to these data generates a superior forecast to whatever it is that Forecast Pro does.
But readers should be aware that, in many instances, Forecast Pro can slightly outperform the R Forecast program, as Hyndman and coauthors document in a critical paper on this automatic forecasting setup in R.
However, the performance of the two programs is very similar.
In general, I would suggest that non-mathematical users, or folks not used to developing computer programs, stick with Forecast Pro, probably getting the company or organization you work for to pony up several hundred to several thousand dollars to get what you need for the scale of the forecasting problem at hand. Incidentally, I should be getting commissions for boosting this program, as often as I do, but I have no connection with the company.
For more mathematically sophisticated users, I strongly recommend getting up to speed on the R Forecast package and other R packages.
Both would be nice to use together. The R programs can support an interesting research effort, doing all sorts of clever things like fitting splines to the data, boosting, and bagging. Forecast Pro on the other hand is great if you have to produce a large number of forecasts and do not have time to dwell too much on the details of each series.


