Category Archives: forecasting controversy

Stock Market Price Predictability, Random Walks, and Market Efficiency

Can stock market prices be predicted? Can they be predicted with enough strength to make profits?

The current wisdom may be that market predictability is like craps. That is, you might win (correctly predict) for a while, maybe walking away with nice winnings, if you are lucky. But over the long haul, the casino is the winner.

This seems close to the view in Andrew P. Lo and Craig MacKinlay’s A NonRandom Walk Down Wall Street (NRW), a foil to Burton Malkiel’s A Random Walk Down Wall Street, perhaps.

Lo and MacKinlay (L&M) collect articles from the 1980’s and 1990’s – originally published in the “very best journals” – in a 2014 compilation with interesting intoductions and discussions.

Their work more or less conclusively demonstrates that US stock market prices are not, for identified historic periods, random walks.

The opposite idea – that stock prices are basically random walks – has a long history, “recently” traceable to the likes of Paul Samuelson, as well as Burton Malkiel. Supposedly, any profit opportunity in a deeply traded market will be quickly exploited, leaving price movements largely random.

The ringer for me in this whole argument is the autocorrelation (AC) coefficient.

The first order autocorrelation coefficient of a random walk is 1, but metrics derived from stock price series have positive first order autocorrelations less than 1 over daily or weekly data. In fact, L&M were amazed to discover the first order autocorrelation coefficient of weekly stock returns, based on CRSP data, was 30 percent and statistically highly significant. In terms of technical approach, a key part of their analysis involves derivation of asymptotic limits for distributions and confidence intervals, based on assumptions which encompass nonconstant (heteroskedastic) error processes.

Finding this strong autocorrelation was somewhat incidental to their initial attack on the issue of the randomness, which is based on variance ratios.

L&M were really surprised to discover significant AC in stock market returns, and, indeed, several of their articles explore ways they could be wrong, or things could be different than what they appear to be.

All this is more than purely theoretical, as Morgan Stanley and D.P. Shaw’s development of “high frequency equity trading strategies” shows. These strategies exploit this autocorrelation or time dependency through “statistical arbitrage.” By now, though, according to the authors, this is a thin-margin business, because of the “proliferation of hedge funds engaged in these activities.”

Well, there are some great, geeky lines for cocktail party banter, such as “rational expectations equilibrium prices need not even form a martingale sequence, of which the random walk is special case.”

By itself, the “efficient market hypothesis” (EFM) is rather nebulous, and additional contextualization is necessary to “test” the concept. This means testing several joint hypotheses. Accordingly, negative results can simply be attributed to failure of one or more collateral assumptions. This builds a protective barrier around the EFM, allowing it to retain its character as an article of faith among many economists.

AWL

Andrew W. Lo is a Professor of Finance at MIT and Director of the Laboratory for Financial Engineering. His site through MIT lists other recent publications, and I would like to draw readers’ attention to two:

Can Financial Engineering Cure Cancer?

Reading About the Financial Crisis: A Twenty-One-Book Review

Forecasting Controversy Swirling Around Computer Models and Forecasts

I am intrigued by Fabius Maximus’ We must rely on forecasts by computer models. Are they reliable?

This is a broad, but deeply relevant, question.

With the increasing prominence of science in public policy debates, the public’s beliefs about theories also have effects. Playing to this larger audience, scientists have developed an effective tool: computer models making bold forecasts about the distant future. Many fields have been affected, such as health care, ecology, astronomy, and climate science. With their conclusions amplified by activists, long-term forecasts have become a powerful lever to change pubic opinion.

It’s true. Large scale computer models are vulnerable to confirmation bias in their construction and selection – example being the testing of drugs. There are issues of measuring their reliability and — more fundamentally — validation (e.g., falsification).

Peer-review has proven quite inadequate to cope with these issues (which lie beyond the concerns about peer-review’s ability to cope with even standard research). A review or audit of a large model often requires over a man-years or more of work by a multidisciplinary team of experts, the kind of audit seldom done even on projects of great public concern.

Of course, FM is sort of famous, in my mind, for their critical attitude toward global warming and climate change.

And they don’t lose an opportunity to score points about climate science, citing the Georgia Institute of Technology scientist Judith Curry.

Dr. Curry is author of a recent WSJ piece The Global Warming Statistical Meltdown

At the recent United Nations Climate Summit, Secretary-General Ban Ki-moon warned that “Without significant cuts in emissions by all countries, and in key sectors, the window of opportunity to stay within less than 2 degrees [of warming] will soon close forever.” Actually, this window of opportunity may remain open for quite some time. A growing body of evidence suggests that the climate is less sensitive to increases in carbon-dioxide emissions than policy makers generally assume—and that the need for reductions in such emissions is less urgent.

A key issue in this furious and emotionally-charged debate is discussed in my September blogpost CO2 Concentrations Spiral Up, Global Temperature Stabilizes – Was Gibst?

..carbon dioxide (CO2) concentrations continue to skyrocket, while global temperature has stabilized since around 2000.

The scientific consensus (excluding Professor Curry and the climate change denial community) is that the oceans currently are absorbing the excess heat, but this cannot continue forever.

If my memory serves me (and I don’t have time this morning to run down the link), backtesting the Global Climate Models (GCM) in a recent IPCC methodology publication basically crashed and burned – but the authors blithely moved on to re-iterate the “consensus.”

At the same time, the real science behind climate change – the ice cores for example retrieved from glacial and snow and ice deposits of long tenure – do show abrupt change may be possible. Within a decade or two, for example, there might be regime shifts in global climate.

I am not going to draw conclusions at this point, wishing to carry on this thread with some discussion of macroeconomic models and forecasting.

But I leave you today with my favorite viewing of Blalog’s “Chasing Ice.”

Updates on Forecasting Controversies – Google Flu Trends

Last Spring I started writing about “forecasting controversies.”

A short list of these includes Google’s flu forecasting algorithm, impacts of Quantitative Easing, estimates of energy reserves in the Monterey Shale, seasonal adjustment of key series from Federal statistical agencies, and China – Trade Colossus or Assembly Site?

Well, the end of the year is a good time to revisit these, particularly if there are any late-breaking developments.

Google Flu Trends

Google Flu Trends got a lot of negative press in early 2014. A critical article in Nature – When Google got flu wrong – kicked it off. A followup Times article used the phrase “the limits of big data,” while the Guardian wrote of Big Data “hubris.”

The problem was, as the Google Trends team admits –

In the 2012/2013 season, we significantly overpredicted compared to the CDC’s reported U.S. flu levels.

Well, as of October, Google Flu Trends has a new engine. This like many of the best performing methods … in the literature—takes official CDC flu data into account as the flu season progresses.

Interestingly, the British Royal Society published an account at the end of October – Adaptive nowcasting of influenza outbreaks using Google searches – which does exactly that – merges Google Flu Trends and CDC data, achieving impressive results.

The authors develop ARIMA models using “standard automatic model selection procedures,” citing a 1998 forecasting book by Hyndman, Wheelwright, and Makridakis and a recent econometrics text by Stock and Watson. They deploy these adaptively-estimated models in nowcasting US patient visits due to influenza-like illnesses (ILI), as recorded by the US CDC.

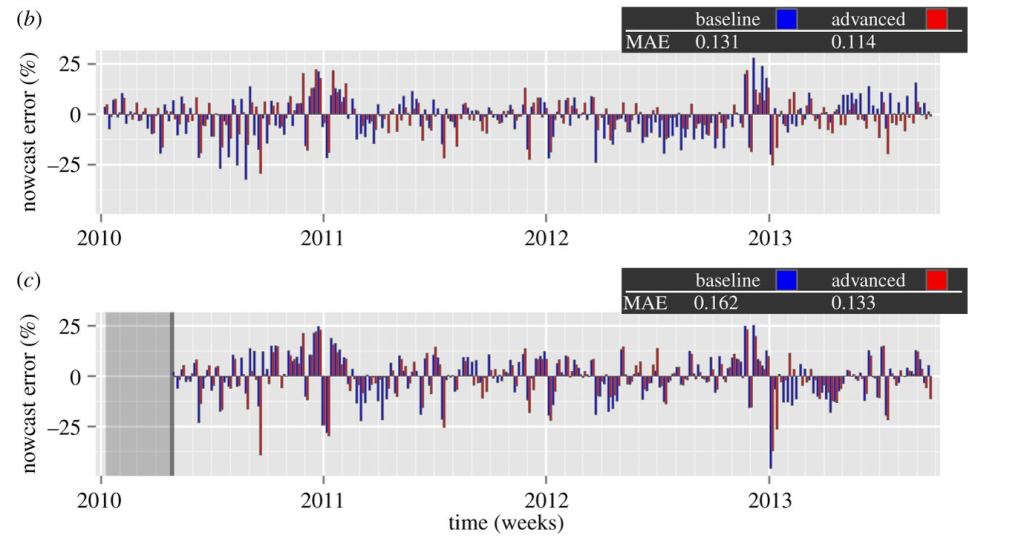
The results are shown in the following panel of charts.

GoogleFluTrends

Definitely click on this graphic to enlarge it, since the key point is the red bars are the forecast or nowcast models incorporating Google Flu Trends data, while the blue bars only utilize more conventional metrics, such as those supplied by the Centers for Disease Control (CDC). In many cases, the red bars are smaller than the blue bar for the corresponding date.

The lower chart labeled ( c ) documents out-of-sample performance. Mean Absolute Error (MAE) for the models with Google Flu Trends data are 17 percent lower.

It’s relevant , too, that the authors, Preis and Moat, utilize unreconstituted Google Flu Trends output – before the recent update, for example – and still get highly significant improvements.

I can think of ways to further improve this research – for example, deploy the Hyndman R programs to automatically parameterize the ARIMA models, providing a more explicit and widely tested procedural referent.

But, score one for Google and Hal Varian!

The other forecasting controversies noted above are less easily resolved, although there are developments to mention.

Stay tuned.