Category Archives: forecasting interest rates

Negative Nominal Interest Rates – the European Central Bank Experiment

Larry Summers, former US Treasury Secretary and, earlier, President of Harvard delivered a curious speech at an IMF Economic Forum last year. After nice words about Stanley Fischer, currently Vice Chair of the Fed, Summers entertains the notion of negative interest rates to combat secular stagnation and restore balance between aggregate demand and supply at something like full employment.

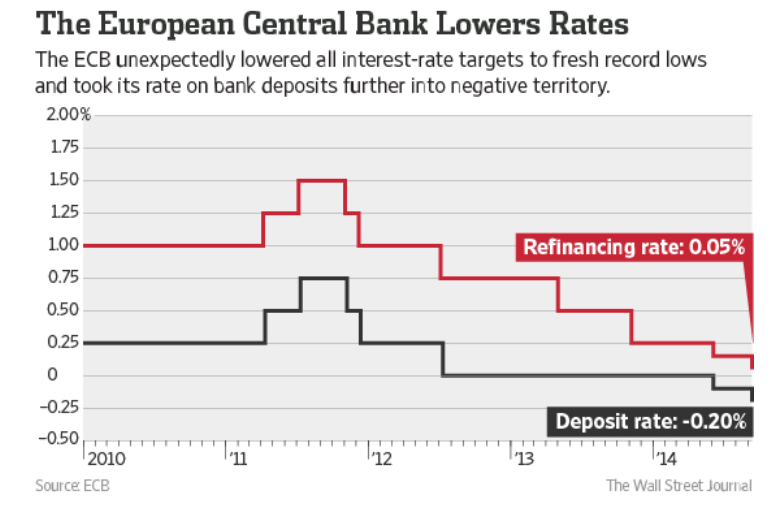
Fast forward to June 2014, when the European Central Bank (ECB) pushes the interest rate on deposits European banks hold in the ECB into negative territory. And on September 4, the ECB drops the deposit rates further to -0.2 percent, also reducing a refinancing rate to virtually zero.

ECBnegint

The ECB discusses this on its website – Why Has the ECB Introduced a Negative interest Rate. After highlighting the ECB mandate to ensure price stability by aiming for an inflation rate of below but close to 2% over the medium term, the website observes euro area inflation is expected to remain considerably below 2% for a prolonged period.

This provides a rationale for lower interest rates, of which there are principally three under ECB control – a marginal lending facility for overnight lending to banks, the main refinancing operations and the deposit facility.

Note that the main refinancing rate is the rate at which banks can regularly borrow from the ECB while the deposit rate is the rate banks receive for funds parked at the central bank.

The ECB is adjusting interest rates under their control across the board, as suggested by the chart, but worries that to maintain a functioning money market in which commercial banks lend to each other, these rates cannot be too close to each other.

So, bottom line, the deposit rate was lowered to − 0.10 % in June to maintain this corridor, and then further as the refinancing rate was dropped to -.05 percent.

The hope is that lower refinancing rates will mean lower rates for customers for bank loans, while negative deposit rates will act as a disincentive for banks to simply park excess reserves in the ECB.

Nominal Versus Real Interest Rates and Bond Yields

If you want to prep for, say, negative yields on two year Irish bonds, or issuance of various European bonds with negative yield, as well as the negative yields of a variety of US securities in recent years, after inflation, check out How Low Can You Go? Negative Interest Rates and Investors’ Flight to Safety.

An asset can generate a negative yield, on a conventional, rather than catastrophic basis, in a nominal or real, which is to say, inflation-adjusted, sense.

Some examples of negative real interest rates of yields –

The yield to maturity on the 5-year Treasury note has been below 2 percent since July 2010, and the yield to maturity on the 10-year Treasury note has been below 2 percent since May 2012. Yet, looking forward, the Federal Open Market Committee in January 2012 announced an inflation target of 2 percent—implying an anticipated negative real yield over the life of the securities. Investors, facing uncertainty, appear willing to pay the U.S. government—when measured in real, ex post inflation-adjusted dollars—for the privilege of owning Treasury securities.

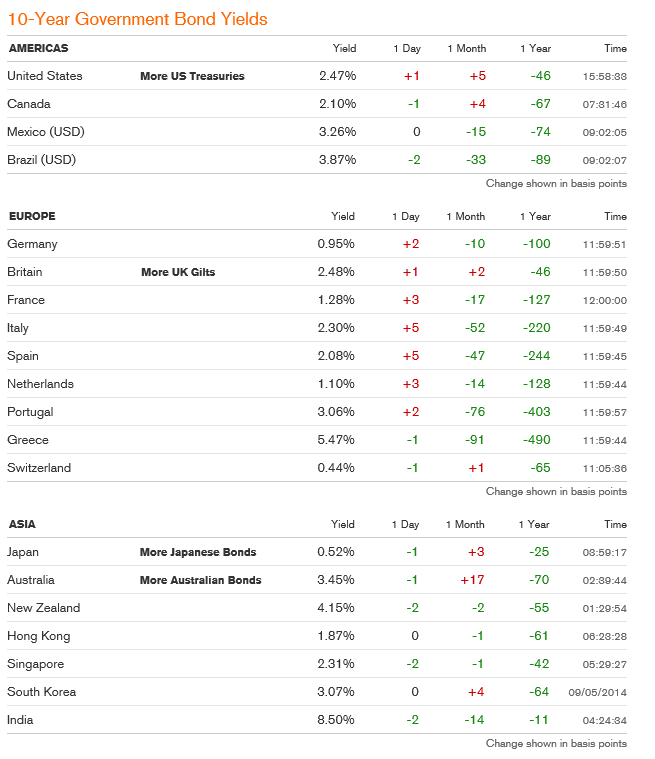
And the current government bond yield situation, from Bloomberg, shows important instances of negative yields, notably Germany and Japan – two of the largest global economies. Click to enlarge.

bondyields

Where the ECB Goes From Here

Mario Draghi, ECB head, gave a speech clearly stating monetary policy is not enough, at the recent Jackson Hole conference of central bankers. After this, the financial press was abuzz with the idea Draghi is moving toward the Japanese leader Abe’s formulation in which there are three weapons or arrows in the Japanese formulation– monetary policy, fiscal policy and structural reforms.

The problem, in the case of the Eurozone, is achieving political consensus for fiscal policies such as backing bonds for badly needed infrastructure development. German opposition seems to be sustained and powerful.

Because of the “political economy” factors , currency and banking problems in the Eurozone are probably more complicated and puzzling than many business executives and managers, looking for a take on the situation, would prefer.

A Thought Experiment

Before diving into this conceptually hazardous topic, though, I’d like to pose a puzzle for readers.

Can banks realistically “charge” negative interest rates to commercial customers?

I seem to have cooked up a spreadsheet where such loans could pay a rate of positive real return to banks, if the rate of deflation can be projected.  In one variant, the bank collects a lending fee at the outset and then the interest rate for installments is negative.

The “save” for banks is that future deflation could inflate the real value of declining nominal installment payments, creating a present value of this stream of payments which is greater than the simple sum of such payments.

I’m not ready for primetime television with this, but it seems such a world encapsulates a very dour view of the future – one that may not be too far from the actual situation in Europe and Japan.

Money black hole at top from Conservative Read

The Interest Elasticity of Housing Demand

What we really want to know, in terms of real estate market projections, is the current or effective interest elasticity of home sales.

So, given that the US Federal Reserve has embarked on the “taper,” we know long term interest rates will rise (and have since the end of 2012).

What, then, is the likely impact of moving the 30 year fixed mortgage rate from around 4 percent back to its historic level of six percent or higher?

What is an Interest Elasticity?

Recall that the concept of a demand elasticity here is the percentage change in demand – this case housing sales, divided by the percentage change in the mortgage interest rate.

Typically, thus, the interest elasticity of housing demand is a negative number, indicating that higher interest rates result in lower housing demand, other things being equal.

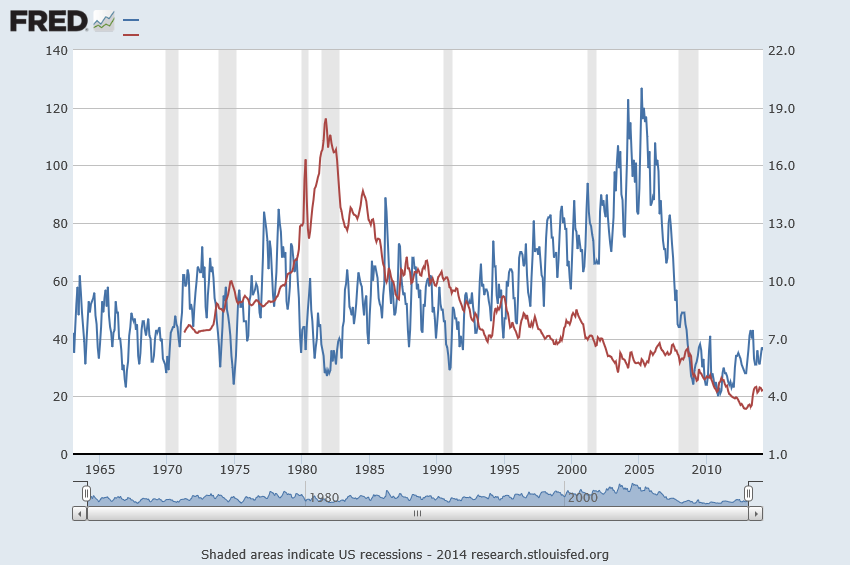
This “other things being equal” (ceteris paribus) is the hooker, of course, as is suggested by the following chart from FRED.

30mortsale

Here the red line is the 30 year fixed mortgage rate (right vertical axis) and the blue line is housing sales (left vertical axis).

A Rough and Ready Interest Rate Elasticity

Now the thing that jumps out at you when you glance over these two curves is the way housing sales (the blue line) drops when the 30 year fixed mortgage rate went through the roof in about 1982, reaching a peak of nearly 20 percent.

After the rates came down again in about 1985, an approximately 20 year period of declining mortgage interest rates ensued – certainly with bobbles and blips in this trend.

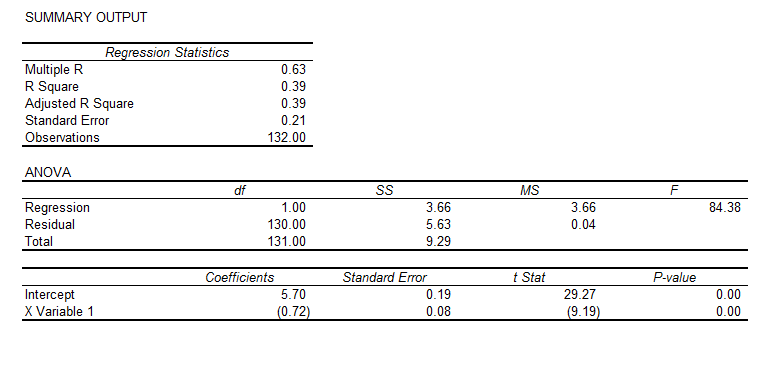
Now suppose we take just the period 1975-85, and calculate a simple interest rate elasticity. This involves getting the raw numbers behind these lines on the chart, and taking log transformations of them. We calculate the regression,

interestelasticityregThis corresponds to the equation,

ln(sales)=   5.7   –   0.72*ln(r)

where the t-statistics of the constant term and coefficient of the log of the interest rate r are highly significant, statistically.

This equation implies that the interest elasticity of housing sales in this period is -0.72. So a 10 percent increase in the 30-year fixed mortgage rate is associated with an about 7 percent reduction in housing sales, other things being equal.

In the spirit of heroic generalization, let’s test this elasticity by looking at the reduction in the mortgage rate after 1985 to 2005, and compare this percent change with the change in the housing sales over this period.

So at the beginning of 1986, the mortgage rate was 10.8 and sales were running 55,000 per month. At the end of 2005, sales had risen to 87, 000 per month and the 30 year mortgage rate for December was 6.27.

So the mortgage interest rates fell by 53 percent and housing sales rose 45 percent – calculating these percentage changes over the average base of the interest rates and house sales. Applying a -0.72 price elasticity to the (negative) percent change in interest rates suggests an increase in housing sales of 38 percent.

That’s quite remarkable, considering other factors operative in this period, such as consistent population growth.

OK, so looking ahead, if the 30 year fixed mortgage rate rises 33 percent to around 6 percent, housing sales could be expected to drop around 20-25 percent.

Interestingly, recent research conducted at the Wharton School and the Board of Governors of the Federal Reserve suggests that,

The relationship between the mortgage interest rate and a household’s demand for mortgage debt has important implications for a host of public policy questions. In this paper, we use detailed data on over 2.7 million mortgages to provide novel estimates of the interest rate elasticity of mortgage demand. Our empirical strategy exploits a discrete jump in interest rates generated by the conforming loan limit|the maximum loan size eligible for securitization by Fannie Mae and Freddie Mac. This discontinuity creates a large notch” in the intertemporal budget constraint of prospective mortgage borrowers, allowing us to identify the causal link between interest rates and mortgage demand by measuring the extent to which loan amounts bunch at the conforming limit. Under our preferred specifications, we estimate that 1 percentage point increase in the rate on a 30-year fixed-rate mortgage reduces first mortgage demand by between 2 and 3 percent. We also present evidence that about one third of the response is driven by borrowers who take out second mortgages while leaving their total mortgage balance unchanged. Accounting for these borrowers suggests a reduction in total mortgage debt of between 1.5 and 2 percent per percentage point increase in the interest rate. Using these estimates, we predict the changes in mortgage demand implied by past and proposed future increases to the guarantee fees charged by Fannie and Freddie. We conclude that these increases would directly reduce the dollar volume of new mortgage originations by well under 1 percent.

So a 33 percent increase in the 30 year fixed mortgage rate, according to this analysis, would reduce mortgage demand by well under 33 percent. So how about 20-25 percent?

I offer this “take-off” as an example of an exploratory analysis. Thus, the elasticity estimate developed with data from the period of greatest change in rates provides a ballpark estimate of the change in sales over a longer period of downward trending interest rates. This supports a forward projection, which, at a first order approximation seem consistent with estimates from a completely different line of analysis.

All this suggests a more comprehensive analysis might be warranted, taking into account population growth, inflation, and, possibly, other factors.

The marvels of applied economics in a forecasting context.

Lead picture courtesy of the University of Maryland Department of Economics.

Interest Rates – 3

Can interest rates be nonstationary?

This seems like a strange question, since interest rates are bounded, except in circumstances, perhaps, of total economic collapse.

“Standard” nonstationary processes, by contrast, can increase or decrease without limit, as can conventional random walks.

But, be careful. It’s mathematically possible to define and study random walks with reflecting barriers –which, when they reach a maximum or minimum, “bounce” back from the barrier.

This is more than esoteric, since the 30 year fixed mortgage rate monthly averages series discussed in the previous post has a curious property. It can be differenced many times, and yet display first order autocorrelation of the resulting series.

This contrasts with the 10 year fixed maturity Treasury bond rates (also monthly averages). After first differencing this Treasury bond series, the resulting residuals do not show statistically significant first order autocorrelation.

Here a stationary stochastic process is one in which the probability distribution of the outcomes does not shift with time, so the conditional mean and conditional variance are, in the strict case, constant. A classic example is white noise, where each element can be viewed as an independent draw from a Gaussian distribution with zero mean and constant variance.

30 Year Fixed Mortgage Monthly Averages – a Nonstationary Time Series?

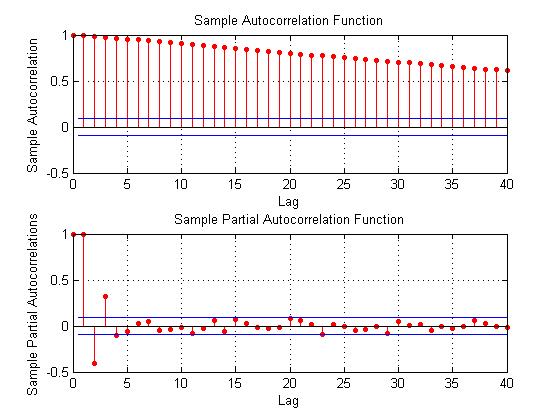
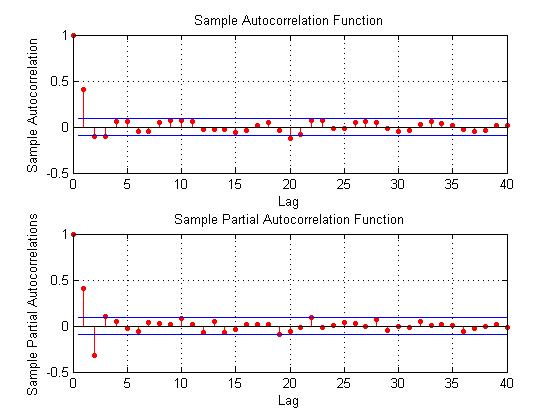
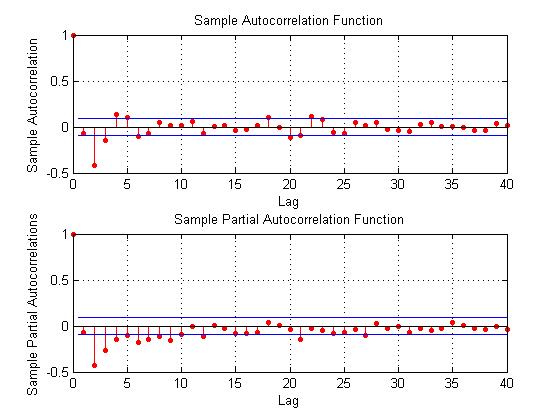
Here are some autocorrelation functions (ACF’s) and partial autocorrelation functions (PACF’s) of the 30 year fixed mortgage monthly averages from April 1971 to January 2014, first differences of this series, and second differences of this series – altogether six charts produced by MATLAB’s plot routines.

Data for this and the following series are downloaded from the St. Louis Fed FRED site.

MLmort0

Here the PACF appears to cut off after 4 periods, but maybe not quite, since there are values for lags which touch the statistical significance boundary further out.

MLmort1

This seems more satisfactory, since there is only one major spike in the ACF and 2-3 initial spikes in the PACF. Again, however, values for lags far out on the horizontal axis appear to touch the boundary of statistical significance.

MLmort2

Here are the ACF and PACF’s of the “difference of the first difference” or the second difference, if you like. This spike at period 2 for the ACF and PACF is intriguing, and, for me, difficult to interpret.

The data series includes 514 values, so we are not dealing with a small sample in conventional terms.

I also checked for seasonal variation – either additive or multiplicative seasonal components or factors. After taking steps to remove this type of variation, if it exists, the same pattern of repeated significance of autocorrelations of differences and higher order differences persists.

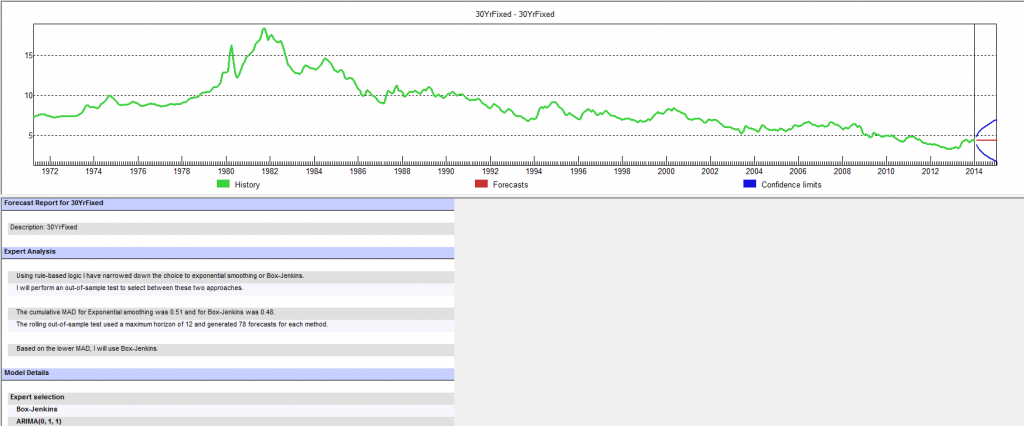
Forecast Pro, a good business workhorse for automatic forecasting, selects ARIMA(0,1,1) as the optimal forecast model for this 30 year fixed interest mortgage monthly averages. In other words, Forecast Pro glosses over the fact that the residuals from an ARIMA(0,1,1) setup still contain significant autocorrelation.

Here is a sample of the output (click to enlarge)

FP30yr

10 Year Treasury Bonds Constant Maturity

The situation is quite different for 10 year Treasury Bonds monthly averages, where the downloaded series starts April 1953 and, again, ends January 2014.

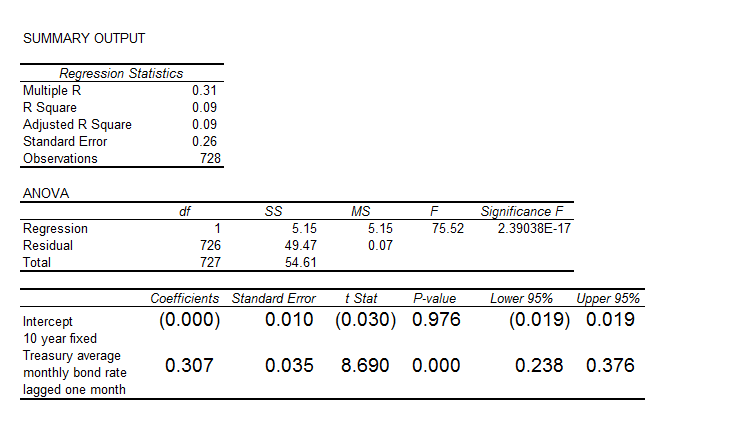
Here is the ordinary least squares (OLS) regression of the first order autocorrelation.

10yrTreasregHere the R2 or coefficient of determination is much lower than for the 30 year fixed mortgage monthly averages, but the first order lagged rate is highly significant statistically.

On the other hand, the residuals of this regression do not exhibit a high degree of first order autocorrelation, falling below the 80 percent significance level.

What Does This Mean?

The closest I have come to formulating an explanation for this weird difference between these two “interest rates” is the discussion in a paper from 2002 –

On Mean Reversion in Real Interest Rates: An Application of Threshold Cointegration

The authors of this research paper from the Institute for Advanced Studies in Vienna acknowledge findings that some interests rates may be nonstationary, at least over some periods of time. Their solution is a nonlinear time series approach, but they highlight several of the more exotic statistical features of interest rates in passing – such as evidence of non-normal distributions, excess kurtosis, conditional heteroskedasticity, and long memory.

In any case, I wonder whether the 30 year fixed mortgage monthly averages might be suitable for some type of boosting model working on residuals and residuals of residuals.

I’m going to try that later on this Spring.

Interest Rates – 1

Let’s focus on forecasting interest rates.

The first question, of course, is “which interest rate”?

So, there is a range of interest rates from short term rates to rates on longer term loans and bonds. The St. Louis Fed data service FRED lists 719 series under “interest rates.”

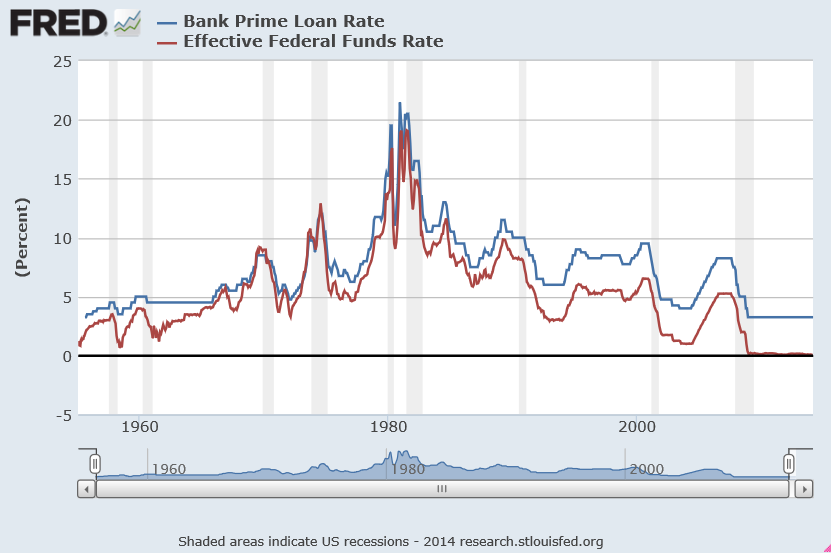
Interest rates, however, tend to move together over time, as this chart on the bank prime rate of interest and the federal funds rate shows.

IratesFRED1

There’s a lot in this chart.

There is the surge in interest rates at the beginning of the 1980’s. The prime rate rocketed to more than 20 percent, or, in the words of the German Chancellor at the time higher “than any year since the time of Jesus Christ.” This ramp-up in interest rates followed actions of the US Federal Reserve Bank under Paul Volcker – extreme and successful tactics to break the back of inflation running at a faster and faster pace in the 1970’s.

Recessions are indicated on this graph with shaded areas.

Also, almost every recession in this more than fifty year period is preceded by a spike in the federal funds rate – the rate under the control of or targeted by the central bank.

Another feature of this chart is the federal funds rate is almost always less than the prime rate, often by several percentages.

This makes sense because the federal funds rate is a very short term interest rate – on overnight loans by depository institutions in surplus at the Federal Reserve to banks in deficit at the end of the business day – surplus and deficit with respect to the reserve requirement.

The interest rate the borrowing bank pays the lending bank is negotiated, and the weighted average across all such transactions is the federal funds effective rate. This “effective rate” is subject to targets set by the Federal Reserve Open Market Committee. Fed open market operations influence the supply of money to bring the federal funds effective rate in line with the federal funds target rate.

The prime rate, on the other hand, is the underlying index for most credit cards, home equity loans and lines of credit, auto loans, and personal loans. Many small business loans are also indexed to the prime rate. The term of these loans is typically longer than “overnight,” i.e. the prime rate applies to longer term loans.

The Yield Curve

The relationship between interest rates on shorter term and longer term loans and bonds is a kind of predictive relationship. It is summarized in the yield curve.

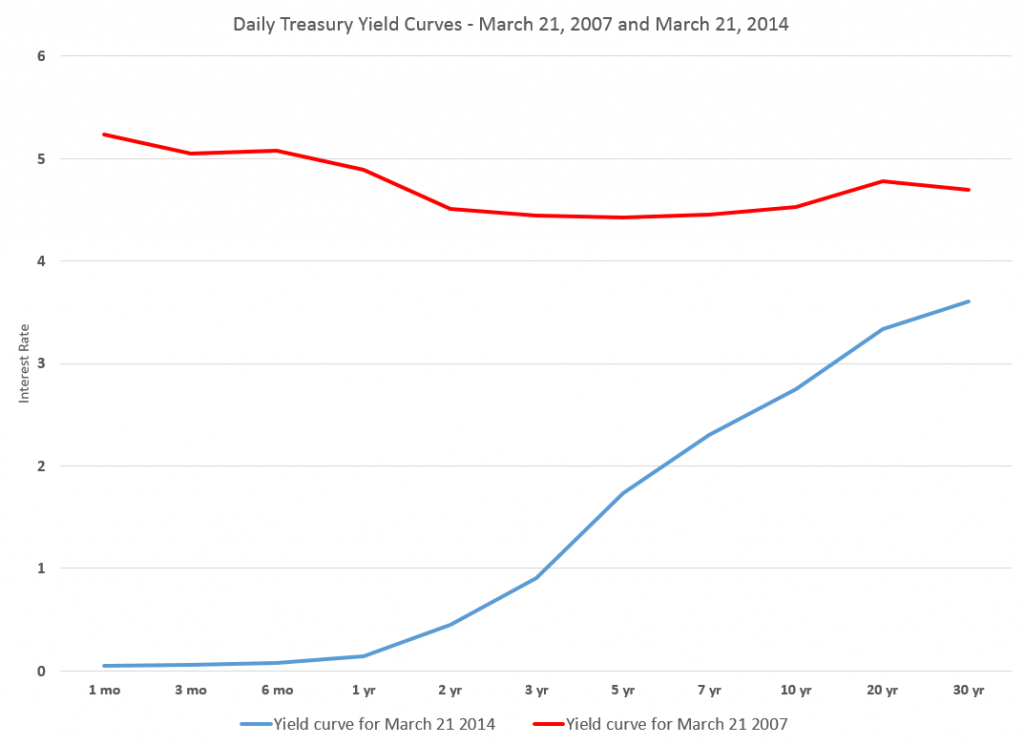
The US Treasury maintains a page Daily Treasury Yield Curve Rates which documents the yield on a security to its time to maturity .. based on the closing market bid yields on actively traded Treasury securities in the over-the-counter market.

The current yield curve is shown by the blue line in the chart below, and can be contrasted with a yield curve seven years previously, prior to the financial crisis of 2008-09 shown by the red line.

YieldCurve

Treasury notes on this curve report that –

These market yields are calculated from composites of quotations obtained by the Federal Reserve Bank of New York. The yield values are read from the yield curve at fixed maturities, currently 1, 3 and 6 months and 1, 2, 3, 5, 7, 10, 20, and 30 years. This method provides a yield for a 10 year maturity, for example, even if no outstanding security has exactly 10 years remaining to maturity.

Short term yields are typically less than longer term yields because there is an opportunity cost in tying up money for longer periods.

However, on occasion, there is an inversion of the yield curve, as shown for March 21, 2007 in the chart.

Inversion of the yield curve is often a sign of oncoming recession – although even the Fed authorities, who had some hand in causing the increase in the short term rates at the time, appeared clueless about what was coming in Spring 2007.

Current Prospects for Interest Rates

Globally, we have experienced an extraordinary period of low interest rates with short term rates hovering just at the zero bound. Clearly, this cannot go on forever, so the longer term outlook is for interest rates of all sorts to rise.

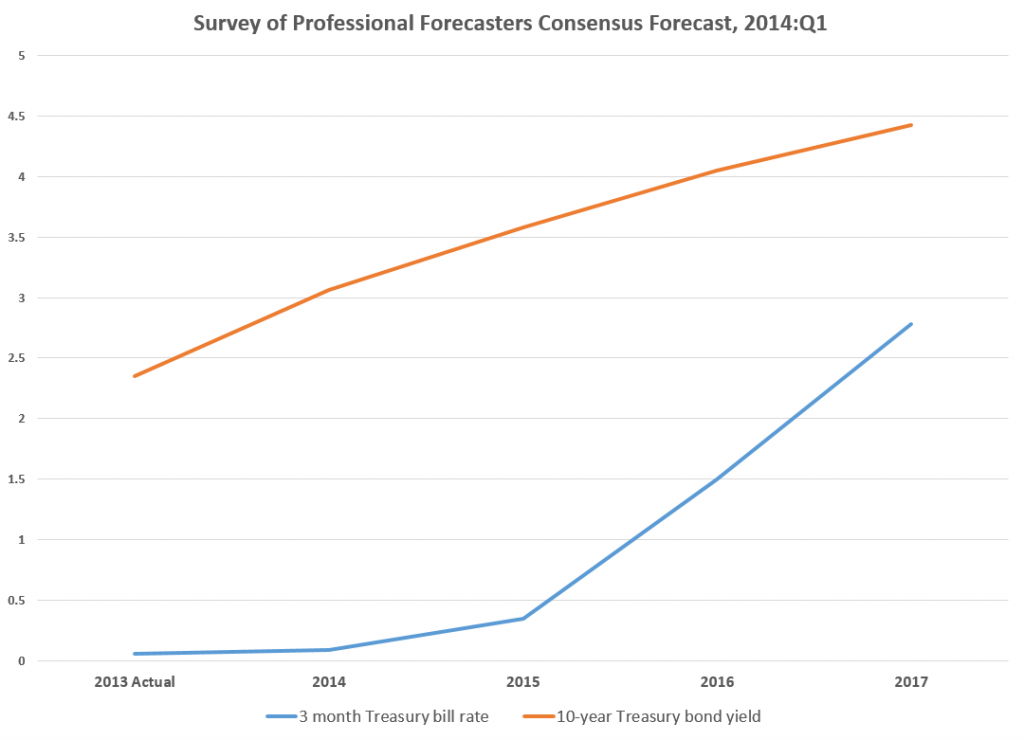
The Survey of Professional Forecasters develops consensus forecasts of key macroeconomic indicators, such as interest rates.

The latest survey, from the first quarter of 2014, includes the following consensus projections for the 3-month Treasury bill and the 10-year Treasury bond rates.

SPFforecast

Bankrate.com has short articles predicting mortgage rates, car loans, credit card rates, and bonds over the next year or two. Mortgage rates might rise to 5 percent by the end of 2014, but that is predicated on a strong recovery in the economy, according to this site.

As anyone participating in modern civilization knows, a great deal depends on the actions of the US Federal Reserve bank. Currently, the Fed influences both short and longer term interest rates. Short term rates are keyed closely to the federal funds rate. Longer term rates are influenced by Fed Quantitative Easing (QE) programs of bond-buying. The Fed’s bond buying is scheduled to be cut back step-by-step (“tapering”) about $10 billion per month.

Actions of the Bank of Japan and the European central bank in Frankfurt also bear on global prospects and impacts of higher interest rates.

Interest rates, however, are not wholly controlled by central banks. Capital markets have a dynamic all their own, which makes forecasting interest rates an increasingly relevant topic.