One value the forecasting community can provide is to report on the predictive power of various leading indicators for key economic and business series.
The Conference Board Leading Indicators
The Conference Board, a private, nonprofit organization with business membership, develops and publishes leading indicator indexes (LEI) for major national economies. Their involvement began in 1995, when they took over maintaining Business Cycle Indicators (BCI) from the US Department of Commerce.
For the United States, the index of leading indicators is based on ten variables: average weekly hours, manufacturing, average weekly initial claims for unemployment insurance, manufacturers’ new orders, consumer goods and materials, vendor performance, slower deliveries diffusion index,manufacturers’ new orders, nondefense capital goods, building permits, new private housing units, stock prices, 500 common stocks, money supply, interest rate spread, and an index of consumer expectations.
The Conference Board, of course, also maintains coincident and lagging indicators of the business cycle.
This list has been imprinted on the financial and business media mind, and is a convenient go-to, when a commentator wants to talk about what’s coming in the markets. And it used to be that a rule of thumb that three consecutive declines in the Index of Leading Indicators over three months signals a coming recession. This rule over-predicts, however, and obviously, given the track record of economists for the past several decades, these Conference Board leading indicators have questionable predictive power.
Serena Ng Research
What does work then?
Obviously, there is lots of research on this question, but, for my money, among the most comprehensive and coherent is that of Serena Ng, writing at times with various co-authors.
So in this regard, I recommend two recent papers
Facts and Challenges from the Great Recession for Forecasting and Macroeconomic Modeling
The first paper is most recent, and is a talk presented before the Canadian Economic Association (State of the Art Lecture).
Hallmarks of a Serena Ng paper are coherent and often quite readable explanations of what you might call the Big Picture, coupled with ambitious and useful computation – usually reporting metrics of predictive accuracy.
Professor Ng and her co-researchers apparently have determined several important facts about predicting recessions and turning points in the business cycle.
For example –
- Since World War II, and in particular, over the period from the 1970’s to the present, there have been different kinds of recessions. Following Ng and Wright, ..business cycles of the 1970s and early 80s are widely believed to be due to supply shocks and/or monetary policy. The three recessions since 1985, on the other hand, originate from the financial sector with the Great Recession of 2008-2009 being a full-blown balance sheet recession. A balance sheet recession involves, a sharp increase in leverage leaves the economy vulnerable to small shocks because, once asset prices begin to fall, financial institutions, firms, and households all attempt to deleverage. But with all agents trying to increase savings simultaneously, the economy loses demand, further lowering asset prices and frustrating the attempt to repair balance sheets. Financial institutions seek to deleverage, lowering the supply of credit. Households and firms seek to deleverage, lowering the demand for credit.
- Examining a monthly panel of 132 macroeconomic and financial time series for the period 1960-2011, Ng and her co-researchers find that .. the predictor set with systematic and important predictive power consists of only 10 or so variables. It is reassuring that most variables in the list are already known to be useful, though some less obvious variables are also identified. The main finding is that there is substantial time variation in the size and composition of the relevant predictor set, and even the predictive power of term and risky spreads are recession specific. The full sample estimates and rolling regressions give confidence to the 5yr spread, the Aaa and CP spreads (relative to the Fed funds rate) as the best predictors of recessions.
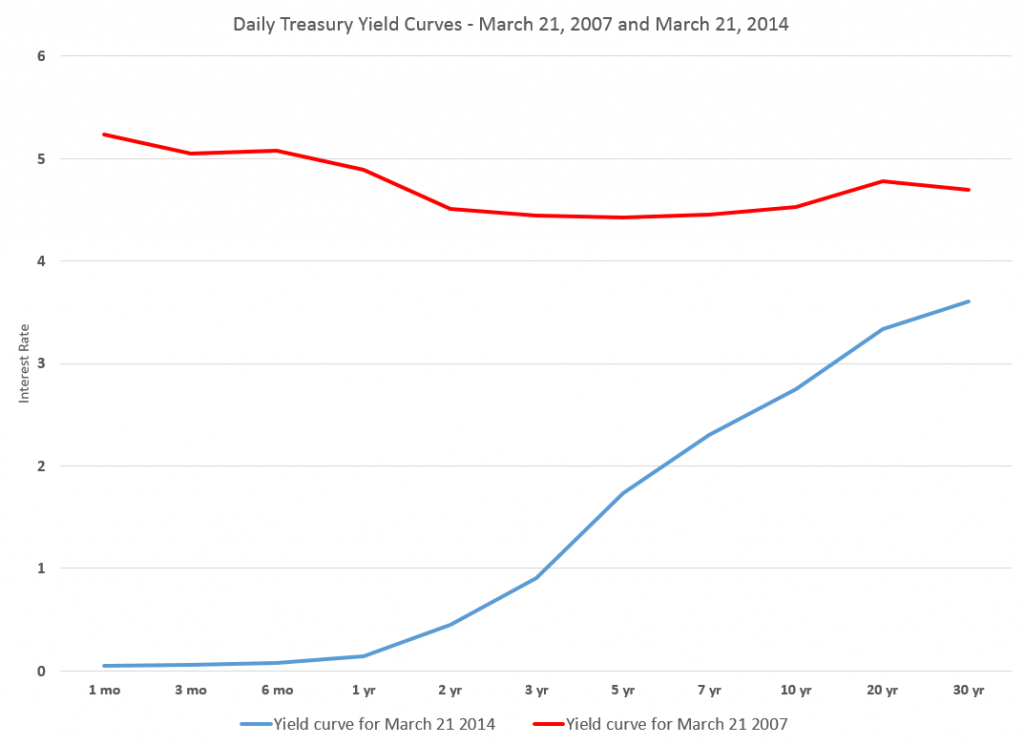
So, the yield curve, a old favorite when it comes to forecasting recessions or turning points in the business cycle, performs less well in the contemporary context – although other (limited) research suggests that indicators combining facts about the yield curve with other metrics might be helpful.
And this exercise shows that the predictor set for various business cycles changes over time, although there are a few predictors that stand out. Again,
there are fewer than ten important predictors and the identity of these variables change with the forecast horizon. There is a distinct difference in the size and composition of the relevant predictor set before and after mid-1980. Rolling window estimation reveals that the importance of the term and default spreads are recession specific. The Aaa spread is the most robust predictor of recessions three and six months ahead, while the risky bond and 5yr spreads are important for twelve months ahead predictions. Certain employment variables have predictive power for the two most recent recessions when the interest rate spreads were uninformative. Warning signals for the post 1990 recessions have been sporadic and easy to miss.
Let me throw in my two bits here, before going on in subsequent posts to consider turning points in stock markets and in more micro-focused or industry time series.
At the end of “Boosting Recessions” Professor Ng suggests that higher frequency data may be a promising area for research in this field.
My guess is that is true, and that, more and more, Big Data and data analytics from machine learning will be applied to larger and more diverse sets of macroeconomics and business data, at various frequencies.
This is tough stuff, because more information is available today than in, say, the 1970’s or 1980’s. But I think we know what type of recession is coming – it is some type of bursting of the various global bubbles in stock markets, real estate, and possibly sovereign debt. So maybe more recent data will be highly relevant.


