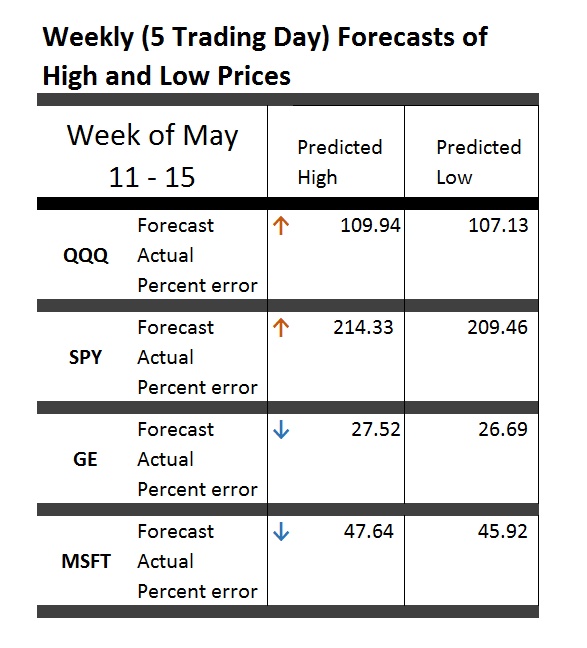
Here are high and low forecasts for two heavily traded exchange traded funds (ETF’s) and two popular stocks. Like the ones in preceding weeks, these are for the next five trading days, in this case Monday through Friday May 11-15.
The up and down arrows indicate the direction of change from last week – for the high prices only, since the predictions of lows are a new feature this week.
Generally, these prices are essentially “moving sideways” or with relatively small changes, except in the case of SPY.
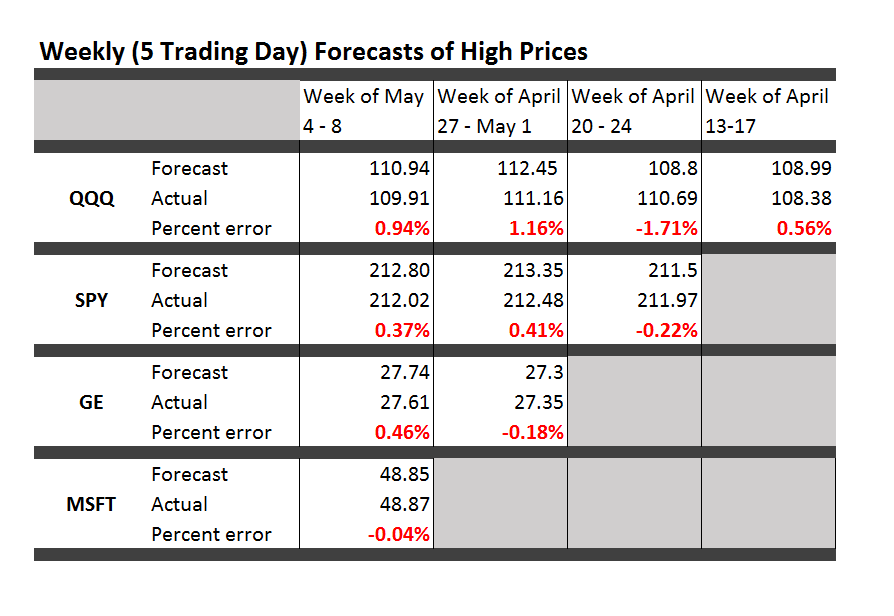
For the record, here is the performance of previous forecasts.
Strong disclaimer: These forecasts are provided for information and scientific purposes only. This blog accepts no responsibility for what might happen, if you base investment or trading decisions on these forecasts. What you do with these predictions is strictly your own business.
Incidentally, let me plug the recent book by Andrew W. Lo and A. Craig McKinlay – A Non-Random Walk Down Wall Street from Princeton University Press and available as a e-book.
I’ve been reading an earlier book which Andrew Lo co-authored The Econometrics of Financial Markets.
What I especially like in these works is the insistence that statistically significant autocorrelations exist in stock prices and stock returns. They also present multiple instances in which stock prices fail tests for being random walks, and establish a degree of predictability for these time series.
Again, almost all the focus of work in the econometrics of financial markets is on closing prices and stock returns, rather than predictions of the high and low prices for periods.


