Tag Archives: many predictors

Forecasting the Downswing in Markets

I got a chance to work with the problem of forecasting during a business downturn at Microsoft 2007-2010.

Usually, a recession is not good for a forecasting team. There is a tendency to shoot the messenger bearing the bad news. Cost cutting often falls on marketing first, which often is where forecasting is housed.

But Microsoft in 2007 was a company which, based on past experience, looked on recessions with a certain aplomb. Company revenues continued to climb during the recession of 2001 and also during the previous recession in the early 1990’s, when company revenues were smaller.

But the plunge in markets in late 2008 was scary. Microsoft’s executive team wanted answers. Since there were few forthcoming from the usual market research vendors – vendors seemed sort of “paralyzed” in bringing out updates – management looked within the organization.

I was part of a team that got this assignment.

We developed a model to forecast global software sales across more than 80 national and regional markets. Forecasts, at one point, were utilized in deliberations of the finance directors, developing budgets for FY2010. Our Model, by several performance comparisons, did as well or better than what was available in the belated efforts of the market research vendors.

This was a formative experience for me, because a lot of what I did, as the primary statistical or econometric modeler, was seat-of-the-pants. But I tried a lot of things.

That’s one reason why this blog explores method and technique – an area of forecasting that, currently, is exploding.

Importance of the Problem

Forecasting the downswing in markets can be vitally important for an organization, or an investor, but the first requirement is to keep your wits. All too often there are across-the-board cuts.

A targeted approach can be better. All market corrections, inflections, and business downturns come to an end. Growth resumes somewhere, and then picks up generally. Companies that cut to the bone are poorly prepared for the future and can pay heavily in terms of loss of market share. Also, re-assembling the talent pool currently serving the organization can be very expensive.

But how do you set reasonable targets, in essence – make intelligent decisions about cutbacks?

I think there are many more answers than are easily available in the management literature at present.

But one thing you need to do is get a handle on the overall swing of markets. How long will the downturn continue, for example?

For someone concerned with stocks, how long and how far will the correction go? Obviously, perspective on this can inform shorting the market, which, my research suggests, is an important source of profits for successful investors.

A New Approach – Deploying high frequency data

Based on recent explorations, I’m optimistic it will be possible to get several weeks lead-time on releases of key US quarterly macroeconomic metrics in the next downturn.

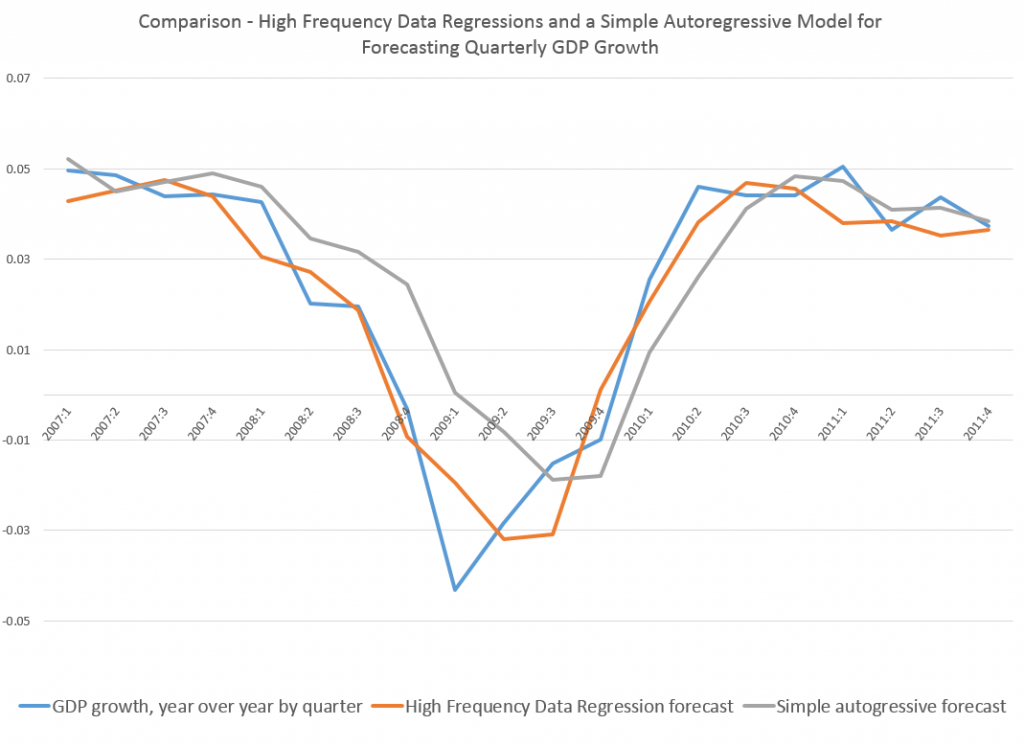
My last post, for example, has this graph.

MIDAScomp

Note how the orange line hugs the blue line during the descent 2008-2009.

This orange line is the out-of-sample forecast of quarterly nominal GDP growth based on the quarter previous GDP and suitable lagged values of the monthly Chicago Fed National Activity Index. The blue line, of course, is actual GDP growth.

The official name for this is Nowcasting and MIDAS or Mixed Data Sampling techniques are widely-discussed approaches to this problem.

But because I was only mapping monthly and not, say, daily values onto quarterly values, I was able to simply specify the last period quarterly value and fifteen lagged values of the CFNAI in a straight-forward regression.

And in reviewing literature on MIDAS and mixing data frequencies, it is clear to me that, often, it is not necessary to calibrate polynomial lag expressions to encapsulate all the higher frequency data, as in the classic MIDAS approach.

Instead, one can deploy all the “many predictors” techniques developed over the past decade or so, starting with the work of Stock and Watson and factor analysis. These methods also can bring “ragged edge” data into play, or data with different release dates, if not different fundamental frequencies.

So, for example, you could specify daily data against quarterly data, involving perhaps several financial variables with deep lags – maybe totaling more explanatory variables than observations on the quarterly or lower frequency target variable – and wrap the whole estimation up in a bundle with ridge regression or the LASSO. You are really only interested in the result, the prediction of the next value for the quarterly metric, rather than unbiased estimates of the coefficients of explanatory variables.

Or you could run a principal component analysis of the data on explanatory variables, including a rag-tag collection of daily, weekly, and monthly metrics, as well as one or more lagged values of the higher frequency variable (quarterly GDP growth in the graph above).

Dynamic principal components also are a possibility, if anyone can figure out the estimation algorithms to move into a predictive mode.

Being able to put together predictor variables of all different frequencies and reporting periods is really exciting. Maybe in some way this is really what Big Data means in predictive analytics. But, of course, progress in this area is wholly empirical, it not being clear what higher frequency series can successfully map onto the big news indices, until the analysis is performed. And I think it is important to stress the importance of out-of-sample testing of the models, perhaps using cross-validation to estimate parameters if there is simply not enough data.

One thing I believe is for sure, however, and that is we will not be in the dark for so long during the next major downturn. It will be possible to  deploy all sorts of higher frequency data to chart the trajectory of the downturn, probably allowing a call on the turning point sooner than if we waited for the “big number” to come out officially.

Top picture courtesy of the Bridgespan Group

Estimation and Variable Selection with Ridge Regression and the LASSO

I’ve posted on ridge regression and the LASSO (Least Absolute Shrinkage and Selection Operator) some weeks back.

Here I want to compare them in connection with variable selection  where there are more predictors than observations (“many predictors”).

1. Ridge regression does not really select variables in the many predictors situation. Rather, ridge regression “shrinks” all predictor coefficient estimates toward zero, based on the size of the tuning parameter λ. When ordinary least squares (OLS) estimates have high variability, ridge regression estimates of the betas may, in fact, produce lower mean square error (MSE) in prediction.

2. The LASSO, on the other hand, handles estimation in the many predictors framework and performs variable selection. Thus, the LASSO can produce sparse, simpler, more interpretable models than ridge regression, although neither dominates in terms of predictive performance. Both ridge regression and the LASSO can outperform OLS regression in some predictive situations – exploiting the tradeoff between variance and bias in the mean square error.

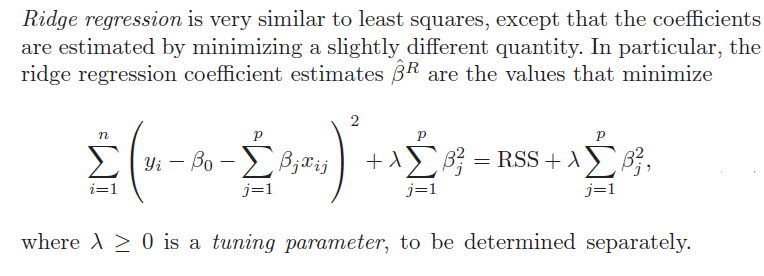
3. Ridge regression and the LASSO both involve penalizing OLS estimates of the betas. How they impose these penalties explains why the LASSO can “zero” out coefficient estimates, while ridge regression just keeps making them smaller. From
An Introduction to Statistical Learning

ridgeregressionOF

Similarly, the objective function for the LASSO procedure is outlined by An Introduction to Statistical Learning, as follows

LASSOobkf

4. Both ridge regression and the LASSO, by imposing a penalty on the regression sum of squares (RWW) shrink the size of the estimated betas. The LASSO, however, can zero out some betas, since it tends to shrink the betas by fixed amounts, as λ increases (up to the zero lower bound). Ridge regression, on the other hand, tends to shrink everything proportionally.

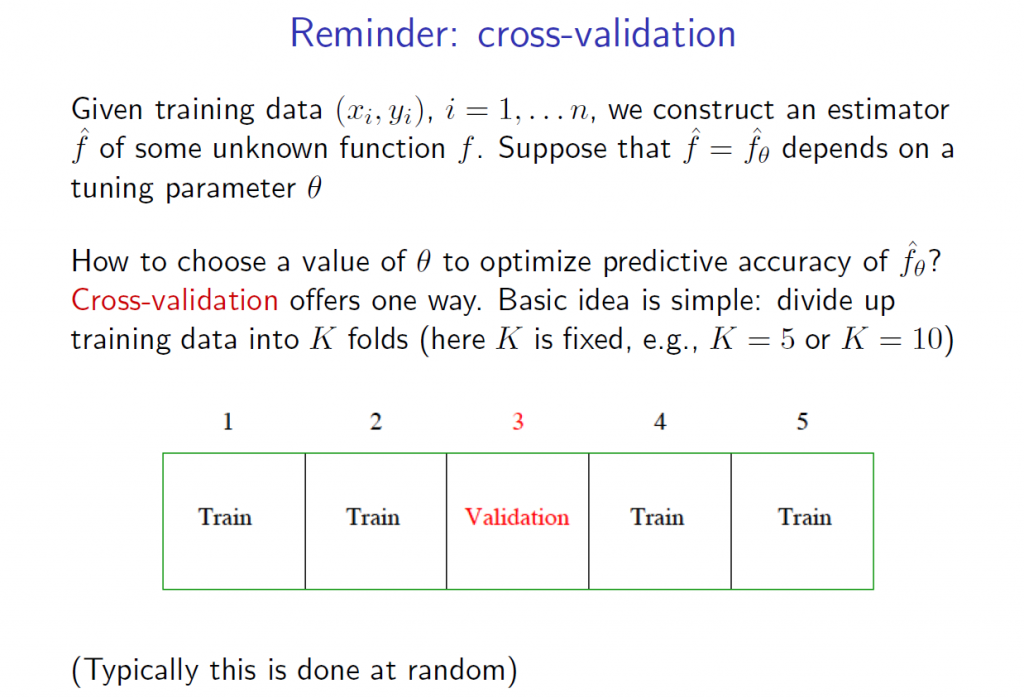
5.The tuning parameter λ in ridge regression and the LASSO usually is determined by cross-validation. Here are a couple of useful slides from Ryan Tibshirani’s Spring 2013 Data Mining course at Carnegie Mellon.

RTCV1

RTCV2

6.There are R programs which estimate ridge regression and lasso models and perform cross validation, recommended by these statisticians from Stanford and Carnegie Mellon. In particular, see glmnet at CRAN. Mathworks MatLab also has routines to do ridge regression and estimate elastic net models.

Here, for example, is R code to estimate the LASSO.

lasso.mod=glmnet(x[train,],y[train],alpha=1,lambda=grid)
plot(lasso.mod)
set.seed(1)
cv.out=cv.glmnet(x[train,],y[train],alpha=1)
plot(cv.out)
bestlam=cv.out$lambda.min
lasso.pred=predict(lasso.mod,s=bestlam,newx=x[test,])
mean((lasso.pred-y.test)^2)
out=glmnet(x,y,alpha=1,lambda=grid)
lasso.coef=predict(out,type=”coefficients”,s=bestlam)[1:20,]
lasso.coef
lasso.coef[lasso.coef!=0]

 What You Get

I’ve estimated quite a number of ridge regression and LASSO models, some with simulated data where you know the answers (see the earlier posts cited initially here) and other models with real data, especially medical or health data.

As a general rule of thumb, An Introduction to Statistical Learning notes,

 ..one might expect the lasso to perform better in a setting where a relatively small number of predictors have substantial coefficients, and the remaining predictors have coefficients that are very small or that equal zero. Ridge regression will perform better when the response is a function of many predictors, all with coefficients of roughly equal size.

The R program glmnet linked above is very flexible, and can accommodate logistic regression, as well as regression with continuous, real-valued dependent variables ranging from negative to positive infinity.


Selecting Predictors

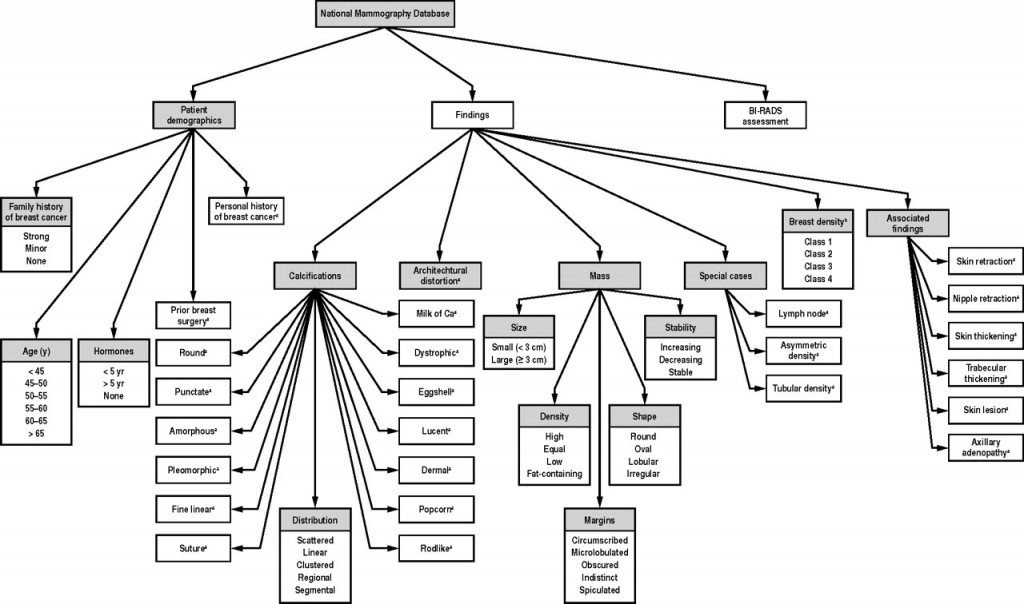
In a recent post on logistic regression, I mentioned research which developed diagnostic tools for breast cancer based on true Big Data parameters – notably 62,219 consecutive mammography records from 48,744 studies in 18,270 patients reported using the Breast Imaging Reporting and Data System (BI-RADS) lexicon and the National Mammography Database format between April 5, 1999 and February 9, 2004.

This research built a logistic regression model with 36 predictors, selected from the following information residing in the National Mammography Database (click to enlarge).

        breastcancertyp               

The question arises – are all these 36 predictors significant? Or what is the optimal model? How does one select the subset of the available predictor variables which really count?

This is the problem of selecting predictors in multivariate analysis – my focus for several posts coming up.

So we have a target variable y and set of potential predictors x={x1,x2,….,xn}. We are interested in discovering a predictive relationship, y=F(x*) where x* is some possibly proper subset of x. Furthermore, we have data comprising m observations on y and x, which in due time we will label with subscripts.

There are a range of solutions to this very real, very practical modeling problem.

Here is my short list.

  1. Forward Selection. Begin with no candidate variables in the model. Select the variable that boosts some goodness-of-fit or predictive metric the most. Traditionally, this has been R-Squared for an in-sample fit. At each step, select the candidate variable that increases the metric the most. Stop adding variables when none of the remaining variables are significant. Note that once a variable enters the model, it cannot be deleted.
  2. Backward Selection. This starts with the superset of potential predictors and eliminates variables which have the lowest score by some metric – traditionally, the t-statistic.
  3. Stepwise regression. This combines backward and forward selection of regressors.
  4. Regularization and Selection by means of the LASSO. Here is the classic article and here is a post, and here is a post in this blog on the LASSO.
  5. Information criteria applied to all possible regressions – pick the best specification by applying the Aikaike Information Criterion (AIC) or Bayesian Information Criterion (BIC) to all possible combinations of regressors. Clearly, this is only possible with a limited number of potential predictors.
  6. Cross-validation or other out-of-sample criteria applied to all possible regressions – Typically, the error metrics on the out-of-sample data cuts are averaged, and the lowest average error model is selected out of all possible combinations of predictors.
  7. Dimension reduction or data shrinkage with principal components. This is a many predictors formulation, whereby it is possible to reduce a large number of predictors to a few principal components which explain most of the variation in the data matrix.
  8. Dimension reduction or data shrinkage with partial least squares. This is similar to the PC approach, but employs a reduction to information from both the set of potential predictors and the dependent or target variable.

There certainly are other candidate techniques, but this is a good list to start with.

Wonderful topic, incidentally. Dives right into the inner sanctum of the mysteries of statistical science as practiced in the real world.

Let me give you the flavor of how hard it is to satisfy the classical criterion for variable selection, arriving at unbiased or consistent estimates of effects of a set of predictors.

And, really, the paradigmatic model is ordinary least squares (OLS) regression in which the predictive function F(.) is linear.

The Specification Problem

The problem few analysts understand is called specification error.

So assume that there is a true model – some linear expression in variables multiplied by their coefficients, possibly with a constant term added.

Then, we have some data to estimate this model.

Now the specification problem is that when predictors are not orthogonal, i.e. when they are correlated, leaving out a variable from the “true” specification imparts a bias to the estimates of coefficients of variables included in the regression.

This complications sequential methods of selecting predictors for the regression.

So in any case I will have comments forthcoming on methods of selecting predictors.

Looking Ahead, Looking Back

Looking ahead, I’m almost sure I want to explore forecasting in the medical field this coming week. Menzie Chin at Econbrowser, for example, highlights forecasts that suggest states opting out of expanded Medicare are flirting with higher death rates. This sets off a flurry of comments, highlighting the importance and controversy attached to various forecasts in the field of medical practice.

There’s a lot more – from bizarre and sad mortality trends among Russian men since the collapse of the Soviet Union, now stabilizing to an extent, to systems which forecast epidemics, to, again, cost and utilization forecasts.

Today, however, I want to wind up this phase of posts on forecasting the stock and related financial asset markets.

Market Expectations in the Cross Section of Present Values

That’s the title of Bryan Kelly and Seth Pruitt’s article in the Journal of Finance, downloadable from the Social Science Research Network (SSRN).

The following chart from this paper shows in-sample (IS) and out-of-sample (OOS) performance of Kelly and Pruitt’s new partial least squares (PLS) predictor, and IS and OOS forecasts from another model based on the aggregate book-to-market ratio. (Click to enlarge)

KellyPruitt1

The Kelly-Pruitt PLS predictor is much better in both in-sample and out-of-sample than the more traditional regression model based on aggregate book-t0-market ratios.

What Kelly and Pruitt do is use what I would call cross-sectional time series data to estimate aggregate market returns.

Basically, they construct a single factor which they use to predict aggregate market returns from cross-sections of portfolio-level book-to-market ratios.

So,

To harness disaggregated information we represent the cross section of asset-specific book-to-market ratios as a dynamic latent factor model. We relate these disaggregated value ratios to aggregate expected market returns and cash flow growth. Our model highlights the idea that the same dynamic state variables driving aggregate expectations also govern the dynamics of the entire panel of asset-specific valuation ratios. This representation allows us to exploit rich cross-sectional information to extract precise estimates of market expectations.

This cross-sectional data presents a “many predictors” type of estimation problem, and the authors write that,

Our solution is to use partial least squares (PLS, Wold (1975)), which is a simple regression-based procedure designed to parsimoniously forecast a single time series using a large panel of predictors. We use it to construct a univariate forecaster for market returns (or dividend growth) that is a linear combination of assets’ valuation ratios. The weight of each asset in this linear combination is based on the covariance of its value ratio with the forecast target.

I think it is important to add that the authors extensively explore PLS as a procedure which can be considered to be built from a series of cross-cutting regressions, as it were (See their white paper on three-pass regression filter).

But, it must be added, this PLS procedure can be summarized in a single matrix formula, which is

KPmatrixformula

Readers wanting definitions of these matrices should consult the Journal of Finance article and/or the white paper mentioned above.

The Kelly-Pruitt analysis works where other methods essentially fail – in OOS prediction,

Using data from 1930-2010, PLS forecasts based on the cross section of portfolio-level book-to-market ratios achieve an out-of-sample predictive R2 as high as 13.1% for annual market returns and 0.9% for monthly returns (in-sample R2 of 18.1% and 2.4%, respectively). Since we construct a single factor from the cross section, our results can be directly compared with univariate forecasts from the many alternative predictors that have been considered in the literature. In contrast to our results, previously studied predictors typically perform well in-sample but become insignifcant out-of-sample, often performing worse than forecasts based on the historical mean return …

So, the bottom line is that aggregate stock market returns are predictable from a common-sense perspective, without recourse to abstruse error measures. And I believe Amit Goyal, whose earlier article with Welch contests market predictability, now agrees (personal communication) that this application of a PLS estimator breaks new ground out-of-sample – even though its complexity asks quite a bit from the data.

Note, though, how volatile aggregate realized returns for the US stock market are, and how forecast errors of the Kelly-Pruitt analysis become huge during the 2008-2009 recession and some previous recessions – indicated by the shaded lines in the above figure.

Still something is better than nothing, and I look for improvements to this approach – which already has been applied to international stocks by Kelly and Pruitt and other slices portfolio data.

The Problem of Many Predictors – Ridge Regression and Kernel Ridge Regression

You might imagine that there is an iron law of ordinary least squares (OLS) regression – the number of observations on the dependent (target) variable and associated explanatory variables must be less than the number of explanatory variables (regressors).

Ridge regression is one way to circumvent this requirement, and to estimate, say, the value of p regression coefficients, when there are N<p training sample observations.

This is very helpful in all sorts of situations.

Instead of viewing many predictors as a variable selection problem (selecting a small enough subset of the p explanatory variables which are the primary drivers), data mining operations can just use all the potential explanatory variables, if the object is primarily predicting the value of the target variable. Note, however, that ridge regression exploits the tradeoff between bias and variance – producing biased coefficient estimates with lower variance than OLS (if, in fact, OLS can be applied).

A nice application was developed by Edward Malthouse some years back. Malthouse used ridge regression for direct marketing scoring models (search and you will find a downloadable PDF). These are targeting models to identify customers for offers, so the response to a mailing is maximized. A nice application, but pre-social media in its emphasis on the postal service.

In any case, Malthouse’s ridge regressions provided superior targeting capabilities. Also, since the final list was the object, rather than information about the various effects of drivers, ridge regression could be accepted as a technique without much worry about the bias introduced in the individual parameter estimates.

Matrix Solutions for Ordinary and Ridge Regression Parameters

Before considering spreadsheets, let’s highlight the similarity between the matrix solutions for OLS and ridge regression. Readers can skip this section to consider the worked spreadsheet examples.

Suppose we have data which consists of N observations or cases on a target variable y and vector of explanatory variables x,

y1           x11         x12         ..             x1p

y2           x21         x22         ..             x2p

………………………………….

yN          xN1        xN2        ..             xNp


Here yi is the ith observation on the target variable, and xi=(xi1,xi2,..xip) are the associated values for p (potential) explanatory variables, i=1,2,..,N.

So we are interested in estimating the parameters of a relationship Y=f(X1,X2,..Xk).

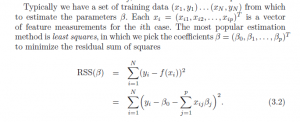
Assuming f(.) is a linear relationship, we search for the values of k+1 parameters (β01,…,βp) such that  Σ(y-f(x))2 minimizes the sum of all the squared errors over the data – or sometimes over a subset called the training data, so we can generate out-of-sample tests of model performance.

Following Hastie, Tibshirani, and Friedman, the Regression Sum of Squares (RSS) can be expressed,

LeastSquares

The solution to this least squares error minimization problem can be stated in a matrix formula,

β= (XTX)-1XTY

where X is the data matrix, Here XT denotes the transpose of the matrix X.

Now ridge regression involves creating a penalty in the minimization of the squared errors designed to force down the absolute size of the regression coefficients. Thus, the minimization problem is

RRminization

This also can be solved analytically in a closed matrix formula, similar to that for OLS –

βridge= (XTX-λІ)-1XTY

Here λ is a penalty or conditioning factor, and I is the identity matrix. This conditioning factor λ, it should be noted, is usually determined by cross-validation – holding back some sample data and testing the impact of various values of λ on the goodness of fit of the overall relationship on this holdout or test data.

Ridge Regression in Excel

So what sort of results can be obtained with ridge regression in the context of many predictors?

Consider the following toy example.

RRss

By construction, the true relationship is

y = 2x1 + 5x2+0.25x1x2+0.5x12+1.5x22+0.5x1x22+0.4x12x2+0.2x13+0.3x23

so the top row with the numbers in bold lists the “true” coefficients of the relationship.

Also, note that, strictly speaking, this underlying equation is not linear, since some exponents of explanatory variables are greater than 1, and there are cross products.

Still, for purposes of estimation we treat the setup as though the data come from ten separate explanatory variables, each weighted by separate coefficients.

Now, assuming no constant term and mean-centered data. the data matrix X is 6 rows by 10 columns, since there are six observations or cases and ten explanatory variables. Thus, the transpose XT is a 10 by 6 matrix. Accordingly, the product XTX is a 10 by 10 matrix, resulting in a 10 by 10 inverse matrix after the conditioning factor and identity matrix is added in to XTX.

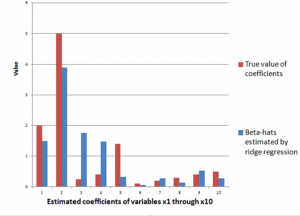
The ridge regression formula above, therefore, gives us estimates for ten beta-hats, as indicated in the following chart, using a λ or conditioning coefficient of .005.

RRestcomp

The red bars indicate the true coefficient values, and the blue bars are the beta-hats estimated by the ridge regression formula.

As you can see, ridge regression does get into the zone in terms of these ten coefficients of this linear expression, but with only 6 observations, the estimate is very approximate.

The Kernel Trick

Note that in order to estimate the ten coefficients by ordinary ridge regression, we had to invert a 10 by 10 matrix XTX. We also can solve the estimation problem by inverting a 6 by 6 matrix, using the kernel trick, whose derivation is outlined in a paper by Exertate.

The key point is that kernel ridge regression is no different from ordinary ridge regression…except for an algebraic trick.

To show this, we applied the ridge regression formula to the 6 by 10 data matrix indicated above, estimating the ten coefficients, using a λ or conditioning coefficient of .005. These coefficients broadly resemble the true values.

The above matrix formula works for our linear expression in ten variables, which we can express as

y = β1x1+ β2x2+… + β10x10

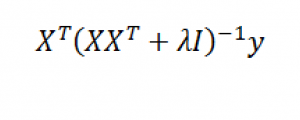
Now with suitable pre- and post-multiplications and resorting, it is possible to switch things around to arrive at another matrix formula,

Kerneltrick

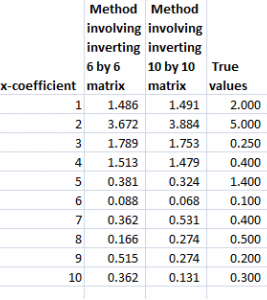
The following table shows beta-hats estimated by these two formulas are similar and compares them with the “true” values of the coefficients.

RRkerneltab

Differences in the estimates by these formulas relate strictly to issues at the level of numerical analysis and computation.

See also Exterkate et al “Nonlinear..” white paper.

Kernels

Notice that the ten variables could correspond to a Taylor expansion which might be used to estimate the value of a nonlinear function. This is important and illustrates the concept of a “kernel”.

Thus, designating K = XXwe find that the elements of K can be obtained without going through the indicated multiplication of these two matrices. This is because K is a polynomial kernel.

The second matrix formula listed just above involves inverting a smaller matrix, than the original formula – in our example, a 6 by 6, rather than a 10 by 10 matrix. This does not seem like a big deal with this toy example, but in Big Data and data mining applications, involving matrices with hundreds or thousands of rows and columns, the reduction in computation burden can be significant.

Summing Up

There is a great deal more that can be said about this example and the technique in general. Two big areas are (a) arriving at the estimate of the conditioning factor λ and (b) discussing the range of possible kernels that can be used, what makes a kernel a kernel, how to generate kernels from existing kernels, where Hilbert spaces come into the picture, and so forth.

But perhaps the important thing to remember is that ridge regression is one way to pry open the problem of many predictors, making it possible to draw on innumerable explanatory variables regardless of the size of the sample (within reason of course). Other techniques that do this include principal components regression and the lasso.