I once ran into Norman Mailer at the Museum of Modern Art in Manhattan. We were both looking at Picasso’s “Blue Boy” and, recognizing him, I started up some kind of conversation, and Mailer was quite civil about the whole thing.
I mention this because I always associate Mailer with his collection Advertisements for Myself.
And that segues – loosely – into my wish to let you know that, in fact, I developed a generalization of the law of demand for the situation in which a commodity is sold at a schedule of rates and fees, instead of a uniform price. That was in 1987, when I was still a struggling academic and beginning a career in business consulting.
OK, and that relates to a point I want to suggest here. And that is that minor players can have big ideas.
So I recognize an element of “hubris” in suggesting that the error process of S&P 500 daily returns – up to certain transformations – is described by a Laplace distribution.
What about other stock market indexes, then? This morning, I woke up and wondered whether the same thing is true for, say, the NASDAQ 100.
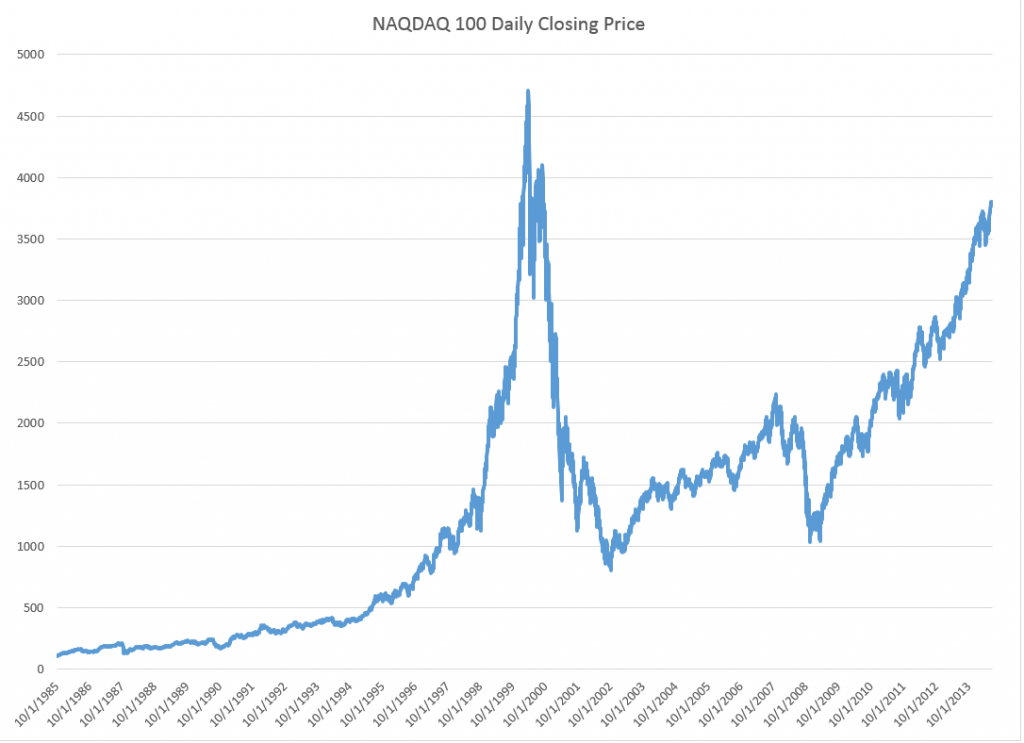
So I downloaded daily closing prices for the NASDAQ 100 from Yahoo Finance dating back to October 1, 1985. Then, I took the natural log of each of these closing prices. After that, I took trading day by trading day differences. So the series I am analyzing comes from the first differences of the natural log of the NASDAQ 100 daily closing prices.
Note that this series of first differences is sometimes cast into a histogram by itself – and this also frequently is a “pointy peaked” relatively symmetric distribution. You could motivate this graph with the idea that stock prices are a random walk. So if you take first differences, you get the random component that generates the random walk.
I am troubled, however, by the fact that this component has considerable structure in and of itself. So I undertake further analysis.
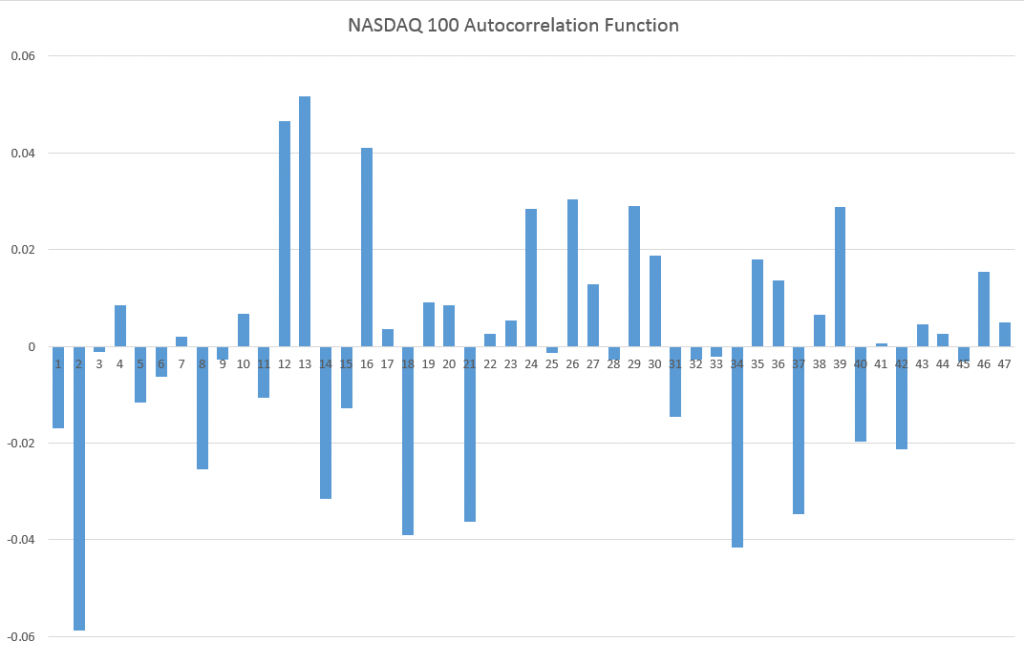
For example, the autocorrelation function of these first differences of the log of NASDAQ 100 daily closing prices looks like this.
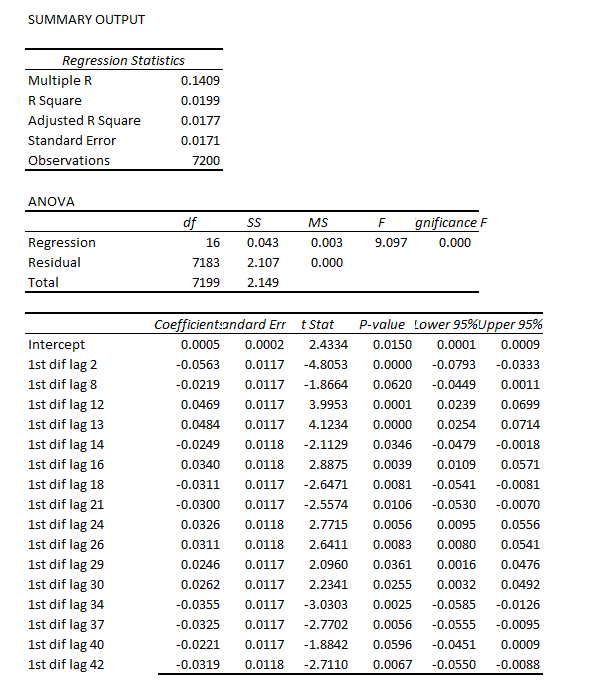
Now if you calculate bivariate regressions on these first differences and their lagged values, many of them produce coefficient estimates with t-statistics that exceed the magic value of 2.
Just selecting these significant regressors from the first 47 lags produces this regression equation, I get this equation.
Now this regression is estimated over all 7200 observations from October 1 1984 to almost right now.
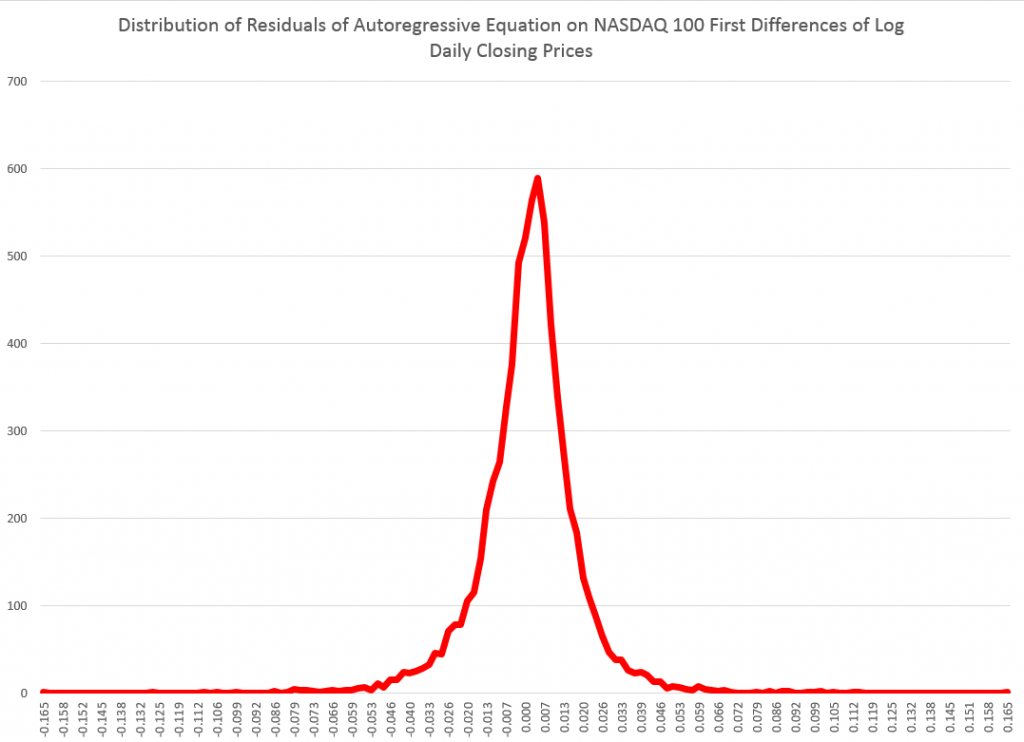
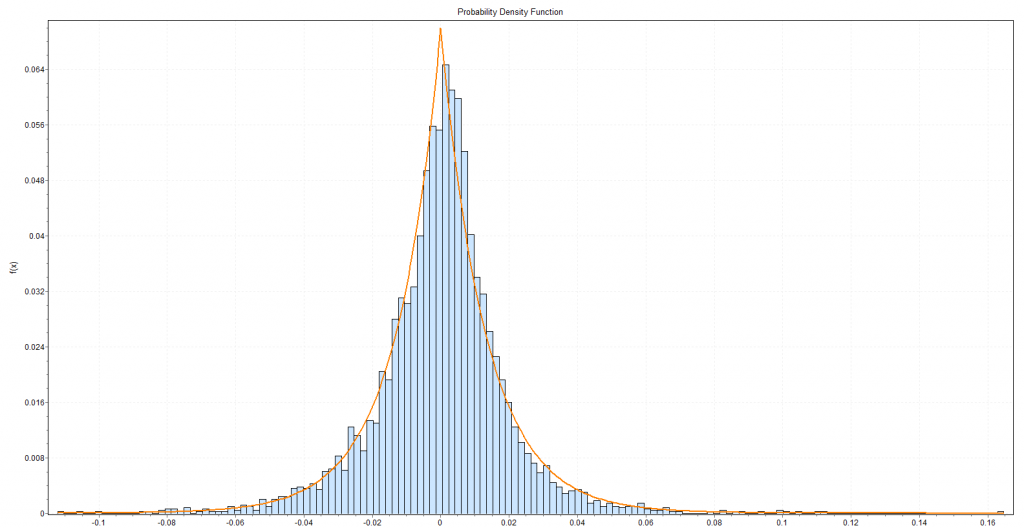
Graphing the residuals, I get the familiar pointy-peaked distribution that we saw with the S&P 500.
Here is a fit of the Laplace distribution to this curve (Again using EasyFit).
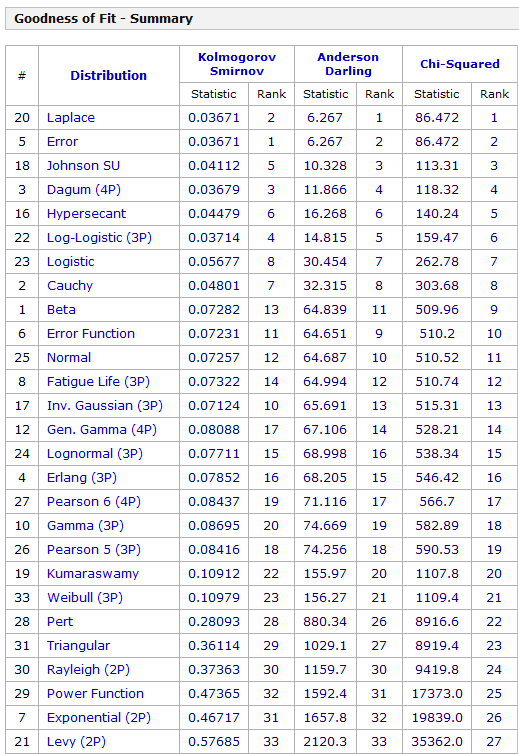
Here are the metrics for this fit and fits to a number of other probability distributions from this program.
I have never seen as clear a linkage of returns from stock indexes and the Laplace distribution (maybe with a slight asymmetry – there are also asymmetric Laplace distributions).
One thing is for sure – the distribution above for the NASDAQ 100 data and the earlier distribution developed for the S&P 500 are not close to be normally distributed. Thus, in the table above that the normal distribution is number 12 on the list of possible candidates identified by EasyFit.
Note “Error” listed in the above table, is not the error function related to the normal distribution. Instead it is another exponential distribution with an absolute value in the exponent like the Laplace distribution. In fact, it looks like a transformation of the Laplace, but I need to do further investigation. In any case, it’s listed as number 2, even though the metrics show the same numbers.
The plot thickens.
Obviously, the next step is to investigate individual stocks with respect to Laplacian errors in this type of transformation.
Also, some people will be interested in whether the autoregressive relationship listed above makes money under the right trading rules. I will report further on that.
Anyway, thanks for your attention. If you have gotten this far – you believe numbers have power. Or you maybe are interested in finance and realize that indirect approaches may be the best shot at getting to something fundamental.

