
The history of science, like the history of all human ideas, is a history of irresponsible dreams, of obstinacy, and of error. But science is one of the very few human activities perhaps the only one in which errors are systematically criticized and fairly often, in time, corrected. This is why we can say that, in science, we often learn from our mistakes, and why we can speak clearly and sensibly about making progress there. — Karl Popper, Conjectures and Refutations
Microsoft daily stock prices and oil futures seem to fall in the same class of distributions as those for the S&P 500 and NASDAQ 100 – what I am calling the Laplace distribution.
This is contrary to the conventional wisdom. The whole thrust of Box-Jenkins time series modeling seems to be to arrive at Gaussian white noise. Most textbooks on econometrics prominently feature normally distributed error processes ~ N(0,σ).
Benoit Mandelbrot, of course, proposed alternatives as far back as the 1960’s, but still we find aggressive application of Gaussian assumptions in applied work – as for example in widespread use of the results of the Black-Scholes theorem or in computing value at risk in portfolios.
Basic Steps
I’m taking a simple approach.
First, I collect daily closing prices for a stock index, stock, or, as you will see, for commodity futures.
Then, I do one of two things: (a) I take the natural logarithms of the daily closing prices, or (b) I simply calculate first differences of the daily closing prices.
I did not favor option (b) initially, because I can show that the first differences, in every case I have looked at, are autocorrelated at various lags. In other words, these differences have an algorithmic structure, although this structure usually has weak explanatory power.
However, it is interesting that the first differences, again in every case I have looked at, are distributed according to one of these sharp-peaked or pointy distributions which are highly symmetric.
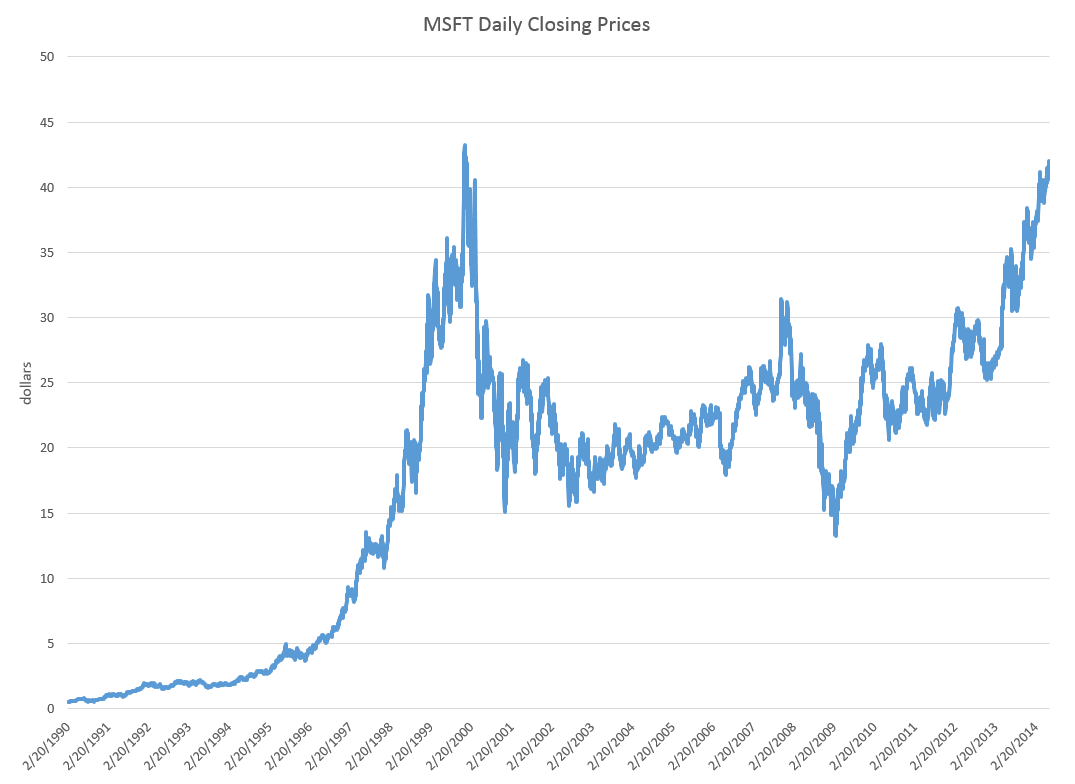
Take the daily closing prices of the stock of the Microsoft Corporation (MST), as an example.
Here is a graph of the daily closing prices.
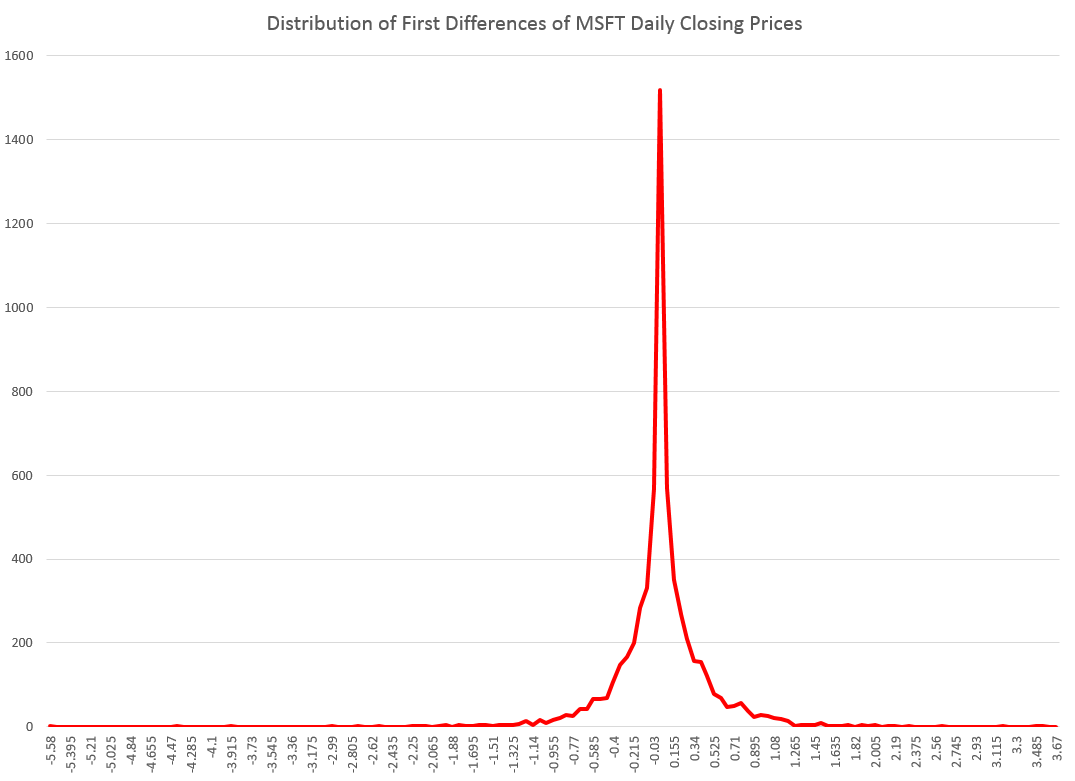
And here is a histogram of the raw first differences of those closing prices over this period since 1990.
Now in close reading of The Laplace Distribution and Generalizations I can see there are a range of possibilities in modeling distributions of the above type.
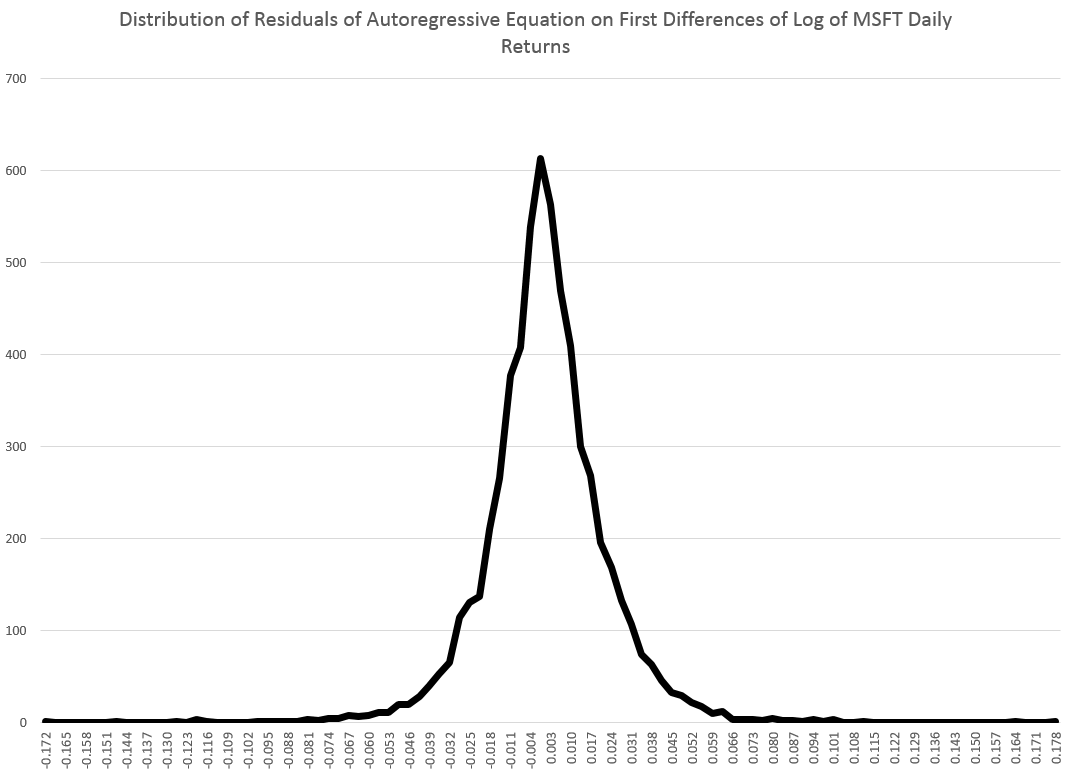
And here is another peaked, relatively symmetric distribution based on the residuals of an autoregressive equation calculated on the first differences of the logarithm of the daily closing prices. That’s a mouthful, but the idea is to extract at least some of the algorithmic component of the first differences.
That regression is as follows.
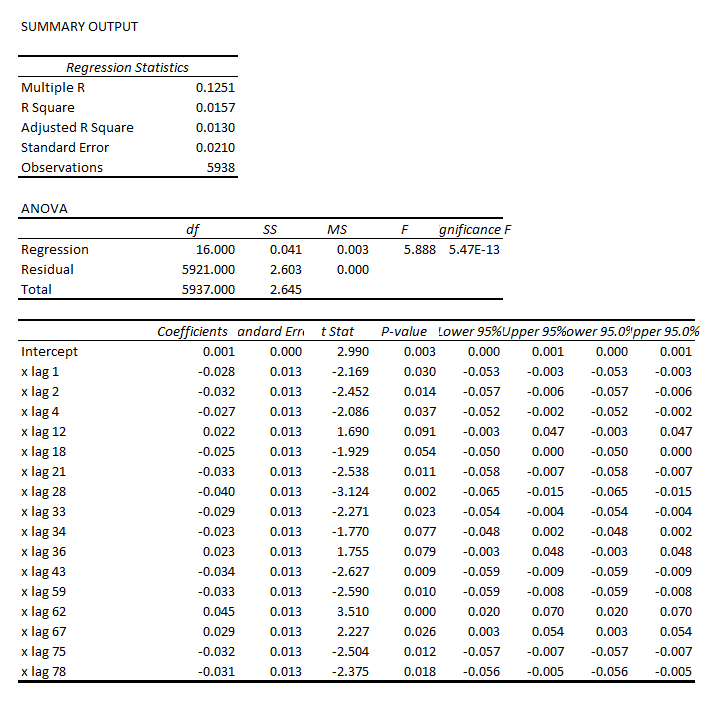
Note the deep depth of the longest lags.
This type of regression, incidentally, makes money in out-of-sample backcasts, although possibly not enough to exceed trading costs unless the size of the trade is large. However, it’s possible that some advanced techniques, such as bagging and boosting, regression trees and random forecasts could enhance the profitability of trading strategies.
Well, a quick look at daily oil futures (CLQ4) from 2007 to the present.
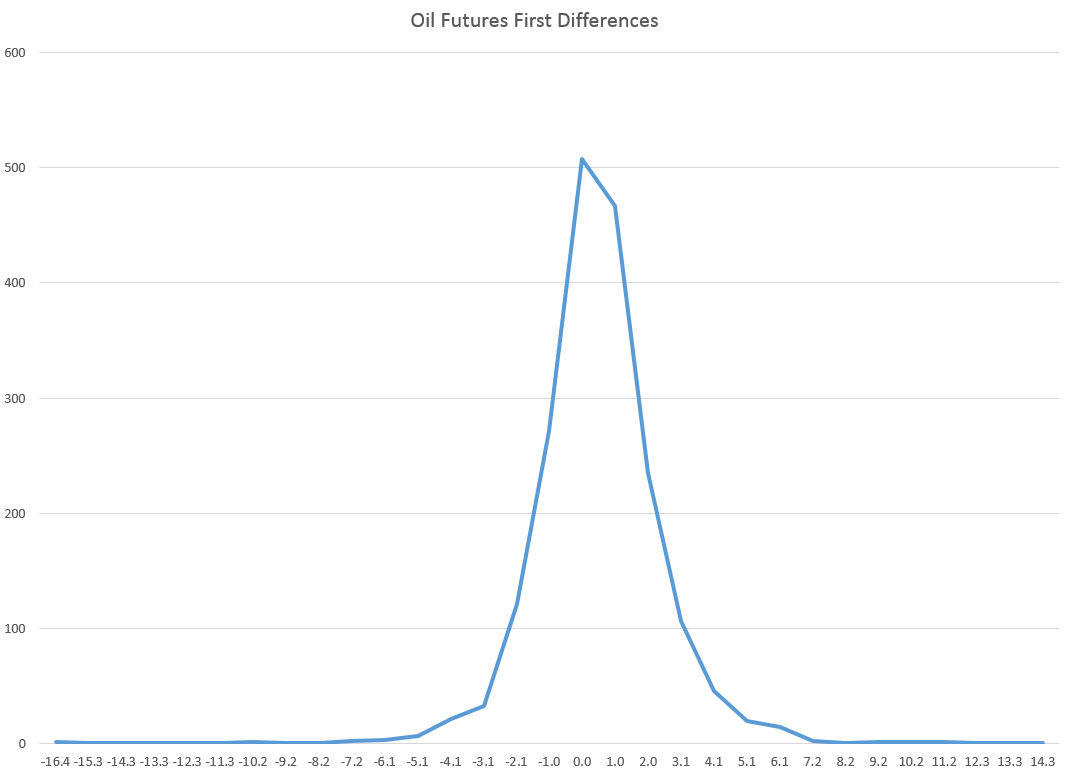
Not quite as symmetric, but still profoundly not a Gaussian distribution.
The Difference It Makes
I’ve got to go back and read Mandelbrot carefully on his analysis of stock and commodity prices. It’s possible that these peaked distributions all fit in a broad class including the Laplace distribution.
But the basic issue here is that the characteristics of these distributions are substantially different than the Gaussian or normal probability distribution. This would affect maximum likelihood estimation of parameters in models, and therefore could affect regression coefficients.
Furthermore, the risk characteristics of assets whose prices have these distributions can be quite different.
And I think there is a moral here about the conventional wisdom and the durability of incorrect ideas.
Top pic is Karl Popper, the philosopher of science