All posts by Clive Jones

Links – February 28

Data Science and Predictive Analytics

Data Scientists Predict Oscar® Winners Again; Social Media May Love Leo, But Data Says “No”

..the data shows that Matthew McConaughey will win best actor for his role in the movie Dallas Buyers Guide; Alfonso Cuaron will win best director for the movie Gravity; and 12 Months a Slave will win the coveted prize for best picture – which is the closest among all the races. The awards will not be a clean sweep for any particular picture, although the other award winners are expected to be Jared Leto for best supporting actor in Dallas Buyers Club; Cate Blanchet for best actress in Blue Jasmine; and Lupita Nyong’o for best supporting actress in 12 Years a Slave.

10 Most Influential Analytics Leaders in India

Pankaj Kulshreshtha – Business Leader, Analytics & Research at Genpact

Rohit Tandon – Vice President, Strategy WW Head of HP Global Analytics

Sameer Dhanrajani – Business Leader, Cognizant Analytics

Srikanth Velamakanni – Co founder and Chief Executive Officer at Fractal Analytics

Pankaj Rai – Director, Global Analytics at Dell

Amit Khanna – Partner at KPMG

Ashish Singru – Director eBay India Analytics Center

Arnab Chakraborty – Managing Director, Analytics at Accenture Consulting

Anil Kaul – CEO and Co-founder at Absolutdata

Dr. N.R.Srinivasa Raghavan, Senior Vice President & Head of Analytics at Reliance Industries Limited

Interview with Jörg Kienitz, co-author with Daniel Wetterau of Financial Modelling: Theory, Implementation and Practice with MATLAB Source

JB: Why MATLAB? Was there a reason for choosing it in this context?

JK: Our attitude was that it was a nice environment for developing models because you do not have to concentrate on the side issues. For instance, if you want to calibrate a model you can really concentrate on implementing the model without having to think about the algorithms doing the optimisation for example. MATLAB offers a lot of optimisation routines which are really reliable and which are fast, which are tested and used by thousands of people in the industry. We thought it was a good idea to use standardised mathematical software, a programming language where all the mathematical functions like optimisation, like Fourier transform, random number generator and so on, are very reliable and robust. That way we could concentrate on the algorithms which are necessary to implement models, and not have to worry about a programming a random number generator or such stuff. That was the main idea, to work on a strong ground and build our house on a really nice foundation. So that was the idea of choosing MATLAB.

Knowledge-based programming: Wolfram releases first demo of new language, 30 years in the making


Economy

Credit Card Debt Threatens Turkey’s Economy – kind of like the subprime mortgage scene in the US before 2008.

..Standard & Poor’s warned in a report last week that the boom in consumer credit had become a serious risk for Turkish lenders. Slowing economic growth, political turmoil and increasing reluctance by foreign investors to provide financing “are prompting a deterioration in the operating environment for Turkish banks,”

A shadow banking map from the New York Fed. Go here and zoom in for detail.

China Sees Expansion Outweighing Yuan, Shadow Bank Risk

China’s Finance Minister Lou Jiwei played down yuan declines and the risks from shadow banking as central bank Governor Zhou Xiaochuan signaled that the nation’s economy can sustain growth of between 7 percent and 8 percent.

Outer Space

715 New Planets Found (You Read That Number Right)

Speaks for itself. That’s a lot of new planets. One of the older discoveries – Tau Boötis b – has been shown to have water vapor in its atmosphere.

Hillary, ‘The Family,’ and Uganda’s Anti-Gay Christian Mafia

GayBashers

I heard about this at the SunDance film gathering in 2013. Apparently, there are links between US and Ugandan groups in promulgating this horrific law.

An Astronaut’s View of the North Korean Electricity Black Hole

NorthKorea

Using Math to Cure Cancer

There are a couple of takes on this.

One is like “big data and data analytics supplanting doctors.”

So Dr. Cary Oberije certainly knows how to gain popularity with conventional-minded doctors.

In Mathematical Models Out-Perform Doctors in Predicting Cancer Patients’ Responses to Treatment she reports on research showing predictive models are better than doctors at predicting the outcomes and responses of lung cancer patients to treatment… “The number of treatment options available for lung cancer patients are increasing, as well as the amount of information available to the individual patient. It is evident that this will complicate the task of the doctor in the future,” said the presenter, Dr Cary Oberije, a postdoctoral researcher at the MAASTRO Clinic, Maastricht University Medical Center, Maastricht, The Netherlands. “If models based on patient, tumor and treatment characteristics already out-perform the doctors, then it is unethical to make treatment decisions based solely on the doctors’ opinions. We believe models should be implemented in clinical practice to guide decisions.”

 CaryOberije                      

Dr Oberije says,

Correct prediction of outcomes is important for several reasons… First, it offers the possibility to discuss treatment options with patients. If survival chances are very low, some patients might opt for a less aggressive treatment with fewer side-effects and better quality of life. Second, it could be used to assess which patients are eligible for a specific clinical trial. Third, correct predictions make it possible to improve and optimise the treatment. Currently, treatment guidelines are applied to the whole lung cancer population, but we know that some patients are cured while others are not and some patients suffer from severe side-effects while others don’t. We know that there are many factors that play a role in the prognosis of patients and prediction models can combine them all.”

At present, prediction models are not used as widely as they could be by doctors…. some models lack clinical credibility; others have not yet been tested; the models need to be available and easy to use by doctors; and many doctors still think that seeing a patient gives them information that cannot be captured in a model.

Dr. Oberije asserts, Our study shows that it is very unlikely that a doctor can outperform a model.

Along the same lines, mathematical models also have been deployed to predict erectile dysfunction after prostate cancer.

I think Dr. Oberije is probably right that physicians could do well to avail themselves of broader medical databases – on prostate conditions, for example – rather than sort of shooting from the hip with each patient.

The other approach is “teamwork between physicians, data and other analysts should be the goal.”

So it’s with interest I note the Moffit Cancer Center in Tampa Florida espouses a teamwork concept in cancer treatment with new targeted molecular therapies.

page1_clip_image006

The IMO program’s approach is to develop mathematical models and computer simulations to link data that is obtained in a laboratory and the clinic. The models can provide insight into which drugs will or will not work in a clinical setting, and how to design more effective drug administration schedules, especially for drug combinations.  The investigators collaborate with experts in the fields of biology, mathematics, computer science, imaging, and clinical science.

“Limited penetration may be one of the main causes that drugs that showed good therapeutic effect in laboratory experiments fail in clinical trials,” explained Rejniak. “Mathematical modeling can help us understand which tumor, or drug-related factors, hinder the drug penetration process, and how to overcome these obstacles.” 

A similar story cropped up in in the Boston Globe – Harvard researchers use math to find smarter ways to defeat cancer

Now, a new study authored by an unusual combination of Harvard mathematicians and oncologists from leading cancer centers uses modeling to predict how tumors mutate to foil the onslaught of targeted drugs. The study suggests that administering targeted medications one at a time may actually insure that the disease will not be cured. Instead, the study suggests that drugs should be given in combination.

header picture: http://www.en.utexas.edu/Classes/Bremen/e316k/316kprivate/scans/hysteria.html

Forecasting and Data Analysis – Principal Component Regression

I get excited that principal components offer one solution to the problem of the curse of dimensionality – having fewer observations on the target variable to be predicted, than there are potential drivers or explanatory variables.

It seems we may have to revise the idea that simpler models typically outperform more complex models.

Principal component (PC) regression has seen a renaissance since 2000, in part because of the work of James Stock and Mark Watson (see also) and Bai in macroeconomic forecasting (and also because of applications in image processing and text recognition).

Let me offer some PC basics  and explore an example of PC regression and forecasting in the context of macroeconomics with a famous database.

Dynamic Factor Models in Macroeconomics

Stock and Watson have a white paper, updated several times, in PDF format at this link

stock watson generalized shrinkage June _2012.pdf

They write in the June 2012 update,

We find that, for most macroeconomic time series, among linear estimators the DFM forecasts make efficient use of the information in the many predictors by using only a small number of estimated factors. These series include measures of real economic activity and some other central macroeconomic series, including some interest rates and monetary variables. For these series, the shrinkage methods with estimated parameters fail to provide mean squared error improvements over the DFM. For a small number of series, the shrinkage forecasts improve upon DFM forecasts, at least at some horizons and by some measures, and for these few series, the DFM might not be an adequate approximation. Finally, none of the methods considered here help much for series that are notoriously difficult to forecast, such as exchange rates, stock prices, or price inflation.

Here DFM refers to dynamic factor models, essentially principal components models which utilize PC’s for lagged data.

What’s a Principal Component?

Essentially, you can take any bundle of data and compute the principal components. If you mean-center and (in most cases) standardize the data, the principal components divide up the variance of this data, based on the size of their associated eigenvalues. The associated eigenvectors can be used to transform the data into an equivalent and same size set of orthogonal vectors. Really, the principal components operate to change the basis of the data, transforming it into an equivalent representation, but one in which all the variables have zero correlation with each other.

The Wikipaedia article on principal components is useful, but there is no getting around the fact that principal components can only really be understood with matrix algebra.

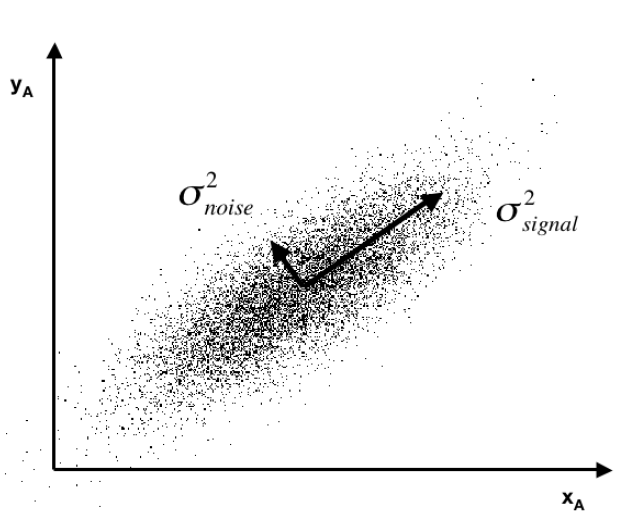
Often you see a diagram, such as the one below, showing a cloud of points distributed around a line passing through the origin of a coordinate system, but at an acute angle to those coordinates.

PrincipalComponents

This illustrates dimensionality reduction with principal components. If we express all these points in terms of this rotated set of coordinates, one of these coordinates – the signal – captures most of the variation in the data. Projections of the datapoints onto the second principal component, therefore, account for much less variance.

Principal component regression characteristically specifies only the first few principal components in the regression equation, knowing that, typically, these explain the largest portion of the variance in the data.

It’s also noteworthy that some researchers are talking about “targeted” principal components. So the first few principal components account for the largest, the next largest, and so on amount of variance in the data. However, the “data” in this context does not include the information we have on the target variable. Targeted principal components therefore involves first developing the simple correlations between the target variable and all the potential predictors, then ordering these potential predictors from highest to lowest correlation. Then, by one means or another, you establish a cutoff, below which you exclude weak potential predictors from the data matrix you use to compute the principal components. Interesting approach which makes sense. Testing it with a variety of examples seems in order. 

PC Regression and Forecasting – A Macroeconomics Example

I downloaded a trial copy of XLSTAT – an Excel add-in with a well-developed set of principal component procedures. In the past, I’ve used SPSS and SAS on corporate networked systems. Now I am using Matlab and GAUSS for this purpose.

The problem is what does it mean to have a time series of principal components? Over the years, there have been relevant discussions – Jolliffe’s key work, for example, and more recent papers.

The problem with time series, apart from the temporal interdependencies, is that you always are calculating the PC’s over different data, as more data comes in. What does this do to the PC’s or factor scores? Do they evolve gradually? Can you utilize the factor scores from a smaller dataset to predict subsequent values of factor scores estimated over an augmented dataset?

Based on a large macroeconomic dataset I downloaded from Mark Watson’s page, I think the answer can be a qualified “yes” to several of these questions. The Mark Watson dataset contains monthly observations on 106 macroeconomic variables for the period 1950 to 2006.

For the variables not bounded within a band, I calculated year-over-year (yoy) growth rates for each monthly observation. Then, I took first differences again over 12 months. These transformations eliminated trends, which mess up the PC computations (basically, if you calculate PC’s with a set of increasing variables, the first PC will represent a common growth factor, and is almost useless for modeling purposes.) The result of my calculations was to center each series at nearly zero, and to make the variability of each series comparable – so I did not standardize.

Anyway, using XLSTAT and Forecast Pro – I find that the factor scores

(a)   Evolve slowly as you add more data.

(b)   Factor scores for smaller datasets provide insight into subsequent factor scores one to several months ahead.

(c)    Amazingly, turning points of the first principal component, which I have studied fairly intensively, are remarkably predictable.

ForecastProPCForecast

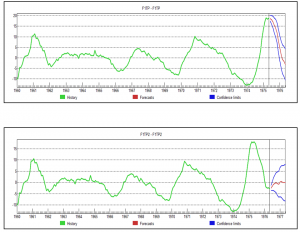
So what are we looking at here (click to enlarge)?

Well, the top chart is the factor score for the first PC, estimated over data to May 1975, with a forecast indicated by the red line at the right of the graph. This forecast produces values which are very close to the factor score values for data estimated to May 1976 – where both datasets begin in 1960. Not only that, but we have here an example of prediction of a turning point bigtime.

Of course this is the magic of Box-Jenkins, since, this factor score series is best estimated, according to Forecast Pro, with an ARIMA model.

I’m encouraged by this exercise to think that it may be possible to go beyond the lagged variable specification in many of these DFM’s to a contemporaneous specification, where the target variable forecasts are based on extrapolations of the relevant PC’s.

In any case, for applied business modeling, if we got something like a medical device new order series (suitably processed data) linked with these macro factor scores, it could be interesting – and we might get something that is not accessible with ordinary methods of exponential smoothing.

Underlying Theory of PC’s

Finally, I don’t think it is possible to do much better than to watch Andrew Ng at Stanford in Lectures 14 and 15. I recommend skipping to 17:09 – seventeen minutes and nine seconds – into Lecture 14, where Ng begins the exposition of principal components. He winds up this Lecture with a fascinating illustration of high dimensionality principal component analysis applied to recognizing or categorizing faces in photographs at the end of this lecture. Lecture 15 also is very useful – especially as it highlights the role of the Singular Value Decomposition (SVD) in actually calculating principal components.

Lecture 14

http://www.youtube.com/watch?v=ey2PE5xi9-A

Lecture 15

http://www.youtube.com/watch?v=QGd06MTRMHs

The Accuracy of Macroeconomics Forecasts – Survey of Professional Forecasters

The Philadelphia Federal Reserve Bank maintains historic records of macroeconomic forecasts from the Survey of Professional Forecasters (SPF). These provide an outstanding opportunity to assess forecasting accuracy in macroeconomics.

For example, in 2014, what is the chance the “steady as she goes” forecast from the current SPF is going to miss a downturn 1, 2, or 3 quarters into the future?

1-Quarter-Ahead Forecast Performance on Real GDP

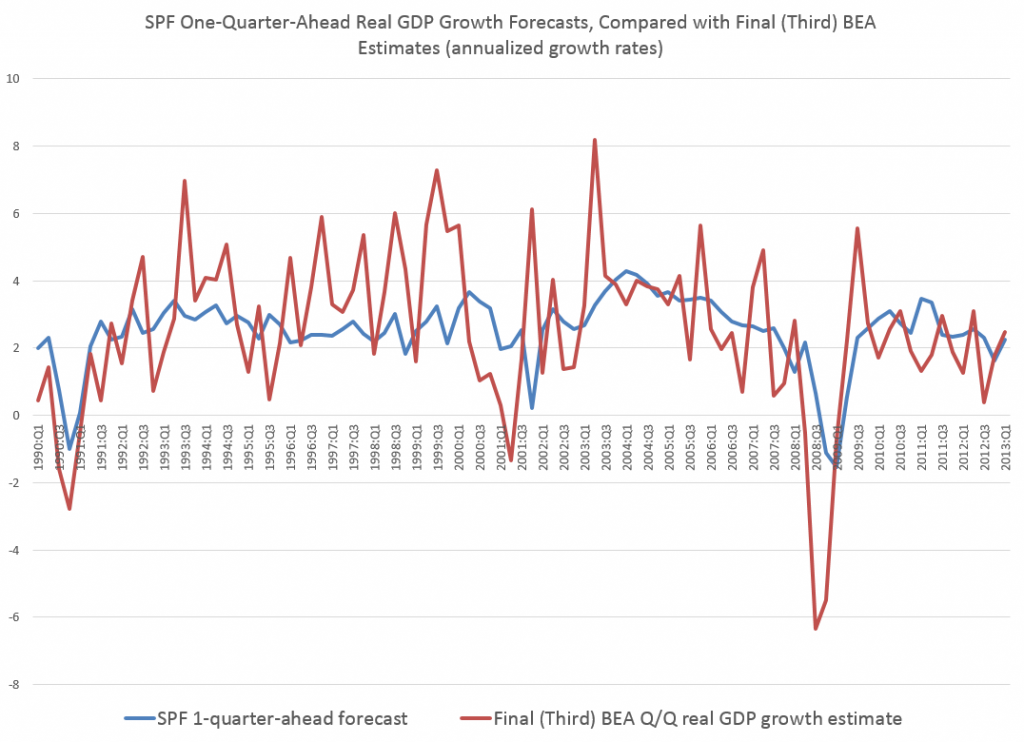
Here is a chart I’ve ginned up for a 1-quarter ahead performance of the SPF forecasts of real GDP since 1990.

SP!1Q

The blue line is the forecast growth rate for real GDP from the SPF on a 1-quarter-ahead basis. The red line is the Bureau of Economic Analysis (BEA) final number for the growth rate for the relevant quarters. The growth rates in both instances are calculated on a quarter-over-quarter basis and annualized.

Side-stepping issues regarding BEA revisions, I used BEA final numbers for the level and growth of real GDP by quarter. This may not completely fair to the SPF forecasters, but it is the yardstick SPF is usually judged by its “consumers.”

Forecast errors for the 1-quarter-ahead forecasts, calculated on this basis, average about 2 percent in absolute value.

They also exhibit significant first order autocorrelation, as is readily suggested by the chart above. So, the SPF tends to under-predict during expansion phases of the business cycle and over-predict during contraction phases.

Currently, the SPF 2014:Q1 forecast for 2014:Q2 is for 3.0 percent real growth of GDP, so maybe it’s unlikely that an average error for this forecast would result in actual 2014:Q2 growth dipping into negative territory.

2-Quarter-Ahead Forecast Performance on Real GDP

Errors for the 2-quarter-ahead SPF forecast, judged against BEA final numbers for real GDP growth, only rise to about 2.14 percent.

However, I am interested in more than the typical forecast error associated with forecasts of real Gross Domestic Product (GDP) on a 1-, 2-, or 3- quarter ahead forecast horizon.

Rather, I’m curious whether the SPF is likely to catch a
downturn over these forecast horizons, given that one will occur.

So if we just look at recessions in this period, in 2001, 2002-2003, and 2008-2009, the performance significantly deteriorates. This can readily be seen in the graph for 1-quarter-ahead forecast errors shown above in 2008 when the consensus SPF forecast indicated a slight recovery for real GDP in exactly the quarter it totally tanked.

Bottom Line

In general, the SPF records provide vivid documentation of the difficulty of predicting turning points in key macroeconomic time series, such as GDP, consumer spending, investment, and so forth. At the same time, the real-time macroeconomic databases provided alongside the SPF records offer interesting opportunities for second- and third-guessing both the experts and the agencies responsible for charting US macroeconomics.

Additional Background

The Survey of Professional Forecasters is the oldest quarterly survey of macroeconomic forecasts in the United States. It dates back to 1968, when it was conducted by the American Statistical Association and the National Bureau of Economic Research (NBER). In 1990, the Federal Reserve Bank of Philadelphia assumed responsibility, and, today, devotes a special section on its website to the SPF, as well “Historical SPF Forecast Data.”

Current and recent contributors to the SPF include “celebrity forecasters” highlighted in other posts here, as well as bank-associated and university-affiliated forecasters.

The survey’s timing is geared to the release of the Bureau of Economic Analysis’ advance report of the national income and product accounts. This report is released at the end of the first month of each quarter. It contains the first estimate of GDP (and components) for the previous quarter. Survey questionnaires are sent after this report is released to the public. The survey’s questionnaires report recent historical values of the data from the BEA’s advance report and the most recent reports of other government statistical agencies. Thus, in submitting their projections, panelists’ information includes data reported in the advance report.

Recent participants include:

Lewis Alexander, Nomura Securities; Scott Anderson, Bank of the West (BNP Paribas Group); Robert J. Barbera, Johns Hopkins University Center for Financial Economics; Peter Bernstein, RCF Economic and Financial Consulting, Inc.; Christine Chmura, Ph.D. and Xiaobing Shuai, Ph.D., Chmura Economics & Analytics; Gary Ciminero, CFA, GLC Financial Economics; Julia Coronado, BNP Paribas; David Crowe, National Association of Home Builders; Nathaniel Curtis, Navigant; Rajeev Dhawan, Georgia State University; Shawn Dubravac, Consumer Electronics Association; Gregory Daco, Oxford Economics USA, Inc.; Michael R. Englund, Action Economics, LLC; Timothy Gill, NEMA; Matthew Hall and Daniil Manaenkov, RSQE, University of Michigan; James Glassman, JPMorgan Chase & Co.; Jan Hatzius, Goldman Sachs; Peter Hooper, Deutsche Bank Securities, Inc.; IHS Global Insight; Fred Joutz, Benchmark Forecasts and Research Program on Forecasting, George Washington University; Sam Kahan, Kahan Consulting Ltd. (ACT Research LLC); N. Karp, BBVA Compass; Walter Kemmsies, Moffatt & Nichol; Jack Kleinhenz, Kleinhenz & Associates, Inc.; Thomas Lam, OSK-DMG/RHB; L. Douglas Lee, Economics from Washington; Allan R. Leslie, Economic Consultant; John Lonski, Moody’s Capital Markets Group; Macroeconomic Advisers, LLC; Dean Maki, Barclays Capital; Jim Meil and Arun Raha, Eaton Corporation; Anthony Metz, Pareto Optimal Economics; Michael Moran, Daiwa Capital Markets America; Joel L. Naroff, Naroff Economic Advisors; Michael P. Niemira, International Council of Shopping Centers; Luca Noto, Anima Sgr; Brendon Ogmundson, BC Real Estate Association; Martin A. Regalia, U.S. Chamber of Commerce; Philip Rothman, East Carolina University; Chris Rupkey, Bank of Tokyo-Mitsubishi UFJ; John Silvia, Wells Fargo; Allen Sinai, Decision Economics, Inc.; Tara M. Sinclair, Research Program on Forecasting, George Washington University; Sean M. Snaith, Ph.D., University of Central Florida; Neal Soss, Credit Suisse; Stephen Stanley, Pierpont Securities; Charles Steindel, New Jersey Department of the Treasury; Susan M. Sterne, Economic Analysis Associates, Inc.; Thomas Kevin Swift, American Chemistry Council; Richard Yamarone, Bloomberg, LP; Mark Zandi, Moody’s Analytics.

Predicting the Hurricane Season

I’ve been focusing recently on climate change and extreme weather events, such as hurricanes and tornados. This focus is interesting in its own right, offering significant challenges to data analysis and predictive analytics, and I also see strong parallels to economic forecasting.

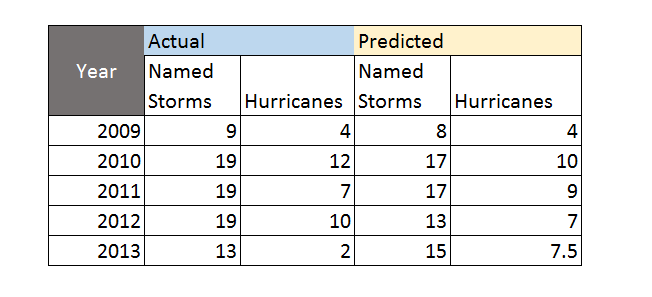
The Florida State University Center for Ocean-Atmospheric Prediction Studies (COAPS) garnered good press 2009-2012, for its accurate calls on the number of hurricanes and named tropical storms in the North Atlantic. Last year was another story, however, and it’s interesting to explore why 2013 was so unusual – there being only two (2) hurricanes and no major hurricanes over the whole season.

Here’s the track record for COAPS, since it launched its new service.

Hurricaneforecastaccuracy

The forecast for 2013 was a major embarrassment, inasmuch as the Press Release at the beginning of June 2013 predicted an “above-average season.”

Tim LaRow, associate research scientist at COAPS, and his colleagues released their fifth annual Atlantic hurricane season forecast today. Hurricane season begins June 1 and runs through Nov. 30.

This year’s forecast calls for a 70 percent probability of 12 to 17 named storms with five to 10 of the storms developing into hurricanes. The mean forecast is 15 named storms, eight of them hurricanes, and an average accumulated cyclone energy (a measure of the strength and duration of storms accumulated during the season) of 135.

“The forecast mean numbers are identical to the observed 1995 to 2010 average named storms and hurricanes and reflect the ongoing period of heightened tropical activity in the North Atlantic,” LaRow said.

The COAPS forecast is slightly less than the official National Oceanic and Atmospheric Administration (NOAA) forecast that predicts a 70 percent probability of 13 to 20 named storms with seven to 11 of those developing into hurricanes this season…

What Happened?

Hurricane forecaster Gary Bell is quoted as saying,

“A combination of conditions acted to offset several climate patterns that historically have produced active hurricane seasons,” said Gerry Bell, Ph.D., lead seasonal hurricane forecaster at NOAA’s Climate Prediction Center, a division of the National Weather Service. “As a result, we did not see the large numbers of hurricanes that typically accompany these climate patterns.”

More informatively,

Forecasters say that three main features loom large for the inactivity: large areas of sinking air, frequent plumes of dry, dusty air coming off the Sahara Desert, and above-average wind shear. None of those features were part of their initial calculations in making seasonal projections. Researchers are now looking into whether they can be predicted in advance like other variables, such as El Niño and La Niña events.

I think it’s interesting NOAA stuck to its “above-normal season” forecast as late as August 2013, narrowing the numbers only a little. At the same time, neutral conditions with respect to la Nina and el Nino in the Pacific were acknowledged as influencing the forecasts. The upshot – the 2013 hurricane season in the North Atlantic was the 7th quietest in 70 years.

Risk Behaviors and Extreme Events

Apparently, it’s been more than 8 years since a category 3 hurricane hit the mainland of the US. This is chilling, inasmuch as Sandy, which caused near-record damage on the East Coast, was only a category 1 when it made landfall in New Jersey in 2012.

Many studies highlight a “ratchet pattern” in risk behaviors following extreme weather, such as a flood or hurricane. Initially, after the devastation, people engage in lots of protective, pre-emptive behavior. Typically, flood insurance coverage shoots up, only to gradually fall off, when further flooding has not been seen for a decade or more.

Similarly, after a volcanic eruption, in Indonesia, for example, and destruction of fields and villages by lava flows or ash – people take some time before they re-claim those areas. After long enough, these events can give rise to rich soils, supporting high crop yields. So since the volcano has not erupted for, say, decades or a century, people move back and build even more intensively than before.

This suggests parallels with economic crisis and its impacts, and measures taken to make sure “it never happens again.”

I also see parallels between weather and economic forecasting.

Maybe there is a chaotic element in economic dynamics, just as there almost assuredly is in weather phenomena.

Certainly, the curse of dimension in forecasting models translates well from weather to economic forecasting. Indeed, a major review of macroeconomic forecasting, especially of its ability to predict recessions, concludes that economic models are always “fighting the last war,” in the sense that new factors seem to emerge and take control during every major economic crises. Things do not repeat themselves exactly. So, if the “true” recession forecasting model has legitimately 100 drivers or explanatory variables, it takes a long historic record to sort out the separate influences of these – and the underlying technological basis of the economy is changing all the time.

Tornado Frequency Distribution

Data analysis, data science, and advanced statistics have an important role to play in climate science.

James Elsner’s blog Hurricane & Tornado Climate offers salient examples, in this regard.

Yesterday’s post was motivated by an Elsner suggestion that the time trend in maximum wind speeds of larger or more powerful hurricanes is strongly positive since weather satellite observations provide better measurement (post-1977).

Here’s a powerful, short video illustrating the importance of proper data segmentation and statistical characterization for tornado data – especially for years of tremendous devastation, such as 2011.

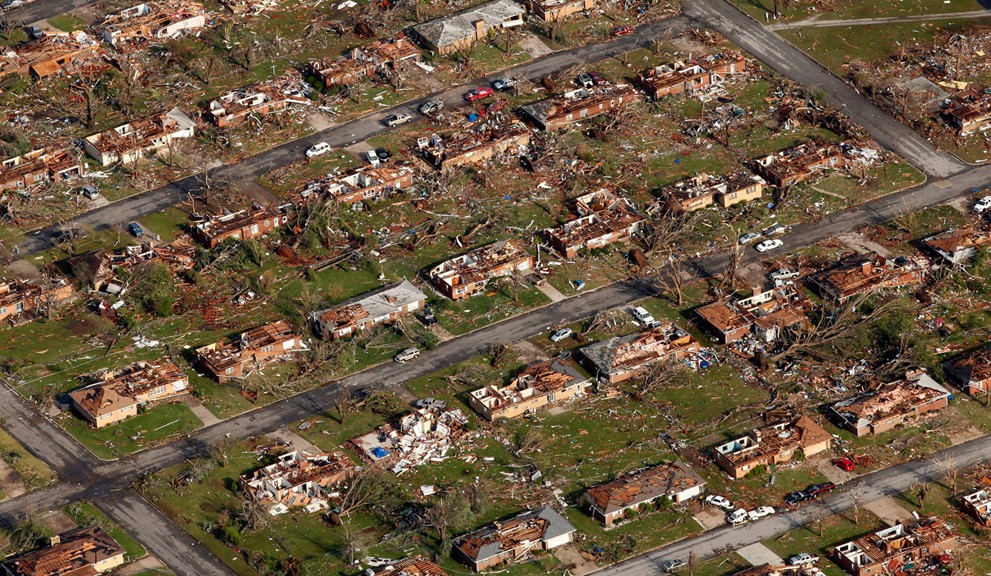
Events that year have a more than academic interest for me, incidentally, since my city of birth – Joplin, Missouri – suffered the effects of a immense supercell which touched down and destroyed everything in its path, including my childhood home. The path of this monster was, at points, nearly a mile wide, and it gouged out a track several miles through this medium size city.

Here is Elsner’s video integrating data analysis with matters of high human import.

There is a sort of extension, in my mind, of the rational expectations issue to impacts of climate change and extreme weather. The question is not exactly one people living in areas subject to these events might welcome. But it is highly relevant to data analysis and statistics.

The question simply is whether US property and other insurance companies are up-to-speed on the type of data segmentation and analysis that is needed to adequately capture the probable future impacts of some of these extreme weather events.

This may be where the rubber hits the road with respect to Bayesian techniques – popular with at least some prominent climate researchers, because they allow inclusion of earlier, less-well documented historical observations.

Quantile Regression

There’s a straight-forward way to understand the value and potential significance of quantile regression – consider the hurricane data referenced in James Elsner’s blog Hurricane & Tornado Climate.

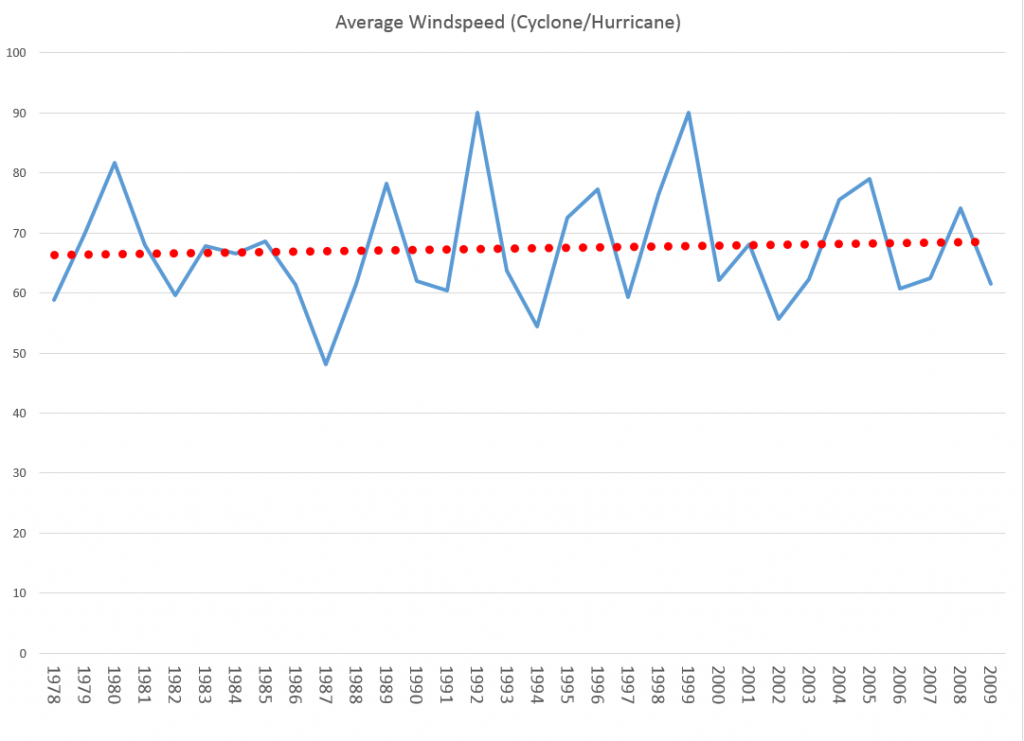
Here is a plot of average windspeed of hurricanes in the Atlantic and Gulf Coast since satellite observations began after 1977.

HurricaneAvgWS

Based on averages, the linear trend line increases about 2 miles per hour over this approximately 30 year period.

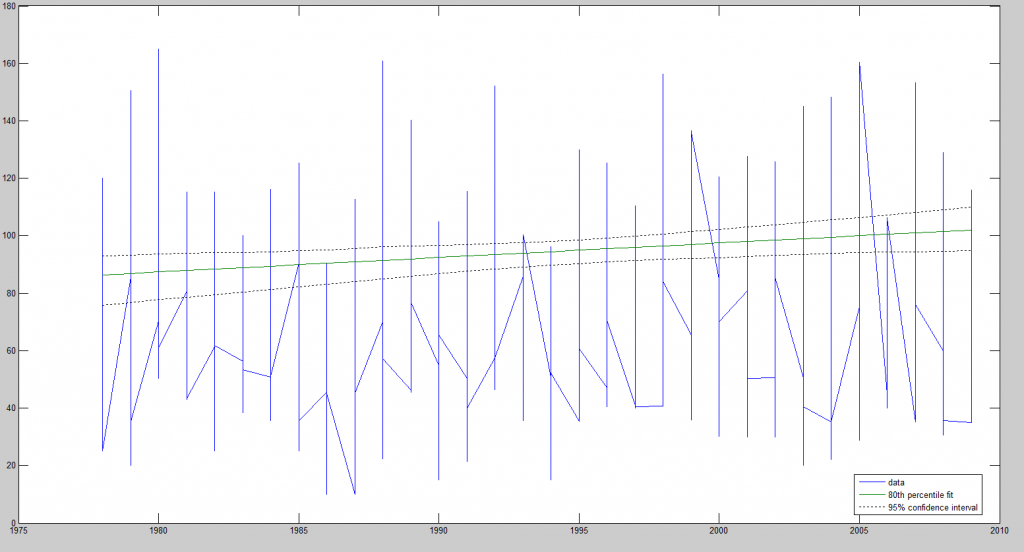
An 80th percentile quantile regression trend line, on the other hand, with this data indicates that the trend in the more violent hurricanes shows an about 15 mph increase over this same period.

HurricaneQuartileReg

In other words, if we look at the hurricanes which are in the 80th percentile or more, there is a much stronger trend in maximum wind speeds, than in the average for all US-related hurricanes in this period.

A quantile q, 0<q<1, splits the data into proportions q below and 1-q above. The most familiar quantile, thus, may be the 50th percentile which is the quantile which splits the data at the median – 50 percent below and 50 percent above.

Quantile regression (QR) was developed, in its modern incarnation by Koenker and Basset in 1978. QR is less influenced by non-normal errors and outliers, and provides a richer characterization of the data.

Thus, QR encourages considering the impact of a covariate on the entire distribution of y, not just is conditional mean.

Roger Koenker and Kevin F. Hallock’s Quantile Regression in the Journal of Economic Perspectives 2001 is a standard reference.

We say that a student scores at the tth quantile of a standardized exam if he performs better than the proportion t of the reference group of students and worse than the proportion (1–t). Thus, half of students perform better than the median student and half perform worse. Similarly, the quartiles divide the population into four segments with equal proportions of the reference population in each segment. The quintiles divide the population into five parts; the deciles into ten parts. The quantiles, or percentiles, or occasionally fractiles, refer to the general case.

Just as we can define the sample mean as the solution to the problem of minimizing a sum of squared residuals, we can define the median as the solution to the problem of minimizing a sum of absolute residuals.

Ordinary least squares (OLS) regression minimizes the sum of squared errors of observations minus estimates. This minimization leads to explicit equations for regression parameters, given standard assumptions.

Quantile regression, on the other hand, minimizes weighted sums of absolute deviations of observations on a quantile minus estimates. This minimization problem is solved by the simplex method of linear programming, rather than differential calculus. The solution is robust to departures from normality of the error process and outliers.

Koenker’s webpage is a valuable resource with directions for available software to estimate QR. I utilized Mathworks Matlab for my estimate of a QR with the hurricane data, along with a supplemental program for quantreg(.) I downloaded from their site.

Here are a couple of short, helpful videos from Econometrics Academy.

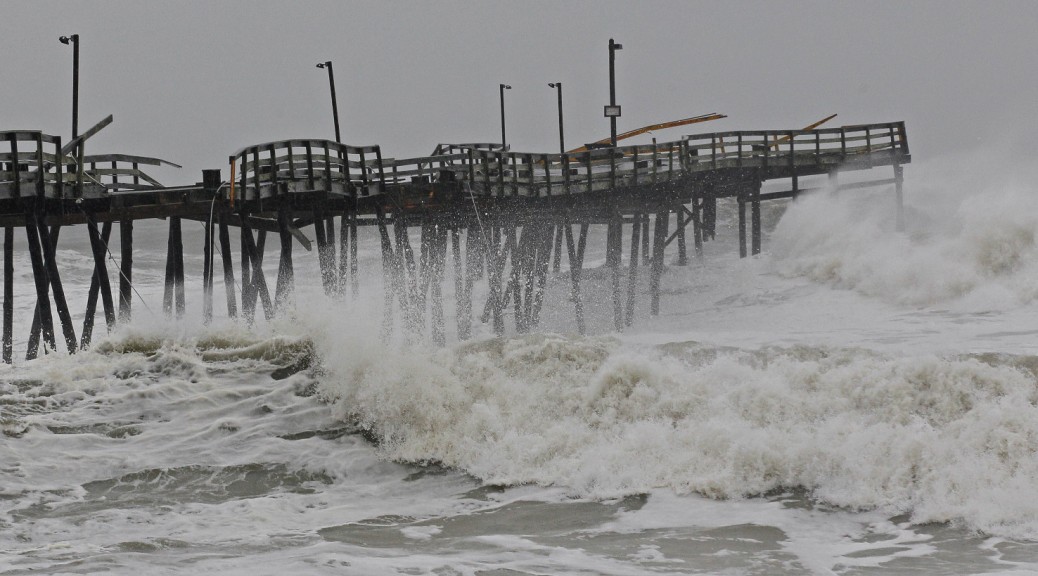
Featured image from http://www.huffingtonpost.com/2012/10/29/hurricane-sandy-apps-storm-tracker-weather-channel-red-cross_n_2039433.html

Possibilities for Abrupt Climate Change

The National Research Council (NRC) published ABRUPT IMPACTS OF CLIMATE CHANGE recently, downloadable from the National Academies Press website.

It’s the third NRC report to focus on abrupt climate change, the first being published in 2002. NRC members are drawn from the councils of the National Academy of Sciences, the National Academy of Engineering, and the Institute of Medicine.

The climate change issue is a profound problem in causal discovery and forecasting, to say the very least.

Before I highlight graphic and pictoral resources of the recent NRC report, let me note that Menzie Chin at Econbrowser posted recently on Economic Implications of Anthropogenic Climate Change and Extreme Weather. Chin focuses on the scientific consensus, presenting graphics illustrating the more or less relentless upward march of global average temperatures and estimates (by James Stock no less) of the man-made (anthropogenic) component.

The Econbrowser Comments section is usually interesting and revealing, and this time is no exception. Comments range from “climate change is a left-wing conspiracy” and arguments that “warmer would be better” to the more defensible thought that coming to grips with global climate change would probably mean restructuring our economic setup, its incentives, and so forth.

But I do think the main aspects of the climate change problem – is it real, what are its impacts, what can be done – are amenable to causal analysis at fairly deep levels.

To dispel ideological nonsense, current trends in energy use – growing globally at about 2 percent per annum over a long period – lead to the Earth becoming a small star within two thousand years, or less – generating the amount of energy radiated by the Sun. Of course, changes in energy use trends can be expected before then, when for example the average ambient temperature reaches the boiling point of water, and so forth. These types of calculations also can be made realistically about the proliferation of the automobile culture globally with respect to air pollution and, again, contributions to average temperature. Or one might simply consider the increase in the use of materials and energy for a global population of ten billion, up from today’s number of about 7 billion.

Highlights of the Recent NRC Report

It’s worth quoting the opening paragraph of the report summary –

Levels of carbon dioxide and other greenhouse gases in Earth’s atmosphere are exceeding levels recorded in the past millions of years, and thus climate is being forced beyond the range of the recent geological era. Lacking concerted action by the world’s nations, it is clear that the future climate will be warmer, sea levels will rise, global rainfall patterns will change, and ecosystems will be altered.

So because of growing CO2 (and other greenhouse gases), climate change is underway.

The question considered in ABRUPT IMPACTS OF CLIMATE CHANGE (AICH), however, is whether various thresholds will be crossed, whereby rapid, relatively discontinuous climate change occurs. Such abrupt changes – with radical shifts occurring over decades, rather than centuries – before. AICH thus cites,

..the end of the Younger Dryas, a period of cold climatic conditions and drought in the north that occurred about 12,000 years ago. Following a millennium-long cold period, the Younger Dryas abruptly terminated in a few decades or less and is associated with the extinction of 72 percent of the large-bodied mammals in North America.

The main abrupt climate change noted in AICH is rapid decline of the Artic sea ice. AICH puts up a chart which is one of the clearest examples of a trend you can pull from environmental science, I would think.
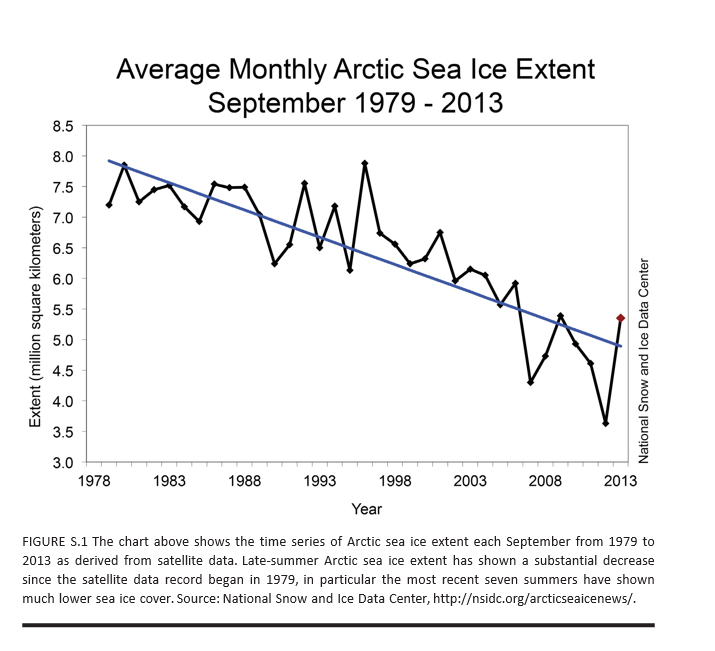
ArticSeaIce

AICH also puts species extinction front and center as a near-term and certain discontinuous effect of current trends.

Apart from melting of the Artic sea ice and species extinction, AICH lists destabilization of the Antarctic ice sheet as a nearer term possibility with dramatic consequences. Because a lot of this ice in the Antarctic is underwater, apparently, it is more at risk than, say, the Greenland ice sheet. Melting of either one (or both) of these ice sheets would raise sea levels tens of meters – an estimated 60 meters with melting of both.

Two other possibilities mentioned in previous NRC reports on abrupt climate change are discussed and evaluated as low probability developments until after 2100. These are stopping of the ocean currents that circulate water in the Atlantic, warming northern Europe, and release of methane from permafrost or deep ocean deposits.

The AMOC is the ocean circulation pattern that involves the northward flow of warm near-surface waters into the northern North Atlantic and Nordic Seas, and the south- ward flow at depth of the cold dense waters formed in those high latitude regions. This circulation pattern plays a critical role in the global transport of oceanic heat, salt, and carbon. Paleoclimate evidence of temperature and other changes recorded in North Atlantic Ocean sediments, Greenland ice cores and other archives suggest that the AMOC abruptly shut down and restarted in the past—possibly triggered by large pulses of glacial meltwater or gradual meltwater supplies crossing a threshold—raising questions about the potential for abrupt change in the future.

Despite these concerns, recent climate and Earth system model simulations indicate that the AMOC is currently stable in the face of likely perturbations, and that an abrupt change will not occur in this century. This is a robust result across many different models, and one that eases some of the concerns about future climate change.

With respect to the methane deposits in Siberia and elsewhere,

Large amounts of carbon are stored at high latitudes in potentially labile reservoirs such as permafrost soils and methane-containing ices called methane hydrate or clathrate, especially offshore in ocean marginal sediments. Owing to their sheer size, these carbon stocks have the potential to massively affect Earth’s climate should they somehow be released to the atmosphere. An abrupt release of methane is particularly worrisome because methane is many times more potent than carbon dioxide as a greenhouse gas over short time scales. Furthermore, methane is oxidized to carbon dioxide in the atmosphere, representing another carbon dioxide pathway from the biosphere to the atmosphere.

According to current scientific understanding, Arctic carbon stores are poised to play a significant amplifying role in the century-scale buildup of carbon dioxide and methane in the atmosphere, but are unlikely to do so abruptly, i.e., on a timescale of one or a few decades. Although comforting, this conclusion is based on immature science and sparse monitoring capabilities. Basic research is required to assess the long-term stability of currently frozen Arctic and sub-Arctic soil stocks, and of the possibility of increasing the release of methane gas bubbles from currently frozen marine and terrestrial sediments, as temperatures rise.

So some bad news and, I suppose, good news – more time to address what would certainly be completely catastrophic to the global economy and world population.

AICH has some neat graphics and pictoral exhibits.

For example, Miami Florida will be largely underwater within a few decades, according to many standard forecasts of increases in sea level (click to enlarge).
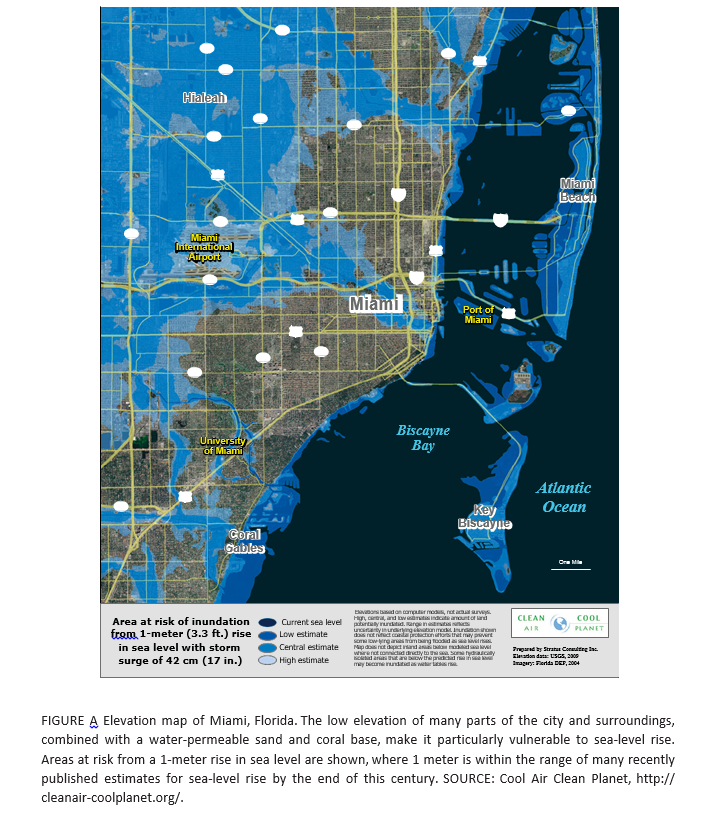
Florida

But perhaps most chilling of all (actually not a good metaphor here but you know what I mean) is a graphic I have not seen before, but which dovetails with my initial comments and observations of physicists.

This chart toward the end of the AICH report projects increase in global temperature beyond any past historic level (or prehistoric, for that matter) by the end of the century.
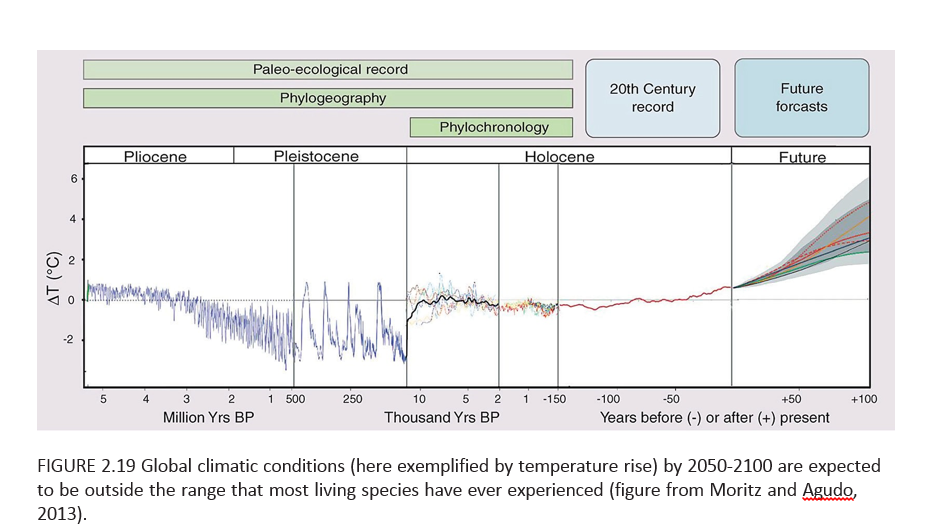
TempRise

So, for sure, there will be species extinction in the near term, hopefully not including the human species just yet.

Economic Impacts

In closing, I do think the primary obstacle to a sober evaluation of climate change involves social and economic implications. The climate change deniers may be right – acknowledging and adequately planning for responses to climate change would involve significant changes in social control and probably economic organization.

Of course, the AICH adopts a more moderate perspective – let’s be sure and set up monitoring of all this, so we can be prepared.

Hopefully, that will happen to some degree.

But adopting a more pro-active stance seems unlikely, at least in the near term. There is a wholesale rush to bringing one to several trillion persons who are basically living in huts with dirt floors into “the modern world.” Their children are traveling to cities, where they will earn much higher incomes, probably, and send money back home. The urge to have a family is almost universal, almost a concomitant of healthy love of a man and a woman. Tradeoffs between economic growth and environmental quality are a tough sell, when there are millions of new consumers and workers to be incorporated into the global supply chain. The developed nations – where energy and pollution output ratios are much better – are not persuasive when they suggest a developing giant like India or China should tow the line, limit energy consumption, throttle back economic growth in order to have a cooler future for the planet. You already got yours Jack, and now you want to cut back? What about mine? As standards of living degrade in the developed world with slower growth there, and as the wealthy grab more power in the situation, garnering even more relative wealth, the political dialogue gets stuck, when it comes to making changes for the good of all.

I could continue, and probably will sometime, but it seems to me that from a longer term forecasting perspective darker scenarios could well be considered. I’m sure we will see quite a few of these. One of the primary ones would be a kind of devolution of the global economy – the sort of thing one might expect if air travel were less possible because of, say, a major uptick in volcanism, or huge droughts took hold in parts of Asia.

Again and again, I come back to the personal thought of local self-reliance. There has been a growth with global supply chains and various centralizations, mergers, and so forth toward de-skilling populations, pushing them into meaningless service sector jobs (fast food), and losing old knowledge about, say, canning fruits and vegetables, or simply growing your own food. This sort of thing has always been a sort of quirky alternative to life in the fast lane. But inasmuch as life in the fast lane involves too much energy use for too many people to pursue, I think decentralized alternatives for lifestyle deserve a serious second look.

Polar bear on ice flow at top from http://metro.co.uk/2010/03/03/polar-bears-cling-to-iceberg-as-climate-change-ruins-their-day-141656/

Causal and Bayesian Networks

In his Nobel Acceptance Lecture, Sir C.J.W. Granger mentions that he did not realize people had so many conceptions of causality, nor that his proposed test would be so controversial – resulting in its being confined to a special category “Granger Causality.’

That’s an astute observation – people harbor many conceptions and shades of meaning for the idea of causality. It’s in this regard that renewed efforts recently – motivated by machine learning – to operationalize the idea of causality, linking it with both directed graphs and equation systems, is nothing less than heroic.

However, despite the confusion engendered by quantum theory and perhaps other “new science,” the identification of “cause” can be materially important in the real world. For example, if you are diagnosed with metastatic cancer, it is important for doctors to discover where in the body the cancer originated – in the lungs, in the breast, and so forth. This can be challenging, because cancer mutates, but making this identification can be crucial for selecting chemotherapy agents. In general, medicine is full of problems of identifying causal nexus, cause and effect.

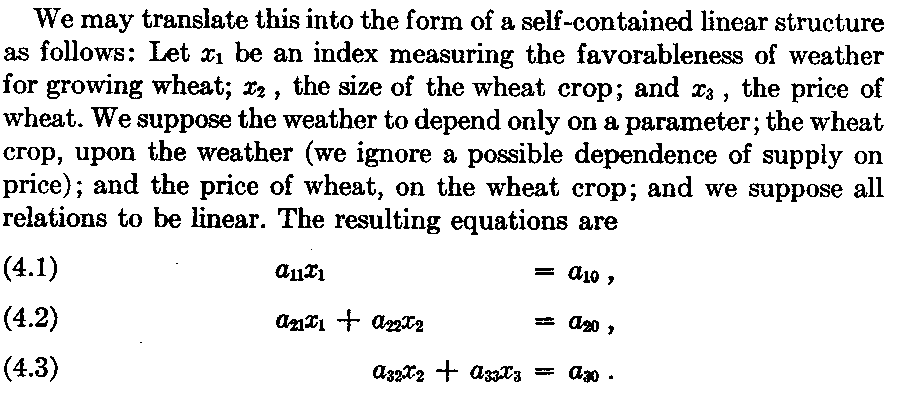
In economics, Herbert Simon, also a Nobel Prize recipient, actively promoted causal analysis and its representation in graphs and equations. In Causal Ordering and Identifiability, Simon writes,

Simon1

For example, we cannot reverse the causal chain poor growing weather → small wheat crops → increase in price of wheat by an attribution increase in price of wheat → poor growing weather.

Simon then proposes that the weather to price causal system might be represented by a series of linear, simultaneous equations, as follows:

Simon2

This example can be solved recursively, first by solving for x1, then by using this value of x1 to solve for x2, and then using the so-obtained values of x1 and x2 to solve for x3. So the system is self-contained, and Simon discusses other conditions. Probably the most important is assymmetry and the direct relationship between variables.

Readers interested in the milestones in this discourse, leading to the present, need to be aware of Pearl’s seminal 1998 article, which begins,

It is an embarrassing but inescapable fact that probability theory, the official mathematical language of many empirical sciences, does not permit us to express sentences such as “”Mud does not cause rain”; all we can say is that the two events are mutually correlated, or dependent – meaning that if we find one, we can expect to encounter the other.”

Positive Impacts of Machine Learning

So far as I can tell, the efforts of Simon and even perhaps Pearl would have been lost in endless and confusing controversy, were it not for the emergence of machine learning as a distinct specialization

A nice, more recent discussion of causality, graphs, and equations is Denver Dash’s A Note on the Correctness of the Causal Ordering Algorithm. Dash links equations with directed graphs, as in the following example.

DAGandEQS Dash shows that Simon’s causal ordering algorithm (COA) to match equations to a cluster graph is consistent with more recent methods of constructing directed causal graphs from the same equation set.

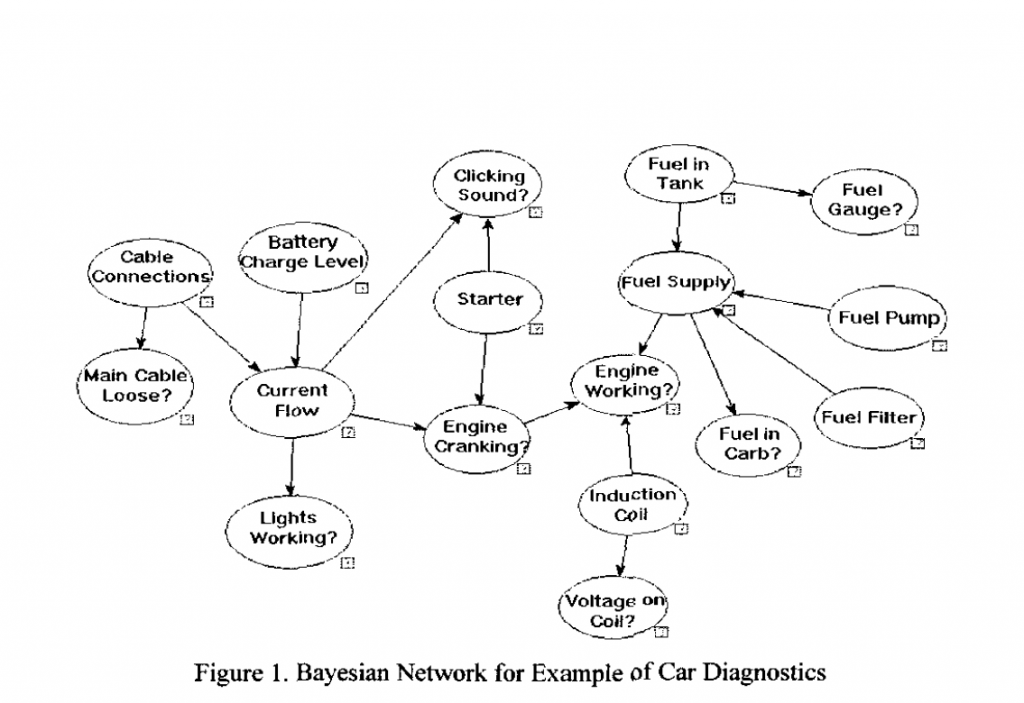
My reading suggests a direct line of development, involving attention to the vertices and nodes of directed acyclic graphs (DAG’s) – or graphs without any backward connections or loops – and evolution to Bayesian networks – which are directed graphs with associated probabilities.

Here is are two examples of Bayesian networks.

First, another contribution from Dash and others

BayesNet

So clearly Bayesian networks are closely akin to expert systems, combining elements of causal reasoning, directed graphs, and conditional probabilities.

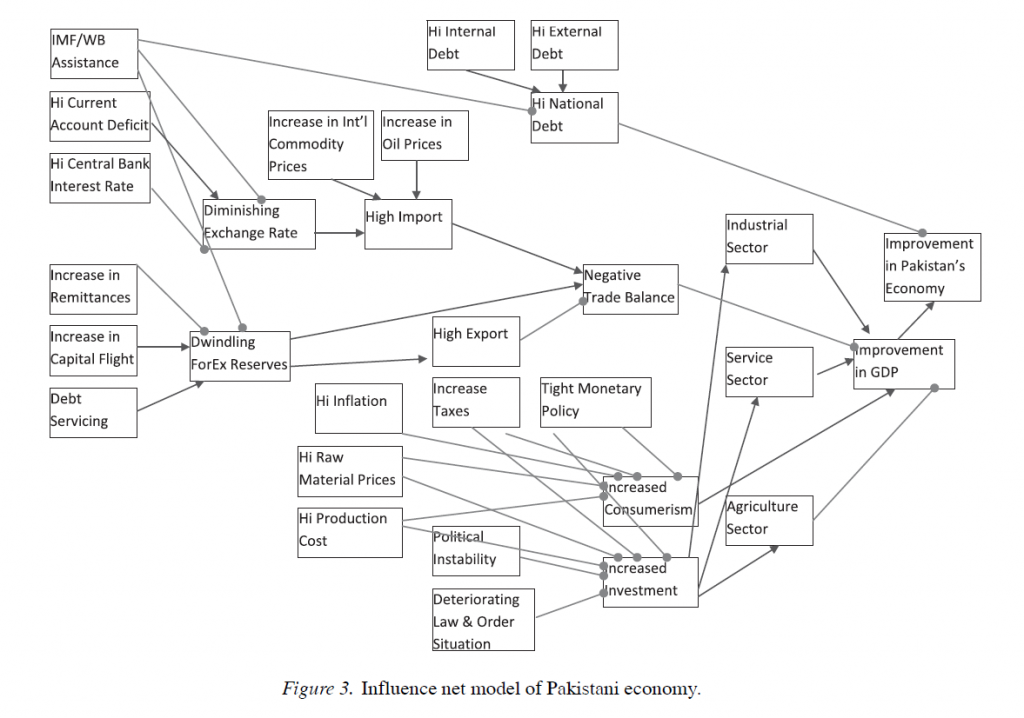
The scale of Bayesian networks can be much larger, or societal-wide, as this example from Using Influence Nets in Financial Informatics: A Case Study of Pakistan.

BnetPaki

The development of machine systems capable of responding to their environment – robots, for example – are a driver of this work currently. This leads to the distinction between identifying causal relations by observation or from existing data, and from intervention, action, or manipulation. Uncovering mechanisms by actively energizing nodes in a directed graph, one-by-one, is, in some sense, an ideal approach. However, there are clearly circumstances – again medical research provides excellent examples – where full-scale experimentation is simply not possible or allowable.

At some point, combinatorial analysis is almost always involved in developing accurate causal networks, and certainly in developing Bayesian networks. But this means that full implementation of these methods must stay confined to smaller systems, cut corners in various ways, or wait for development (one hopes) of quantum computers.

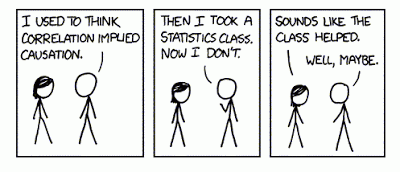
Note: header cartoon from http://xkcd.com/552/

Causal Discovery

So there’s a new kid on the block, really a former resident who moved back to the neighborhood with spiffy new toys – causal discovery.

Competitions and challenges give a flavor of this rapidly developing field – for example, the Causality Challenge #3: Cause-effect pairs, sponsored by a list of pre-eminent IT organizations and scientific societies (including Kaggle).

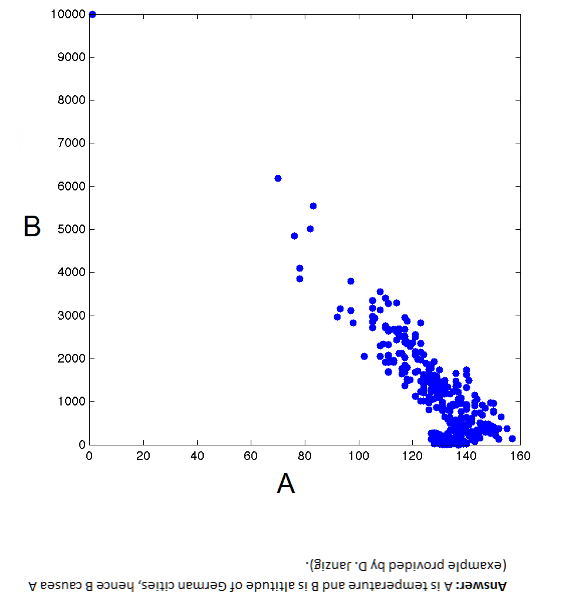
By way of illustration, B → A but A does not cause B – Why?

Kagglealttemp

These data, as the flipped answer indicates, are temperature and altitude of German cities. So altitude causes temperature, but temperature obviously does not cause altitude.

The non-linearity in the scatter diagram is a clue. Thus, values of variable A above about 130 map onto more than one value of B, which is problematic from conventional definition of causality. One cause should not have two completely different effects, unless there are confounding variables.

It’s a little fuzzy, but the associated challenge is very interesting, and data pairs still are available.

We provide hundreds of pairs of real variables with known causal relationships from domains as diverse as chemistry, climatology, ecology, economy, engineering, epidemiology, genomics, medicine, physics. and sociology. Those are intermixed with controls (pairs of independent variables and pairs of variables that are dependent but not causally related) and semi-artificial cause-effect pairs (real variables mixed in various ways to produce a given outcome).  This challenge is limited to pairs of variables deprived of their context.

Asymmetries As Clues to Causal Direction of Influence

The causal direction in the graph above is suggested by the non-invertibility of the functional relationship between B and A.

Another clue from reversing the direction of causal influence relates to the error distributions of the functional relationship between pairs of variables. This occurs when these error distributions are non-Gaussian, as Patrik Hoyer and others illustrate in Nonlinear causal discovery with additive noise models.

The authors present simulation and empirical examples.

Their first real-world example comes from data on eruptions of the Old Faithful geyser in Yellowstone National Park in the US.

OldFaithful Hoyer et al write,

The first dataset, the “Old Faithful” dataset [17] contains data about the duration of an eruption and the time interval between subsequent eruptions of the Old Faithful geyser in Yellowstone National Park, USA. Our method obtains a p-value of 0.5 for the (forward) model “current duration causes next interval length” and a p-value of 4.4 x 10⁻⁹ for the (backward) model “next interval length causes current duration”. Thus, we accept the model where the time interval between the current and the next eruption is a function of the duration of the current eruption, but reject the reverse model. This is in line with the chronological ordering of these events. Figure 3 illustrates the data, the forward and backward fit and the residuals for both fits. Note that for the forward model, the residuals seem to be independent of the duration, whereas for the backward model, the residuals are clearly dependent on the interval length.

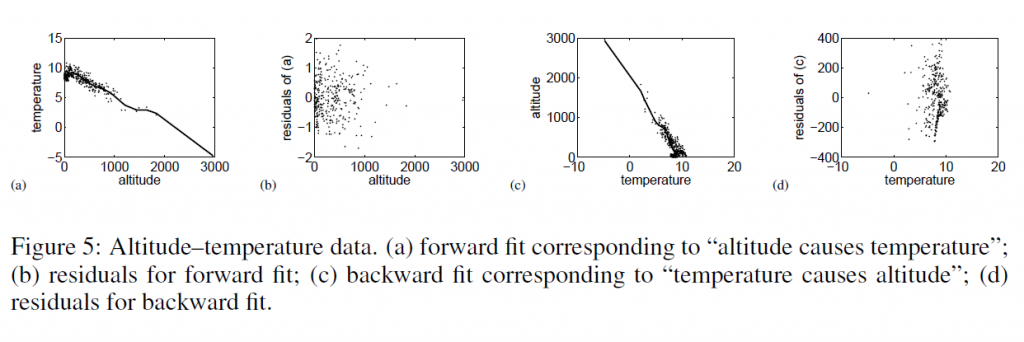
Then, they too consider temperature and altitude pairings.

tempaltHere, the correct model – altitude causes temperature – results in a much more random scatter of residuals, than the reverse direction model.

Patrik Hoyer and Aapo Hyvärinen are a couple of names from this Helsinki group of researchers whose papers are interesting to read and review.

One of the early champions of this resurgence of interest in causality works from a department of philosophy – Peter Spirtes. It’s almost as if the discussion of causal theory were relegated to philosophy, to be revitalized by machine learning and Big Data:

The rapid spread of interest in the last three decades in principled methods of search or estimation of causal relations has been driven in part by technological developments, especially the changing nature of modern data collection and storage techniques, and the increases in the processing power and storage capacities of computers. Statistics books from 30 years ago often presented examples with fewer than 10 variables, in domains where some background knowledge was plausible. In contrast, in new domains such as climate research (where satellite data now provide daily quantities of data unthinkable a few decades ago), fMRI brain imaging, and microarray measurements of gene expression, the number of variables can range into the tens of thousands, and there is often limited background knowledge to reduce the space of alternative causal hypotheses. Even when experimental interventions are possible, performing the many thousands of experiments that would be required to discover causal relationships between thousands or tens of thousands of variables is often not practical. In such domains, non-automated causal discovery techniques from sample data, or sample data together with a limited number of experiments, appears to be hopeless, while the availability of computers with increased processing power and storage capacity allow for the practical implementation of computationally intensive automated search algorithms over large search spaces.

Introduction to Causal Inference