Category Archives: cell phone data analytics

Links May 10, 2015

I start these Links with how the polls in the UK Election fell on their face and why. The cell phone is somewhat implicated, and, almost by association, I move onto the Internet of Everything (IoE), then to thoughts on how the Internet and artificial intelligence (AI) is shaping things.

It’s important to keep things loose and open on occasion, since the world itself doesn’t show tremendous closure, but is open, and evolving.

Election Poll Predictions In La-La Land

Nate Silver, the celebrity forecaster heading up FiveThirtyEight, had a big miss in calling the recent British Election (See What We Got Wrong In Our 2015 U.K. General Election Model and Nate Silver: Polls are failing us).

DavidCameron

A similar misfire happened in the recent Israeli elections, where Netanyuahu won by significant numbers in an election predicted to be neck-and-neck.

The cell phone may be partly to blame, as noted in British polling flop prompts global reassessments

..changes in communications are threatening the viability of public election polling in many developed countries where the landline phone was once a reliable medium for representative surveys.

This is going to be a big forecasting issue in the upcoming General Elections in the US.

The Internet of Everything (IoE)

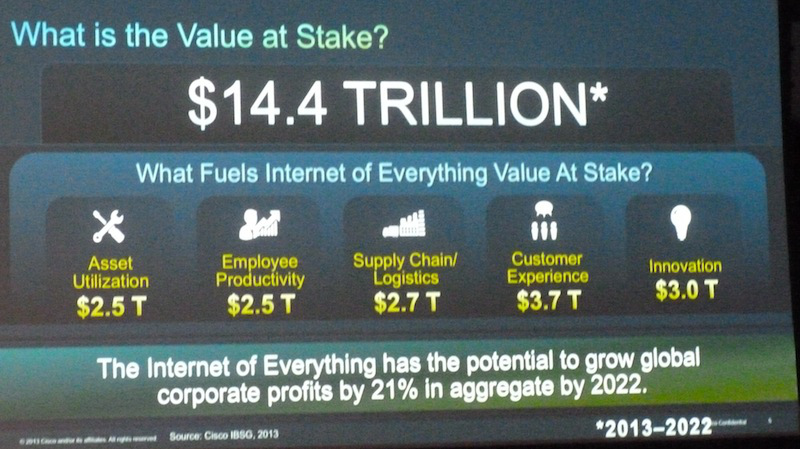
From time to time, Cisco Systems produces projections and forecasts of Internet traffic volumes (presumably to some extent on its equipment). Now there is the Internet of Everything (IoE), a sort of expansion of the “internet of things.”

InternetOfEverything

Internet of Everything: A $4.6 Trillion Public-Sector Opportunity

Peter Diamandis writes,

..Imagine a world in which everything is connected and packed with sensors. 50+ billion connected devices, loaded with a dozen or more sensors, will create a trillion-sensor ecosystem. These devices will create what I call a state of perfect knowledge, where we’ll be able to know what we want, where we want, when we want. Combined with the power of data mining and machine learning, the value that you can create and the capabilities you will have as an individual and as a business will be extraordinary.

Here are some examples posted by Vincent Granville at Data Science Central.

◾Retail: Beyond knowing what you purchased, stores will monitor your eye gaze, knowing what you glanced at… what you picked up and considered, and put back on the shelf. Dynamic pricing will entice you to pick it up again.

◾City Traffic: Cars looking for parking cause 40% of traffic in city centers. Parking sensors will tell your car where to find an open spot.

◾Lighting: Streetlights and house lights will only turn on when you’re nearby.

◾Dynamic pricing: In the future, everything has dynamic pricing where supply and demand drives pricing. Uber already knows when demand is high, or when I’m stuck miles from my house, and can charge more as a result.

◾Transportation: Self-driving cars and IoE will make ALL traffic a thing of the past.

◾Healthcare: You will be the CEO of your own health. Wearables will be tracking your vitals constantly, allowing you and others to make better health decisions.

◾Forests: With connected sensors placed on trees, you can make urban forests healthier and better able to withstand — and even take advantage of — the effects of climate change.

◾Office Furniture: Software and sensors embedded in office furniture are being used to improve office productivity, ergonomics and employee health.

◾Invisibles: Forget wearables, the next big thing is sensor-based technology that you can’t see, whether they are in jewelry, attached to the skin like a bandage, or perhaps even embedded under the skin or inside the body. By 2017, 30% of wearables will be “unobtrusive to the naked eye,” according to market researcher Gartner.

Daniel Kraft, a physician, is a name to watch in this @Daniel_Kraft.

Impact of Artificial Intelligence (AI)

Generally, the under-the-radar spread of AI – in cell phone and tablet features such as Siri, or Google’s Now, which, incidentally, may be pulling ahead in terms of sheer accuracy – meets criteria of technology which can fundamentally change things.

It’s so easy to drive along and ask Siri for directions, or where a good restaurant is. And people focus on their cell phones in public places. There’s even the cartoon about a couple out on a date texting each other across the table.

The impact of technology on society has always been one of my favorite topics. For more than a decade, the Internet and emergent IT companies, have triggered huge, on-the-ground changes, possibly not all good. But the absorption of advertising revenues by Google has been dramatic, and a game-changer for newspapers and magazines (print technology). Online book sales put Borders Books out of business, and impacts book stores everywhere. The music business has changed forever, with singers and bands now almost wholly reliant on tours and real audiences for real revenue, with record and song sales contributing only minor funds to most.

I’d be interested in adding to this list, if readers have thoughts on this.

Mobile e-commerce

Mobile ecommerce is no longer just another means consumers use to buy products online. It’s now the predominant way buyers visit ecommerce sites.

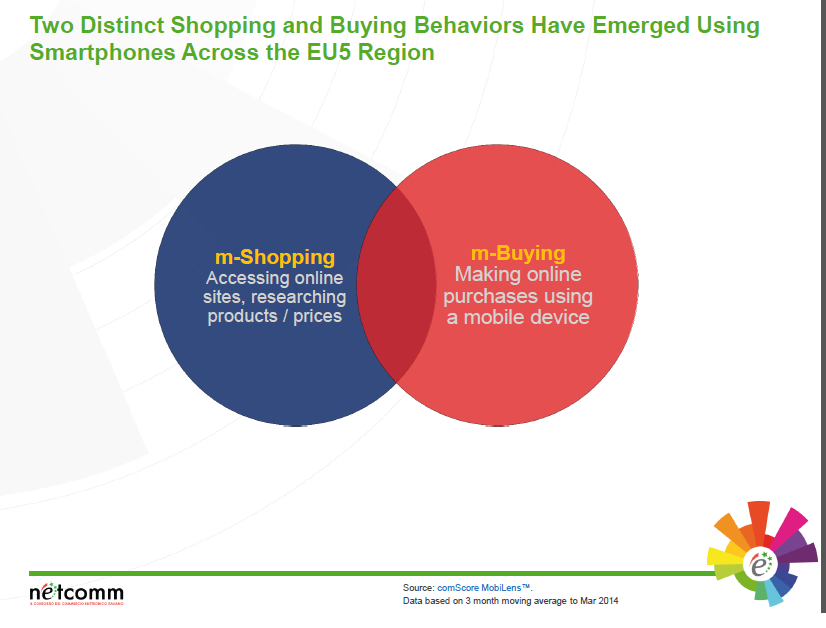
And mobile applications are radically changing the nature of shopping. The Emeritus founder of comScore, for example, highlights the two aspects of mobile ecommerce,

comScoreslide1

Examples of m-Shopping, according to Internet Retailer, include –

Online consumers use their smartphones and tablets for many shopping-related activities. In Q2 2013, 57% of smartphone users while in a retailer’s store visited that retailer’s site or app compared with 43% who consulted another company’s site or app, comScore says. The top reason consumers consulted retailers’ sites or apps was to compare prices. Among those smartphone users who went to the same retailer’s site, 59% wanted to see if there was an online discount available, the report says. Similarly, among those who checked a different retailer’s site, 92% wanted to see if they could get a better deal on price.

Smartphone owners also used their devices while in stores to take a picture of a product (23%), text or call family or friends about a product (17%), and send a picture of a product to family and friends (17%).

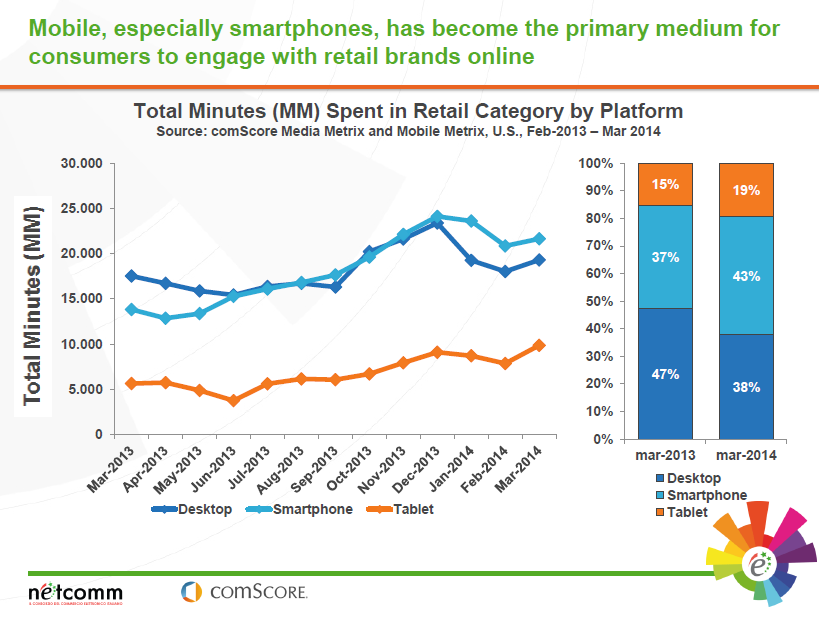
According to Gian Fulgoni, “m-Buying” is the predominant way shoppers now engage with retail brands online in the US.

comScore2

Growth, Adoption, and Use of Mobile E-Commerce explores patterns of mobile ecommerce with extensive data on eBay transactions.

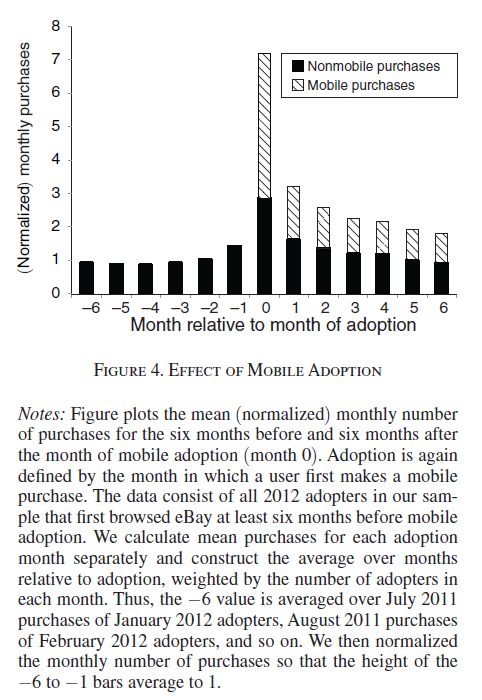
One of the more interesting findings is that,

..adoption of the mobile shopping application is associated with both an immediate and sustained increase in total platform purchasing. The data also do not suggest that mobile application purchases are simply purchases that would have been made otherwise on the regular Internet platform.

The following chart illustrates this effect.

mobileplus

Finally. responsive web design seems to be a key to optimizing for mobile ecommerce.

Responsive web design is a process of making your website content adaptable to the size of the screen you are viewing it on. By doing so, you can optimise your site for mobile and tablet traffic, without the need to manage multiple templates, or separate content.

What’s the Lift of Your Churn Model? – Predictive Analytics and Big Data

Churn analysis is a staple of predictive analytics and big data. The idea is to identify attributes of customers who are likely leave a mobile phone plan or other subscription service, or, more generally, switch who they do business with. Knowing which customers are likely to “churn” can inform customer retention plans. Such customers, for example, may be contacted in targeted call or mailing campaigns with offers of special benefits or discounts.

Lift is a concept in churn analysis. The lift of a target group identified by churn analysis reflects the higher proportion of customers who actually drop the service or give someone else their business, when compared with the population of customers as a whole. If, typically, 2 percent of customers drop the service per month, and, within the group identified as “churners,” 8 percent drop the service, the “lift” is 4.

In interesting research, originally published in the Harvard Business Review, Gregory Piatetsky-Shapiro questions the efficacy of big data applied to churn analysis – based on an estimation of costs and benefits.

We looked at some 30 different churn-modeling efforts in banking and telecom, and surprisingly, although the efforts used different data and different modeling algorithms, they had very similar lift curves. The lists of top 1% likely defectors had a typical lift of around 9-11. Lists of top 10% defectors all had a lift of about 3-4. Very similar lift curves have been reported in other work. (See here and here.) All this suggests a limiting factor to prediction accuracy for consumer behavior such as churn.

Backtracking through earlier research by Piatetsky-Shapiro and his co-researchers, there is this nugget,

For targeted marketing campaigns, a good model lift at T, where T is the target rate in the overall population, is usually sqrt(1/T) +/- 20%.

So, if the likely “churners” are 5 percent of the customer group, a reasonable expectation of the lift that can be obtained from churn analysis is 4.47. This means probably no more than 25 percent of the target group identified by the churn analysis will, in fact, do business elsewhere in the defined period.

This is a very applied type of result, based on review of 30 or more studies.

But the point Piatetsky-Shapiro make is that big data probably can’t push these lift numbers much higher, because of the inherent randomness in the behavior of consumers. And small gains to existing methods simply do not meet a cost/benefit criterion.

Some Israeli researchers may in fact best these numbers with a completely different approach based on social network analysis. Their initial working hypothesis was that social influence on churn is highly dominant in relatively tight social groups. Their approach is clearly telecommunications-based, since they analyzed patterns of calling between customers, identifying networks of callers who had more frequent communications.

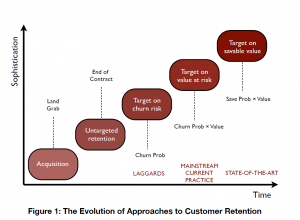
Still, there is a good argument for an evolution from standard churn analysis to predictive analytics that uncovers the value-at-risk in the customer base, or even the value that can be saved by customer retention programs. Customers who have trouble paying their bill, for example, might well be romanced less strongly by customer retention efforts, than premium customers.

evolution

Along these lines, I enjoyed reading the Stochastic Solutions piece on who can be saved and who will be driven away by retention activity, which is responsible for the above graphic.

It has been repeatedly demonstrated that the very act of trying to ‘save’ some customers provokes them to leave. This is not hard to understand, for a key targeting criterion is usually estimated churn probability, and this is highly correlated with customer dissatisfaction. Often, it is mainly lethargy that is preventing a dissatisfied customer from actually leaving. Interventions designed with the express purpose of reducing customer loss can provide an opportunity for such dissatisfaction to crystallise, provoking or bringing forward customer departures that might otherwise have been avoided, or at least delayed. This is especially true when intrusive contact mechanisms, such as outbound calling, are employed. Retention programmes can be made more effective and more profitable by switching the emphasis from customers with a high probability of leaving to those likely to react positively to retention activity.

This is a terrific point. Furthermore,

..many customers are antagonised by what they feel to be intrusive contact mechanisms; indeed, we assert without fear of contradiction that only a small proportion of customers are thrilled, on hearing their phone ring, to discover that the caller is their operator. In some cases, particularly for customers who are already unhappy, such perceived intrusions may act not merely as a catalyst but as a constituent cause of churn.

Bottom-line, this is among the most interesting applications of predictive analytics.

Logistic regression is a favorite in analyzing churn data, although techniques range from neural networks to regression trees.

Analytics 2013 Conference in Florida

Looking for case studies of data analytics or predictive analytics, or for Big Data applications?

You can hardly do better, on a first cut, than peruse the material now available from October’s Analytics 2013 Conference, held at the Hyatt Regency Hotel in Orlando, Florida.

Presented by SAS, dozens of presentations and posters from the Conference can be downloaded as zip files, unbundling as PDF files.

Download the conference presentations and poster presentations (.zip)

I also took an hour to look at the Keynote Presentation of Dr. Sven Crone of Lancaster University in the UK, now available on YouTube.

Crone, who also is affiliated with the Lancaster Centre for Forecasting, gave a Keynote which was, in places, fascinating, and technical and a little obscure elsewhere – worth watching if you time, or can run it in the background while you sort through your desk, for example.

A couple of slides caught my attention.

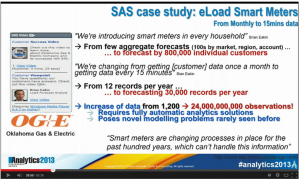
One segment gave concrete meaning to the explosion of data available to forecasters and analysts. For example, for electric power load forecasting, it used be the case that you had, perhaps, monthly total loads for the system or several of its parts, or perhaps daily system loads. Now, Crone notes the data to be modeled has increased by orders of magnitude, for example, with Smart Meters recording customer demand at fifteen minute intervals.

 Analytics13A1                      

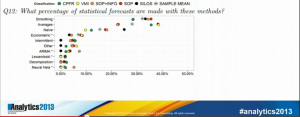
Another part of Crone’s talk which grabbed my attention was his discussion of forecasting techniques employed by 300 large manufacturing concerns, some apparently multinational in scale. The following graph – which is definitely obscure by virtue of its use of acronyms for types of forecasting systems, like SOP for Sales and Operation Planning – highlights that almost no company uses anything except the simplest methods for forecasting, relying largely on judgmental approaches. This aligns with a survey I once did which found almost no utilities used anything except the simplest per capita forecasting approaches. Perhaps things have changed now.

Analytics13A1 Analytics13A2

Crone suggests relying strictly on judgment becomes sort of silly in the face of the explosion of information now available to management.

Another theme Crone spins in an amusing, graphic way is that the workhorses of business forecasting, such as exponential smoothing, are really products from many decades ago. He uses funny pics of old business/office environments, asking whether this characterizes your business today.

The analytic meat of the presentation comes with exposition of bagging and boosting, as well as creative uses for k-means clustering in time series analysis.

At which point he descends into a technical wonderland of complexity.

Incidentally, Analytics 2014 is scheduled for Frankfurt, Germany June 4-5 this coming Spring.

Watch here for my follow-on post on boosting time series.