Category Archives: data reduction

Dimension Reduction With Principal Components

The method of principal components regression has achieved new prominence in machine learning, data reduction, and forecasting over the last decade.

It’s highly relevant in the era of Big Data, because it facilitates analyzing “fat” or wide databases. Fat databases have more predictors than observations. So you might have ten years of monthly data on sales, but 1000 potential predictors, meaning your database would be 120 by 1001 – obeying here the convention of stating row depth first and the number of columns second.

After a brief discussion of these Big Data applications and some elements of principal components, I illustrate dimension reduction with a violent crime database from the UC Irvine Machine Learning Repository.

Dynamic Factor Models

In terms of forecasting, a lot of research over the past decade has focused on “many predictors” and reducing the dimensionality of “fat” databases. Key names are James Stock and Mark Watson (see also) and Bai.

Stock and Watson have a white paper that has been updated several times, which can be found in PDF format at this link

stock watson generalized shrinkage June _2012.pdf

They write in the June 2012 update,

We find that, for most macroeconomic time series, among linear estimators the DFM forecasts make efficient use of the information in the many predictors by using only a small number of estimated factors. These series include measures of real economic activity and some other central macroeconomic series, including some interest rates and monetary variables. For these series, the shrinkage methods with estimated parameters fail to provide mean squared error improvements over the DFM. For a small number of series, the shrinkage forecasts improve upon DFM forecasts, at least at some horizons and by some measures, and for these few series, the DFM might not be an adequate approximation. Finally, none of the methods considered here help much for series that are notoriously difficult to forecast, such as exchange rates, stock prices, or price inflation.

Here DFM refers to dynamic factor models, essentially principal components models which utilize PC’s for lagged data.

Note also that this type of autoregressive or classical time series approach does not work well, in Stock and Watson’s judgment, for “series that are notoriously difficult to forecast, such as exchange rates, stock prices, or price inflation.”

Presumably, these series are closer to being random walks in some configuration.

Intermediate Level Concepts

Essentially, you can take any bundle of data and compute the principal components. If you mean-center and (in most cases) standardize the data, the principal components divide up the variance of this data, based on the size of their associated eigenvalues. The associated eigenvectors can be used to transform the data into an equivalent and same size set of orthogonal vectors. Really, the principal components operate to change the basis of the data, transforming it into an equivalent representation, but one in which all the variables have zero correlation with each other.

The Wikipaedia article on principal components is useful, but there is no getting around the fact that principal components can only really be understood with matrix algebra.

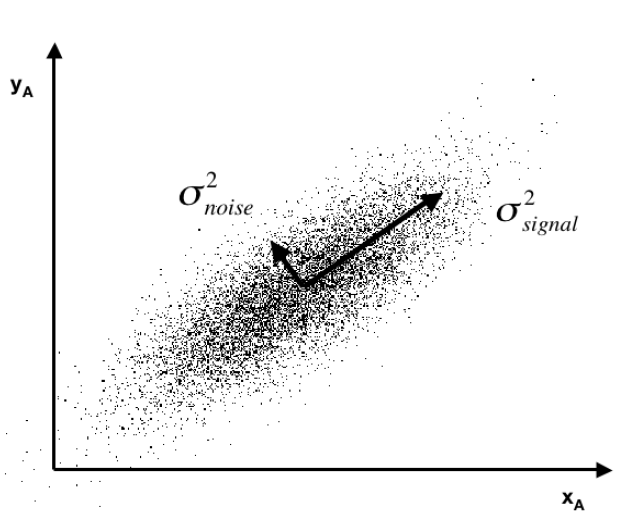
Often you see a diagram, such as the one below, showing a cloud of points distributed around a line passing through the origin of a coordinate system, but at an acute angle to those coordinates.

pcpic

This illustrates dimensionality reduction with principal components. If we express all these points in terms of this rotated set of coordinates, one of these coordinates – the signal – captures most of the variation in the data. Projections of the datapoints onto the second principal component, therefore, account for much less variance.

Principal component regression characteristically specifies only the first few principal components in the regression equation, knowing that, typically, these explain the largest portion of the variance in the data.

An Application to Crime Data

Looking for some non-macroeconomic data to illustrate principal components (PC) regression, I found the Communities and Crime Data Set in the University of California at Irving Machine Learning Repository.

The data do not illustrate “many predictors” in the sense of more predictors than observations.

Here, the crime and other data comprise 128 variables, including a violent crime variable, which are collated for 1994 cities. That is, there are more observations than predictors.

The variables included in the dataset involve the community, such as the percent of the population considered urban, and the median family income, and involving law enforcement, such as per capita number of police officers, and percent of officers assigned to drug units. The per capita violent crimes variable was calculated using population and the sum of crime variables considered violent crimes in the United States: murder, rape, robbery, and assault.

I standardize the data, dropping variables with a lot of missing values. That leaves me 100 variables, including the violent crime metric.

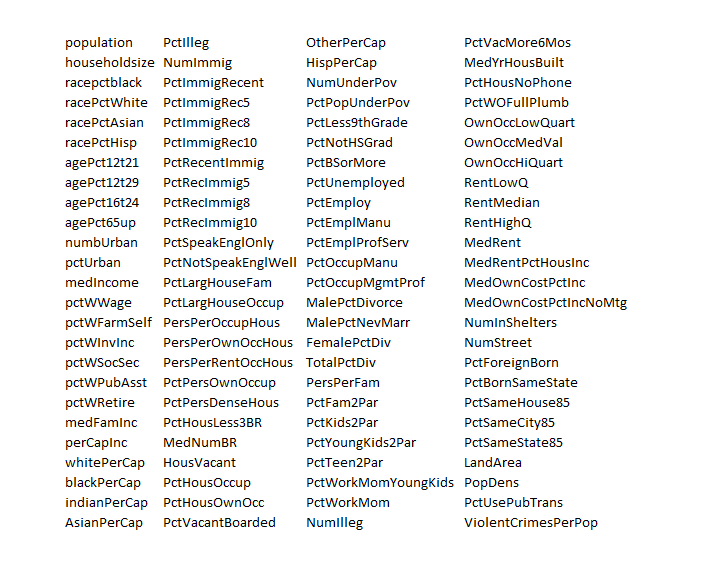
This table gives you a flavor of the variables included – you have to interpret the abbreviations

crime

I developed a comparison of OLS regression with principal components regression, finding that principal component regression can outperform OLS in out-of-sample predictions of violent crimes per capita.

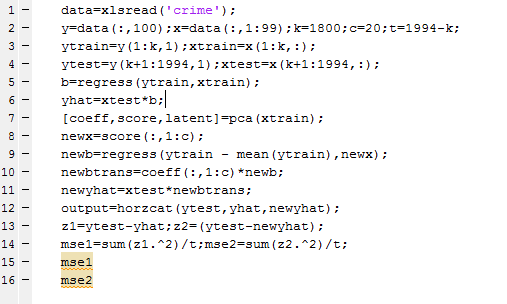
The Matlab program to carry out this analysis is as follows:

Matalbp

So I used a training set of 1800 cities, and developed OLS and PC regressions to predict violent crime per capita in the remaining 194 cities.  I calculate the  principal components (coeff) from a training set (xtrain) comprised of the first 1800 cities. Then, I select the first twenty pc’s  and translate them back to weightings on all 99 variables for application to the test set (xtest). I also calculate OLS regression coefficients on xtrain.

The mean square prediction error (mse1) of the OLS regression was 0.35 and the mean square prediction error (mse2) of the PC regression was 0.34 – really a marginal difference but large enough to make the point.

What’s really interesting is that I had to use the first twenty (20) principal components to achieve this improvement. Thus, this violent crime database has a quite diverse characteristic, compared with many socioeconomic datasets I have seen, where, as noted above, the first few principal components explain most of the variation in the data.

This method – PC regression – is especially good when there are predictors which are closely correlated (“multicollinearity”) as often is the case with market research surveys of consumer attitudes and income and wealth variables.

The bottom line here is that principal compoments can facilitate data reduction or regression regularization. Quite often, this can improve the prediction capabilities of a regression, when compared with an OLS regression using all the variables. The PC regression assigns higher weights to the most important predictors, in effect performing a kind of variable selection – although the coefficients or pc’s may not zero out variables per se.

I am continuing to work on this data with an eye to implementing k-fold cross-validation as a way of estimating the optimal number of principal components which should be used in the PC regressions.

Forecasting Housing Markets – 3

Maybe I jumped to conclusions yesterday. Maybe, in fact, a retrospective analysis of the collapse in US housing prices in the recent 2008-2010 recession has been accomplished – but by major metropolitan area.

The Yarui Li and David Leatham paper Forecasting Housing Prices: Dynamic Factor Model versus LBVAR Model focuses on out-of-sample forecasts for house price indices for 42 metropolitan areas. Forecast models are built with data from 1980:01 to 2007:12. These models – dynamic factor and Large-scale Bayesian Vector Autoregressive (LBVAR) models – are used to generate forecasts of the one- to twelve- months ahead price growth 2008:01 to 2010:12.

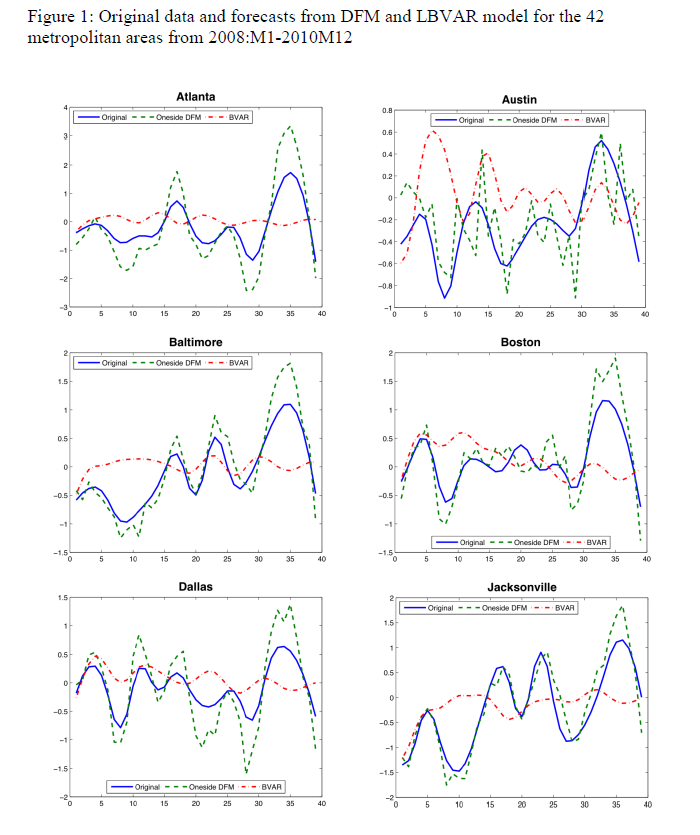
Judging from the graphics and other information, the dynamic factor model (DFM) produces impressive results.

For example, here are out-of-sample forecasts of the monthly growth of housing prices (click to enlarge).

DFMhousing

The house price indices for the 42 metropolitan areas are from the Office of Federal Housing Enterprise Oversight (OFEO). The data for macroeconomic indicators in the dynamic factor and VAR models are from the DRI/McGraw Hill Basic Economics Database provided by IHS Global Insight.

I have seen forecasting models using Internet search activity which purportedly capture turning points in housing price series, but this is something different.

The claim here is that calculating dynamic or generalized principal components of some 141 macroeconomic time series can lead to forecasting models which accurately capture fluctuations in cumulative growth rates of metropolitan house price indices over a forecasting horizon of up to 12 months.

That’s pretty startling, and I for one would like to see further output of such models by city.

But where is the publication of the final paper? The PDF file linked above was presented at the Agricultural & Applied Economics Association’s 2011 Annual Meeting in Pittsburgh, Pennsylvania, July, 2011. A search under both authors does not turn up a final publication in a refereed journal, but does indicate there is great interest in this research. The presentation paper thus is available from quite a number of different sources which obligingly archive it.

Yarui

Currently, the lead author, Yarui Li, Is a Decision Tech Analyst at JPMorgan Chase, according to LinkedIn, having received her PhD from Texas A&M University in 2013. The second author is Professor at Texas A&M, most recently publishing on VAR models applied to business failure in the US.

Dynamic Principal Components

It may be that dynamic principal components are the new ingredient accounting for an uncanny capability to identify turning points in these dynamic factor model forecasts.

The key research is associated with Forni and others, who originally documented dynamic factor models in the Review of Economics and Statistics in 2000. Subsequently, there have been two further publications by Forni on this topic:

Do financial variables help forecasting inflation and real activity in the euro area?

The Generalized Dynamic Factor Model, One Sided Estimation and Forecasting

Forni and associates present this method of dynamic prinicipal componets as an alternative to the Stock and Watson factor models based on many predictors – an alternative with superior forecasting performance.

Run-of-the-mill standard principal components are, according to Li and Leatham, based on contemporaneous covariances only. So they fail to exploit the potentially crucial information contained in the leading-lagging relations between the elements of the panel.

By contrast, the Forni dynamic component approach is used in this housing price study to

obtain estimates of common and idiosyncratic variance-covariance matrices at all leads and lags as inverse Fourier transforms of the corresponding estimated spectral density matrices, and thus overcome(s)[ing] the limitation of static PCA.

There is no question but that any further discussion of this technique must go into high mathematical dudgeon, so I leave that to another time, when I have had an opportunity to make computations of my own.

However, I will say that my explorations with forecasting principal components last year have led to me to wonder whether, in fact, it may be possible to pull out some turning points from factor models based on large panels of macroeconomic data.

Three Pass Regression Filter – New Data Reduction Method

Malcolm Gladwell’s 10,000 hour rule (for cognitive mastery) is sort of an inspiration for me. I picked forecasting as my field for “cognitive mastery,” as dubious as that might be. When I am directly engaged in an assignment, at some point or other, I feel the need for immersion in the data and in estimations of all types. This blog, on the other hand, represents an effort to survey and, to some extent, get control of new “tools” – at least in a first pass. Then, when I have problems at hand, I can try some of these new techniques.

Ok, so these remarks preface what you might call the humility of my approach to new methods currently being innovated. I am not putting myself on a level with the innovators, for example. At the same time, it’s important to retain perspective and not drop a critical stance.

The Working Paper and Article in the Journal of Finance

Probably one of the most widely-cited recent working papers is Kelly and Pruitt’s three pass regression filter (3PRF). The authors, shown above, are with the University of Chicago, Booth School of Business and the Federal Reserve Board of Governors, respectively, and judging from the extensive revisions to the 2011 version, they had a bit of trouble getting this one out of the skunk works.

Recently, however, Kelly and Pruit published an important article in the prestigious Journal of Finance called Market Expectations in the Cross-Section of Present Values. This article applies a version of the three pass regression filter to show that returns and cash flow growth for the aggregate U.S. stock market are highly and robustly predictable.

I learned of a published application of the 3PRF from Francis X. Dieblod’s blog, No Hesitations, where Diebold – one of the most published authorities on forecasting – writes

Recent interesting work, moreover, extends PLS in powerful ways, as with the Kelly-Pruitt three-pass regression filter and its amazing apparent success in predicting aggregate equity returns.

What is the 3PRF?

The working paper from the Booth School of Business cited at a couple of points above describes what might be cast as a generalization of partial least squares (PLS). Certainly, the focus in the 3PRF and PLS is on using latent variables to predict some target.

I’m not sure, though, whether 3PRF is, in fact, more of a heuristic, rather than an algorithm.

What I mean is that the three pass regression filter involves a procedure, described below.

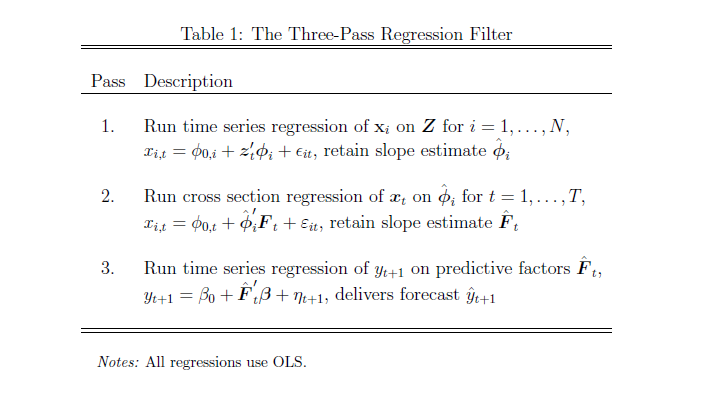
(click to enlarge).

3PRFprocedure

Here’s the basic idea –

Suppose you have a large number of potential regressors xi ε X, i=1,..,N. In fact, it may be impossible to calculate an OLS regression, since N > T the number of observations or time periods.

Furthermore, you have proxies zj ε  Z, I = 1,..,L – where L is significantly less than the number of observations T. These proxies could be the first several principal components of the data matrix, or underlying drivers which theory proposes for the situation. The authors even suggest an automatic procedure for generating proxies in the paper.

And, finally, there is the target variable yt which is a column vector with T observations.

Latent factors in a matrix F drive both the proxies in Z and the predictors in X. Based on macroeconomic research into dynamic factors, there might be only a few of these latent factors – just as typically only a few principal components account for the bulk of variation in a data matrix.

Now here is a key point – as Kelly and Pruitt present the 3PRF, it is a leading indicator approach when applied to forecasting macroeconomic variables such as GDP, inflation, or the like. Thus, the time index for yt ranges from 2,3,…T+1, while the time indices of all X and Z variables and the factors range from 1,2,..T. This means really that all the x and z variables are potentially leading indicators, since they map conditions from an earlier time onto values of a target variable at a subsequent time.

What Table 1 above tells us to do is –

  1. Run an ordinary least square (OLS) regression of the xi      in X onto the zj in X, where T ranges from 1 to T and there are      N variables in X and L << T variables in Z. So, in the example      discussed below, we concoct a spreadsheet example with 3 variables in Z,      or three proxies, and 10 predictor variables xi in X (I could      have used 50, but I wanted to see whether the method worked with lower      dimensionality). The example assumes 40 periods, so t = 1,…,40. There will      be 40 different sets of coefficients of the zj as a result of      estimating these regressions with 40 matched constant terms.
  2. OK, then we take this stack of estimates of      coefficients of the zj and their associated constants and map      them onto the cross sectional slices of X for t = 1,..,T. This means that,      at each period t, the values of the cross-section. xi,t, are      taken as the dependent variable, and the independent variables are the 40      sets of coefficients (plus constant) estimated in the previous step for      period t become the predictors.
  3. Finally, we extract the estimate of the factor loadings      which results, and use these in a regression with target variable as the      dependent variable.

This is tricky, and I have questions about the symbolism in Kelly and Pruitt’s papers, but the procedure they describe does work. There is some Matlab code here alongside the reference to this paper in Professor Kelly’s research.

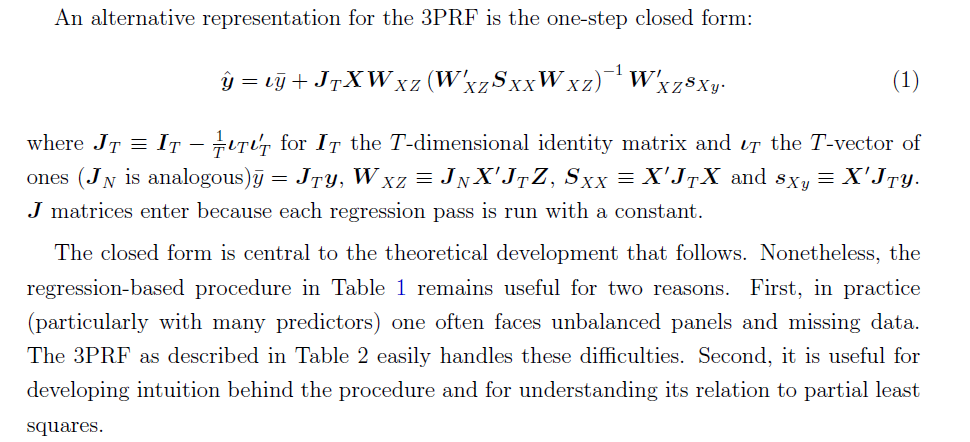
At the same time, all this can be short-circuited (if you have adequate data without a lot of missing values, apparently) by a single humungous formula –

3PRFformula

Here, the source is the 2012 paper.

Spreadsheet Implementation

Spreadsheets help me understand the structure of the underlying data and the order of calculation, even if, for the most part, I work with toy examples.

So recently, I’ve been working through the 3PRF with a small spreadsheet.

Generating the factors:I generated the factors as two columns of random variables (=rand()) in Excel. I gave the factors different magnitudes by multiplying by different constants.

Generating the proxies Z and predictors X. Kelly and Pruitt call for the predictors to be variance standardized, so I generated 40 observations on ten sets of xi by selecting ten different coefficients to multiply into the two factors, and in each case I added a normal error term with mean zero and standard deviation 1. In Excel, this is the formula =norminv(rand(),0,1).

Basically, I did the same drill for the three zj — I created 40 observations for z1, z2, and z3 by multiplying three different sets of coefficients into the two factors and added a normal error term with zero mean and variance equal to 1.

Then, finally, I created yt by multiplying randomly selected coefficients times the factors.

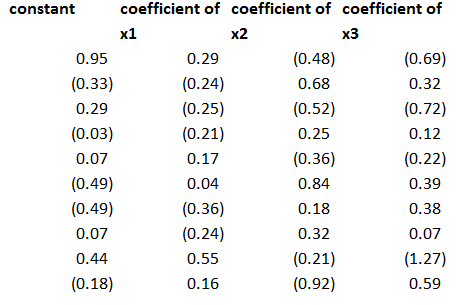
After generating the data, the first pass regression is easy. You just develop a regression with each predictor xi as the dependent variable and the three proxies as the independent variables, case-by-case, across the time series for each. This gives you a bunch of regression coefficients which, in turn, become the explanatory variables in the cross-sectional regressions of the second step.

The regression coefficients I calculated for the three proxies, including a constant term, were as follows – where the 1st row indicates the regression for x1 and so forth.

coeff

This second step is a little tricky, but you just take all the values of the predictor variables for a particular period and designate these as the dependent variables, with the constant and coefficients estimated in the previous step as the independent variables. Note, the number of predictors pairs up exactly with the number of rows in the above coefficient matrix.

This then gives you the factor loadings for the third step, where you can actually predict yt (really yt+1 in the 3PRF setup). The only wrinkle is you don’t use the constant terms estimated in the second step, on the grounds that these reflect “idiosyncratic” effects, according to the 2011 revision of the paper.

Note the authors describe this as a time series approach, but do not indicate how to get around some of the classic pitfalls of regression in a time series context. Obviously, first differencing might be necessary for nonstationary time series like GDP, and other data massaging might be in order.

Bottom line – this worked well in my first implementation.

To forecast, I just used the last regression for yt+1 and then added ten more cases, calculating new values for the target variable with the new values of the factors. I used the new values of the predictors to update the second step estimate of factor loadings, and applied the last third pass regression to these values.

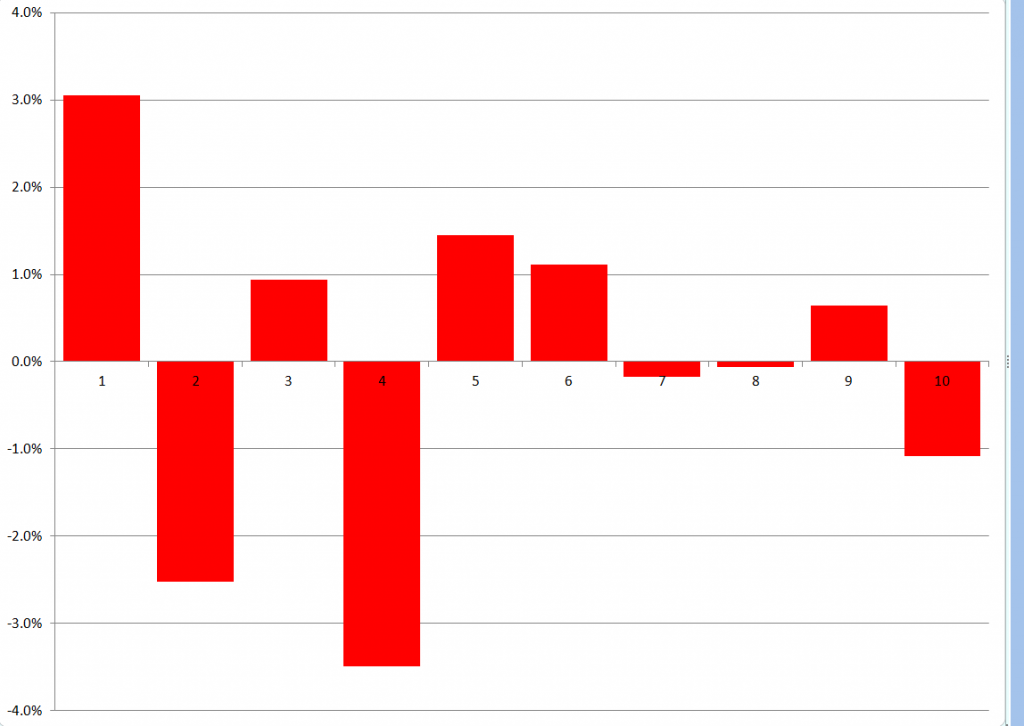
Here are the forecast errors for these ten out-of-sample cases.

3PRFforecasterror

Not bad for a first implementation.

 Why Is Three Pass Regression Important?

3PRF is a fairly “clean” solution to an important problem, relating to the issue of “many predictors” in macroeconomics and other business research.

Noting that if the predictors number near or more than the number of observations, the standard ordinary least squares (OLS) forecaster is known to be poorly behaved or nonexistent, the authors write,

How, then, does one effectively use vast predictive information? A solution well known in the economics literature views the data as generated from a model in which latent factors drive the systematic variation of both the forecast target, y, and the matrix of predictors, X. In this setting, the best prediction of y is infeasible since the factors are unobserved. As a result, a factor estimation step is required. The literature’s benchmark method extracts factors that are significant drivers of variation in X and then uses these to forecast y. Our procedure springs from the idea that the factors that are relevant to y may be a strict subset of all the factors driving X. Our method, called the three-pass regression filter (3PRF), selectively identifies only the subset of factors that influence the forecast target while discarding factors that are irrelevant for the target but that may be pervasive among predictors. The 3PRF has the advantage of being expressed in closed form and virtually instantaneous to compute.

So, there are several advantages, such as (1) the solution can be expressed in closed form (in fact as one complicated but easily computable matrix expression), and (2) there is no need to employ maximum likelihood estimation.

Furthermore, 3PRF may outperform other approaches, such as principal components regression or partial least squares.

The paper illustrates the forecasting performance of 3PRF with real-world examples (as well as simulations). The first relates to forecasts of macroeconomic variables using data such as from the Mark Watson database mentioned previously in this blog. The second application relates to predicting asset prices, based on a factor model that ties individual assets’ price-dividend ratios to aggregate stock market fluctuations in order to uncover investors’ discount rates and dividend growth expectations.