Category Archives: downloadable texts on statistics and forecasting

Partial Least Squares and Principal Components

I’ve run across outstanding summaries of “partial least squares” (PLS) research recently – for example Rosipal and Kramer’s Overview and Recent Advances in Partial Least Squares and the 2010 Handbook of Partial Least Squares.

Partial least squares (PLS) evolved somewhat independently from related statistical techniques, owing to what you might call family connections. The technique was first developed by Swedish statistician Herman Wold and his son, Svante Wold, who applied the method in particular to chemometrics. Rosipal and Kramer suggest that the success of PLS in chemometrics resulted in a lot of applications in other scientific areas including bioinformatics, food research, medicine, [and] pharmacology..

Someday, I want to look into “path modeling” with PLS, but for now, let’s focus on the comparison between PLS regression and principal component (PC) regression. This post develops a comparison with Matlab code and macroeconomics data from Mark Watson’s website at Princeton.

The Basic Idea Behind PC and PLS Regression

Principal component and partial least squares regression share a couple of features.

Both, for example, offer an approach or solution to the problem of “many predictors” and multicollinearity. Also, with both methods, computation is not transparent, in contrast to ordinary least squares (OLS). Both PC and PLS regression are based on iterative or looping algorithms to extract either the principal components or underlying PLS factors and factor loadings.

PC Regression

The first step in PC regression is to calculate the principal components of the data matrix X. This is a set of orthogonal (which is to say completely uncorrelated) vectors which are weighted sums of the predictor variables in X.

This is an iterative process involving transformation of the variance-covariance or correlation matrix to extract the eigenvalues and eigenvectors.

Then, the data matrix X is multiplied by the eigenvectors to obtain the new basis for the data – an orthogonal basis. Typically, the first few (the largest) eigenvalues – which explain the largest proportion of variance in X – and their associated eigenvectors are used to produce one or more principal components which are regressed onto Y. This involves a dimensionality reduction, as well as elimination of potential problems of multicollinearity.

PLS Regression

The basic idea behind PLS regression, on the other hand, is to identify latent factors which explain the variation in both Y and X, then use these factors, which typically are substantially fewer in number than k, to predict Y values.

Clearly, just as in PC regression, the acid test of the model is how it performs on out-of-sample data.

The reason why PLS regression often outperforms PC regression, thus, is that factors which explain the most variation in the data matrix may not, at the same time, explain the most variation in Y. It’s as simple as that.

Matlab example

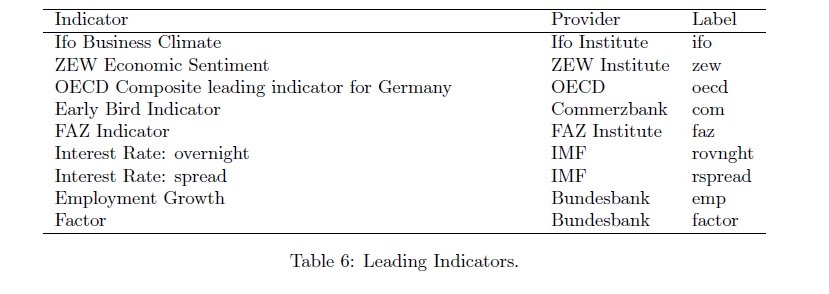
I grabbed some data from Mark Watson’s website at Princeton — from the links to a recent paper called Generalized Shrinkage Methods for Forecasting Using Many Predictors (with James H. Stock), Journal of Business and Economic Statistics, 30:4 (2012), 481-493.Download Paper (.pdf). Download Supplement (.pdf), Download Data and Replication Files (.zip). The data include the following variables, all expressed as year-over-year (yoy) growth rates: The first variable – real GDP – is taken as the forecasting target. The time periods of all other variables are lagged one period (1 quarter) behind the quarterly values of this target variable.

macrolist

Matlab makes calculation of both principal component and partial least squares regressions easy.

The command to extract principal components is

[coeff, score, latent]=princomp(X)

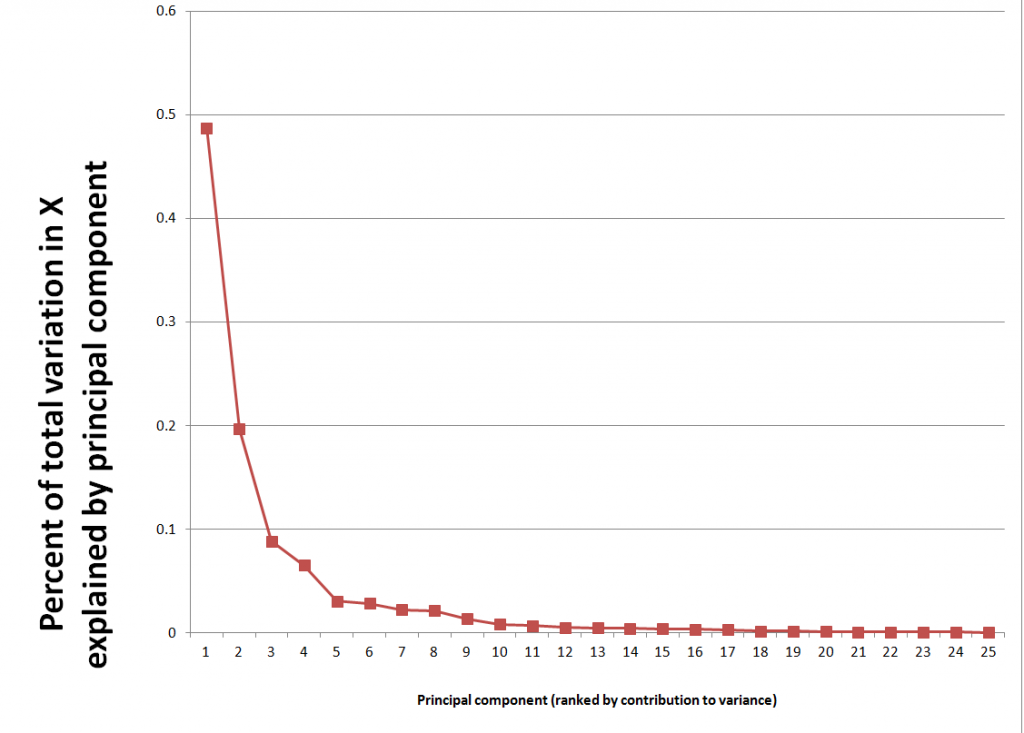
Here X the data matrix, and the entities in the square brackets are vectors or matrices produced by the algorithm. It’s possible to compute a principal components regression with the contents of the matrix score. Generally, the first several principal components are selected for the regression, based on the importance of a component or its associated eigenvalue in latent. The following scree chart illustrates the contribution of the first few principal components to explaining the variance in X.

Screechart

The relevant command for regression in Matlab is

b=regress(Y,score(:,1:6))

where b is the column vector of estimated coefficients and the first six principal components are used in place of the X predictor variables.

The Matlab command for a partial least square regresssion is

[XL,YL,XS,YS,beta] = plsregress(X,Y,ncomp)

where ncomp is the number of latent variables of components to be utilized in the regression. There are issues of interpreting the matrices and vectors in the square brackets, but I used this code –

data=xlsread(‘stock.xls’); X=data(1:47,2:79); y = data(2:48,1);

[XL,yl,XS,YS,beta] = plsregress(X,y,10); yfit = [ones(size(X,1),1) X]*beta;

lookPLS=[y yfit]; ZZ=data(48:50,2:79);newy=data(49:51,1);

new=[ones(3,1) ZZ]*beta; out=[newy new];

The bottom line is to test the estimates of the response coefficients on out-of-sample data.

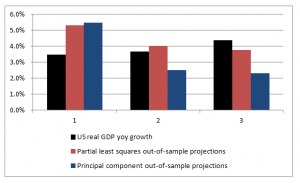
The following chart shows that PLS outperforms PC, although the predictions of both are not spectacularly accurate.

plspccomp

Commentary

There are nuances to what I have done which help explain the dominance of PLS in this situation, as well as the weakly predictive capabilities of both approaches.

First, the target variable is quarterly year-over-year growth of real US GDP. The predictor set X contains 78 other macroeconomic variables, all expressed in terms of yoy (year-over-year) percent changes.

Again, note that the time period of all the variables or observations in X are lagged one quarter from the values in Y, or the values or yoy quarterly percent growth of real US GDP.

This means that we are looking for a real, live leading indicator. Furthermore, there are plausibly common factors in the Y series shared with at least some of the X variables. For example, the percent changes of a block of variables contained in real GDP are included in X, and by inspection move very similarly with the target variable.

Other Example Applications

There are at least a couple of interesting applied papers in the Handbook of Partial Least Squares – a downloadable book in the Springer Handbooks of Computational Statistics. See –

Chapter 20 A PLS Model to Study Brand Preference: An Application to the Mobile Phone Market

Chapter 22 Modeling the Impact of Corporate Reputation on Customer Satisfaction and Loyalty Using Partial Least Squares

Another macroeconomics application from the New York Fed –

“Revisiting Useful Approaches to Data-Rich Macroeconomic Forecasting”

http://www.newyorkfed.org/research/staff_reports/sr327.pdf

Finally, the software company XLStat has a nice, short video on partial least squares regression applied to a marketing example.

Boosting Time Series

If you learned your statistical technique more than ten years ago, consider it necessary to learn a whole bunch of new methods. Boosting is certainly one of these.

Let me pick a leading edge of this literature here – boosting time series predictions.

Results

Let’s go directly to the performance improvements.

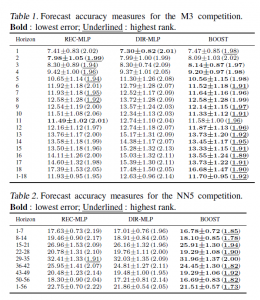
In Boosting multi-step autoregressive forecasts, (Souhaib Ben Taieb and Rob J Hyndman, International Conference on Machine Learning (ICML) 2014) we find the following Table applying boosted time series forecasts to two forecasting competition datasets –

HyndmanTable1

The three columns refer to three methods for generating forecasts over horizons of 1-18 periods (M3 Competition and 1-56 period (Neural Network Competition). The column labeled BOOST is, as its name suggests, the error metric for a boosted time series prediction. Either by the lowest symmetric mean absolute percentage error or a rank criterion, BOOST usually outperforms forecasts produced recursively from an autoregressive (AR) model, or forecasts from an AR model directly mapped onto the different forecast horizons.

There were a lot of empirical time series involved in these two datasets –

The M3 competition dataset consists of 3003 monthly, quarterly, and annual time series. The time series of the M3 competition have a variety of features. Some have a seasonal component, some possess a trend, and some are just fluctuating around some level. The length of the time series ranges between 14 and 126. We have considered time series with a range of lengths between T = 117 and T = 126. So, the number of considered time series turns out to be M = 339. For these time series, the competition required forecasts for the next H = 18 months, using the given historical data. The NN5 competition dataset comprises M = 111 time series representing roughly two years of daily cash withdrawals (T = 735 observations) at ATM machines at one of the various cities in the UK. For each time series, the  competition required to forecast the values of the next H = 56 days (8 weeks), using the given historical data.

This research, notice of which can be downloaded from Rob Hyndman’s site, builds on the methodology of Ben Taieb and Hyndman’s recent paper in the International Journal of Forecasting A gradient boosting approach to the Kaggle load forecasting competition. Ben Taieb and Hyndman’s submission came in 5th out of 105 participating teams in this Kaggle electric load forecasting competition, and used boosting algorithms.

Let me mention a third application of boosting to time series, this one from Germany. So we have Robinzonov, Tutz, and Hothorn’s Boosting Techniques for Nonlinear Time Series Models (Technical Report Number 075, 2010 Department of Statistics University of Munich) which focuses on several synthetic time series and predictions of German industrial production.

Again, boosted time series models comes out well in comparisons.

GErmanIndustrialProd

GLMBoost or GAMBoost are quite competitive at these three forecast horizons for German industrial production.

What is Boosting?

My presentation here is a little “black box” in exposition, because boosting is, indeed, mathematically intricate, although it can be explained fairly easily at a very general level.

Weak predictors and weak learners play an important role in bagging and boosting –techniques which are only now making their way into forecasting and business analytics, although the machine learning community has been discussing them for more than two decades.

Machine learning must be a fascinating field. For example, analysts can formulate really general problems –

In an early paper, Kearns and Valiant proposed the notion of a weak learning algorithm which need only achieve some error rate bounded away from 1/2 and posed the question of whether weak and strong learning are equivalent for efficient (polynomial time) learning algorithms.

So we get the “definition” of boosting in general terms:

Boosting algorithms are procedures that “boost” low-accuracy weak learning algorithms to achieve arbitrarily high accuracy.

And a weak learner is a learning method that achieves only slightly better than chance correct classification of binary outcomes or labeling.

This sounds like the best thing since sliced bread.

But there’s more.

For example, boosting can be understood as a functional gradient descent algorithm.

Now I need to mention that some of the most spectacular achievements in boosting come in classification. A key text is the recent book Boosting: Foundations and Algorithms (Adaptive Computation and Machine Learning series) by Robert E. Schapire and Yoav Freund. This is a very readable book focusing on AdaBoost, one of the early methods and its extensions. The book can be read on Kindle and is starts out –

boostingquote

So worth the twenty bucks or so for the download.

The papers discussed above vis a vis boosting time series apply p-splines in an effort to estimate nonlinear effects in time series. This is really unfamiliar to most of us in the conventional econometrics and forecasting communities, so we have to start conceptualizing stuff like “knots” and component-wise fitting algortihms.

Fortunately, there is a canned package for doing a lot of the grunt work in R, called mboost.

Bottom line, I really don’t think time series analysis will ever be the same.

The On-Coming Tsunami of Data Analytics

More than 25,000 visited businessforecastblog, March 2012-December 2013, some spending hours on the site. Interest ran nearly 200 visitors a day in December, before my ability to post was blocked by a software glitch, and we did this re-boot.

Now I have hundreds of posts offline, pertaining to several themes, discussed below. How to put this material back up – as reposts, re-organized posts, or as longer topic summaries?

There’s a silver lining. This forces me to think through forecasting, predictive and data analytics.

One thing this blog does is compile information on which forecasting and data analytics techniques work, and, to some extent, how they work, how key results are calculated. I’m big on computation and performance metrics, and I want to utilize the SkyDrive more extensively to provide full access to spreadsheets with worked examples.

Often my perspective is that of a “line worker” developing sales forecasts. But there is another important focus – business process improvement. The strength of a forecast is measured, ultimately, by its accuracy. Efforts to improve business processes, on the other hand, are clocked by whether improvement occurs – whether costs of reaching customers are lower, participation rates higher, customer retention better or in stabilization mode (lower churn), and whether the executive suite and managers gain understanding of who the customers are. And there is a third focus – that of the underlying economics, particularly the dynamics of the institutions involved, such as the US Federal Reserve.

Right off, however, let me say there is a direct solution to forecasting sales next quarter or in the coming budget cycle. This is automatic forecasting software, with Forecast Pro being one of the leading products. Here’s a YouTube video with the basics about that product.

You can download demo versions and participate in Webinars, and attend the periodic conferences organized by Business Forecast Systems showcasing user applications in a wide variety of companies.

So that’s a good solution for starters, and there are similar products, such as the SAS/ETS time series software, and Autobox.

So what more would you want?

Well, there’s need for background information, and there’s a lot of terminology. It’s useful to know about exponential smoothing and random walks, as well as autoregressive and moving averages.  Really, some reaches of this subject are arcane, but nothing is worse than a forecast setup which gains the confidence of stakeholders, and then falls flat on its face. So, yes, eventually, you need to know about “pathologies” of the classic linear regression (CLR) model – heteroscedasticity, autocorrelation, multicollinearity, and specification error!

And it’s good to gain this familiarity in small doses, in connection with real-world applications or even forecasting personalities or celebrities. After a college course or two, it’s easy to lose track of concepts. So you might look at this blog as a type of refresher sometimes.

Anticipating Turning Points in Time Series

But the real problem comes with anticipating turning points in business and economic time series. Except when modeling seasonal variation, exponential smoothing usually shoots over or under a turning point in any series it is modeling.

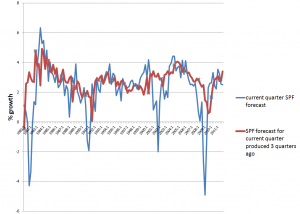
If this were easy to correct, macroeconomic forecasts would be much better. The following chart highlights the poor performance, however, of experts contributing to the quarterly Survey of Professional Forecasters, maintained by the Philadelphia Fed.

SPFcomp2

So, the red line is the SPF consensus forecast for GDP growth on a three quarter horizon, and the blue line is the forecast or nowcast for the current quarter (there is a delay in release of current numbers). Notice the huge dips in the current quarter estimate, associated with four recessions 1981, 1992, 2001-2, and 2008-9. A mere three months prior to these catastrophic drops in growth, leading forecasters at big banks, consulting companies, and universities totally missed the boat.

This is important in a practical sense, because recessions turn the world of many businesses upside down. All bets are off. The forecasting team is reassigned or let go as an economy measure, and so forth.

Some forward-looking information would help business intelligence focus on reallocating resources to sustain revenue as much as possible, using analytics to design cuts exerting the smallest impact on future ability to maintain and increase market share.

Hedgehogs and Foxes

Nate Silver has a great table in his best-selling The
Signal and the Noise
on the qualities and forecasting performance of hedgehogs and foxes. The idea comes from a Greek poet, “The fox knows many little things, but the hedgehog knows one big thing.”

Following Tetlock, Silver finds foxes are multidisplinary, adaptable, self-critical, cautious, and empirical, tolerant of complexity. By contrast, the Hedgehog is specialized, sticks to the same approaches, stubbornly adheres to his model in spite of counter-evidence, is order-seeking, confident, and ideological. The evidence suggests foxes generally outperform hedgehogs, just as ensemble methods typically outperform a single technique in forecasting.

Message – be a fox.

So maybe this can explain some of the breadth of this blog. If we have trouble predicting GDP growth, what about forecasts in other areas – such as weather, climate change, or that old chestnut, sun spots? And maybe it is useful to take a look at how to forecast all the inputs and associated series – such as exchange rates, growth by global region, the housing market, interest rates, as well as profits.

And while we are looking around, how about brain waves? Can brain waves be forecast? Oh yes, it turns out there is a fascinating and currently applied new approach called neuromarketing, which uses headbands and electrodes, and even MRI machines, to detect deep responses of consumers to new products and advertising.

New Methods

I know I have not touched on cluster analysis and classification, areas making big contributions to improvement of business process. But maybe if we consider the range of “new” techniques for predictive analytics, we can see time series forecasting and analysis of customer behavior coming under one roof.

There is, for example, this many predictor thread emerging in forecasting in the late 1990’s and especially in the last decade with factor models for macroeconomic forecasting. Reading this literature, I’ve become aware of methods for mapping N explanatory variables onto a target variable, when there are M<N observations. These are sometimes called methods of data shrinkage, and include principal components regression, ridge regression, and the lasso. There are several others, and a good reference is The Elements of Statistical Learning, Data Mining, Learning and Prediction, 2nd edition, by Trevor Hastie, Robert Tibshirani, and Jerome Friedman. This excellent text is downloadable, accessible via the Tools, Apps, Texts, Free Stuff menu option located just to the left of the search utility on the heading for this blog.

There also is bagging, which is the topic of the previous post, as well as boosting, and a range of decision tree and regression tree modeling tactics, including random forests.

I’m actively exploring a number of these approaches, ginning up little examples to see how they work and how the computation goes. So far, it’s impressive. This stuff can really improve over the old approaches, which someone pointed out, have been around since the 1950’s at least.

It’s here I think that we can sight the on-coming wave, just out there on the horizon – perhaps hundreds of feet high. It’s going to swamp the old approaches, changing market research forever and opening new vistas, I think, for forecasting, as traditionally understood.

I hope to be able to ride that wave, and now I put it that way, I get a sense of urgency in keeping practicing my web surfing.

Hope you come back and participate in the comments section, or email me at [email protected]