Greetings again. Took a deep dive into portfolio analysis for a colleague.
Portfolio analysis, of course, has been deeply influenced by Modern Portfolio Theory (MPT) and the work of Harry Markowitz and Robert Merton, to name a couple of the giants in this field.
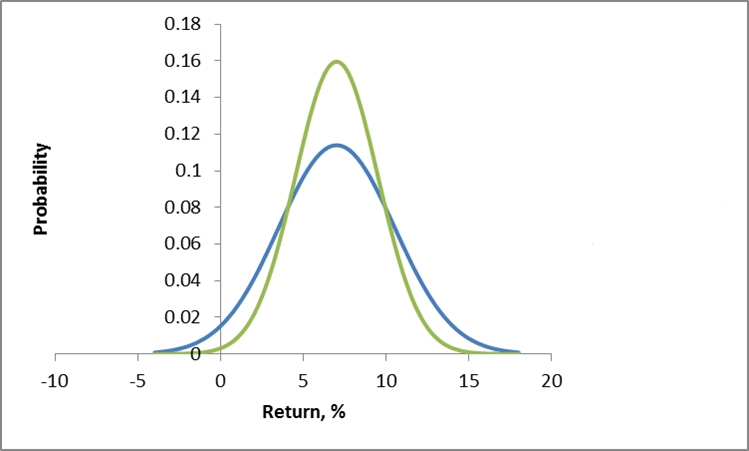
Conventionally, investment risk is associated with the standard deviation of returns. So one might visualize the dispersion of actual returns for investments around expected returns, as in the following chart.
Here, two investments have the same expected rate of return, but different standard deviations. Viewed in isolation, the green curve indicates the safer investment.
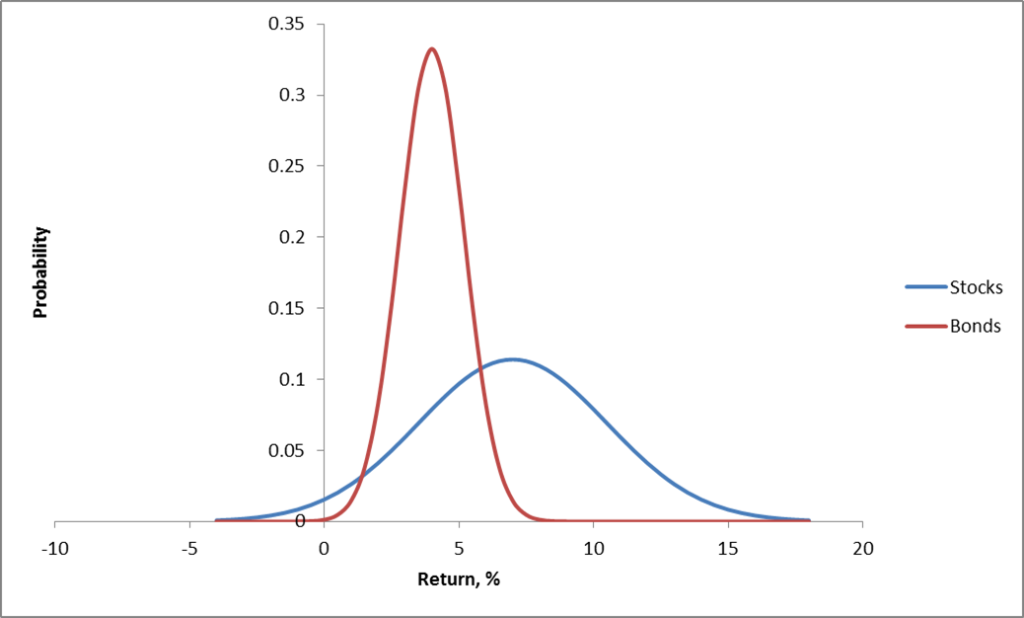
More directly relevant for portfolios are curves depicting the distribution of typical returns for stocks and bonds, which can be portrayed as follows.
Now the classic portfolio is comprised of 60 percent stocks and 40 percent bonds.
Where would its expected return be? Well, the expected value of a sum of random variables is the sum of their expected values. There is an algebra of expectations to express this around the operator E(.). So we have E(.6S+.4B)=.6E(S)+.4E(B), since a constant multiplied into a random variable just shifts the expectation by that factor. Here, of course, S stands for “stocks” and B “bonds.”
Thus, the expected return for the classic 60/40 portfolio is less than the returns that could be expected from stocks alone.
But the benefit here is that the risks have been reduced, too.
Thus, the variance of the 60/40 portfolio usually is less than the variance of a portfolio composed strictly of stocks.
One of the ways this is true is when the correlation or covariation of stocks and bonds is negative, as it has been in many periods over the last century. Thus, high interest rates mean slow to negative economic growth, but can be associated with high returns on bonds.
Analytically, this is because the variance of the sum of two random variables is the sum of their variances, plus their covariance multiplied by a factor of 2.
Thus, algebra and probability facts underpin arguments for investment diversification. Pick investments which are not perfectly correlated in their reaction to events, and your chances of avoiding poor returns and disastrous losses can be improved.
Implementing MPF
When there are more than two assets, you need computational help to implement MPT portfolio allocations.
For a general discussion of developing optimal portfolios and the efficient frontier see http://faculty.washington.edu/ezivot/econ424/portfoliotheorymatrixslides.pdf
There are associated R programs and a guide to using Excel’s Solver with this University of Washington course.
Also see Package ‘Portfolio’.
These programs help you identify the minimum variance portfolio, based on a group of assets and histories of their returns. Also, it is possible to find the minimum variance combination from a designated group of assets which meet a target rate of return, if, in fact, that is feasible with the assets in question. You also can trace out the efficient frontier – combinations of assets mapped in a space of returns and variances. These assets in each case have expected returns on the curve and are minimum variance compared with all other combinations that generate that rate of return (from your designated group of assets).
One of the governing ideas is that this efficient frontier is something an individual investor might travel along as they age – going from higher risk portfolios when they are younger, to more secure, lower risk portfolios, as they age.
Issues
As someone who believes you don’t really know something until you can compute it, it interests me that there are computational issues with implementing MPT.
I find, for example, that the allocations are quite sensitive to small changes in expected returns, variances, and the underlying covariances.
One of the more intelligent, recent discussions with suggested “fixes” can be found in An Improved Estimation to Make Markowitz’s Portfolio Optimization Theory Users Friendly and Estimation Accurate with Application on the US Stock Market Investment.
The more fundamental issue, however, is that MPT appears to assume that stock returns are normally distributed, when everyone after Mandelbrot should know this is hardly the case.
Again, there is a vast literature, but a useful approach seems to be outlined in Modelling in the spirit of Markowitz portfolio theory in a non-Gaussian world. These authors use MPT algorithms as the start of a search for portfolios which minimize value-at-risk, instead of variances.
Finally, if you want to cool off and still stay on point, check out the 2014 Annual Report of Berkshire Hathaway, and, especially, the Chairman’s Letter. That’s Warren Buffett who has truly mastered an old American form which I believe used to be called “cracker barrel philosophy.” Good stuff.
