Category Archives: Uncategorized

Outlook for 2021 – Early Perspective

Here is an update on the PowerPoint Deck from the St. Louis Federal Reserve databanks, focusing on the condition of the US economy.

In general, things have recovered substantially from the rapid and deep dip in business activity in 2020, due to the lockdown and other aspects of the pandemic. Levels of production and consumption have not reached previous peaks in 2019 and 2020, however.

Optimism is in the air as the vaccines roll out. At the same time, there is talk many jobs have been lost for the longer term – especially in food, lodging and travel. Patterns of work may permanently change. More remote work lowering demand for offices. More retail moving online, impacting commercial real estate via the decline of shopping centers and retail outlets generally. Logistics and warehousing are growth areas of the economy.

Growing inequality is a troublesome feature. Many workers in food services, hotels, travel and retail have experienced joblessness, making paying the mortgage or even rent challenging. Food banks look to be doing a booming business. The closure of normal public school operation in many areas has impacted families depending, in some measure, on the school lunch programs.

On the other hand, the stock market sees new highs. Of course, only a small percentage of people own any significant number of stocks, so the efforts of the US Federal Reserve to bolster markets have very different impacts on groups of people in the US.

About 70 percent of US gross domestic product (GDP) is accounted for by consumer spending. It’s possible that the overhand from the pandemic could wing consumer spending later in 2021, if there is not substantial rebound in employment or significant government stimulus.

Where We Are Fall 2020

The St. Louis Federal Reserve Bank supports an important data center called FRED.

The following slide deck is developed from macroeconomic and financial data updated through early July 2020. These 14 or so slides represent an important and historic resource. In almost every case, recent numbers are record-breaking – in the wrong way, unfortunately.

To summarize, more than 12 million jobs have been lost since the beginning of 2020, even with some rebound. Trillions of dollars of GDP have been foregone, and the Federal Budget Deficit has increased by several trillion dollars. The US Federal Reserve Bank has pumped in more than double the amount of liquidity in a few months, as it did in 2008-2009.

These slides set a Baseline. Where do we go from here?

Predictions of High and Low Prices as Technical Indicators

Major retail stock trading platforms, like Charles Schwab or TDAmeritrade’s ThinkorSwim, provide convenient ways to throw up results of various technical stock price indicators to inform decisions about entering or exiting a trade. These technical indicators include, for example, the Relative Strength Index (RSI), fast and slow Stochastic Oscillators, various Moving Average Convergence Divergence (MACD) metrics, and On Board Volume (OBV). Investopedia provides good background on these.

So I want to initiate my sometime return to blogging by presenting research on a NEW TECHNICAL STOCK MARKET INDICATOR.

Here is a link to a presentation that highlights the Predicted Range as Technical Stock Indicator which can lead – with the SPDR S&P 500 exchange traded fund SPY – to results which beat Buy & Hold, even after capital gains are deducted on an annual basis from trading profits.

https://priceinfodynamics.com/wp-content/uploads/2020/06/Predictions-of-High-and-Low-Prices-as-Technical-Indicators.pdf

Contact me at [email protected] for more information about this new market indicator.

It basically just scratches the surface of what new insights to stock trading can be developed with suitably accurate predictions of high and low security prices over various periods.

July 2020 – First New Post in While

Since my last post in 2017, I have hunkered down on a stock price forecasting idea and related trading system. With the help of several talented and dedicated persons over these years, we basically “got it.” What we created can be looked at as a “new paradigm” in stock trading – nothing less than that.

While I intend to evangelize this in coming posts, let’s first recognize startling developments since 2017 – with respect to the global economy, business forecasting and forecasting behavior more generally (e.g. predicting spread of COVID-19).

Google Analytics pinged me recently to note that tens of thousands visited this site in 2019 – even though posts stopped in 2017.

So here are some impressions.

First, the numbers for unemployment and impact of GDP from March 2020 on look like they are “off the charts.” Nothing has happened quite like the lockdown in the US, China, Korea, Japan, and many European countries.

As a secondary consequence, growth in liabilities of the Federal Reserve bank and the US deficit also are “off the charts.” Hockey stick movements up.

Meanwhile, the US stock market, probably because of massive injections of “liquidity” by the US Federal Reserve, has, as of this writing, nearly recovered peak levels seen before the February 2020 correction.

“Dr. Doom” – Professor Nouriel Roubini of New York University is back at it – predicting a decade of depression 2021 and later.

In short, this is a situation where there is a growing demand for some type of forward guidance, some predictions of what is going to happen.

My time resources for providing a public perspective on this are limited – but I think it does make sense to keep this blog moving forward.

Keep checking, and eventually, we will set up means to get notifications.

Stay safe and stay well.

Portfolio Analysis

Greetings again. Took a deep dive into portfolio analysis for a colleague.

Portfolio analysis, of course, has been deeply influenced by Modern Portfolio Theory (MPT) and the work of Harry Markowitz and Robert Merton, to name a couple of the giants in this field.

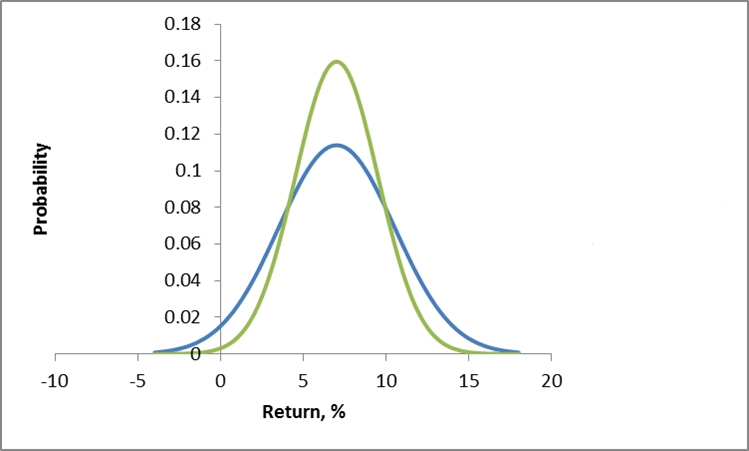
Conventionally, investment risk is associated with the standard deviation of returns. So one might visualize the dispersion of actual returns for investments around expected returns, as in the following chart.

investmentrisk

Here, two investments have the same expected rate of return, but different standard deviations. Viewed in isolation, the green curve indicates the safer investment.

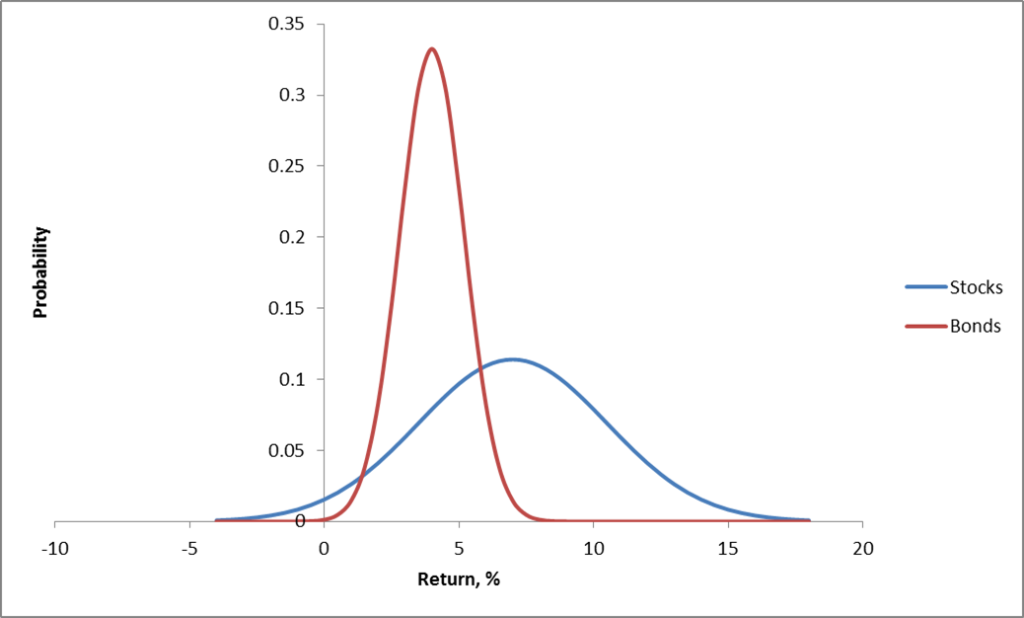
More directly relevant for portfolios are curves depicting the distribution of typical returns for stocks and bonds, which can be portrayed as follows.

stocksbonds

Now the classic portfolio is comprised of 60 percent stocks and 40 percent bonds.

Where would its expected return be? Well, the expected value of a sum of random variables is the sum of their expected values. There is an algebra of expectations to express this around the operator E(.). So we have E(.6S+.4B)=.6E(S)+.4E(B), since a constant multiplied into a random variable just shifts the expectation by that factor. Here, of course, S stands for “stocks” and B “bonds.”

Thus, the expected return for the classic 60/40 portfolio is less than the returns that could be expected from stocks alone.

But the benefit here is that the risks have been reduced, too.

Thus, the variance of the 60/40 portfolio usually is less than the variance of a portfolio composed strictly of stocks.

One of the ways this is true is when the correlation or covariation of stocks and bonds is negative, as it has been in many periods over the last century. Thus, high interest rates mean slow to negative economic growth, but can be associated with high returns on bonds.

Analytically, this is because the variance of the sum of two random variables is the sum of their variances, plus their covariance multiplied by a factor of 2.

Thus, algebra and probability facts underpin arguments for investment diversification. Pick investments which are not perfectly correlated in their reaction to events, and your chances of avoiding poor returns and disastrous losses can be improved.

Implementing MPF

When there are more than two assets, you need computational help to implement MPT portfolio allocations.

For a general discussion of developing optimal portfolios and the efficient frontier see http://faculty.washington.edu/ezivot/econ424/portfoliotheorymatrixslides.pdf

There are associated R programs and a guide to using Excel’s Solver with this University of Washington course.

Also see Package ‘Portfolio’.

These programs help you identify the minimum variance portfolio, based on a group of assets and histories of their returns. Also, it is possible to find the minimum variance combination from a designated group of assets which meet a target rate of return, if, in fact, that is feasible with the assets in question. You also can trace out the efficient frontier – combinations of assets mapped in a space of returns and variances. These assets in each case have expected returns on the curve and are minimum variance compared with all other combinations that generate that rate of return (from your designated group of assets).

One of the governing ideas is that this efficient frontier is something an individual investor might travel along as they age – going from higher risk portfolios when they are younger, to more secure, lower risk portfolios, as they age.

Issues

As someone who believes you don’t really know something until you can compute it, it interests me that there are computational issues with implementing MPT.

I find, for example, that the allocations are quite sensitive to small changes in expected returns, variances, and the underlying covariances.

One of the more intelligent, recent discussions with suggested “fixes” can be found in An Improved Estimation to Make Markowitz’s Portfolio Optimization Theory Users Friendly and Estimation Accurate with Application on the US Stock Market Investment.

The more fundamental issue, however, is that MPT appears to assume that stock returns are normally distributed, when everyone after Mandelbrot should know this is hardly the case.

Again, there is a vast literature, but a useful approach seems to be outlined in Modelling in the spirit of Markowitz portfolio theory in a non-Gaussian world. These authors use MPT algorithms as the start of a search for portfolios which minimize value-at-risk, instead of variances.

Finally, if you want to cool off and still stay on point, check out the 2014 Annual Report of Berkshire Hathaway, and, especially, the Chairman’s Letter. That’s Warren Buffett who has truly mastered an old American form which I believe used to be called “cracker barrel philosophy.” Good stuff.

Investment and Other Bank Macro Forecasts and Outlooks – 2

Today, I take a brief look at economic forecasts available from Morgan Stanley, Wells Fargo, and the French concern Credit Agricole. As readers will note, Morgan Stanley has a lively discussion of the implications of the US midterms, while Wells Fargo has a very comprehensive and easy-to-access series of economic projections, ranging from weekly, to monthly and annual. Credit Agricole (apologies for omitting the accent mark) is the first European bank profiled in these brief looks, and has quarterly updates of fairly comprehensive economic projections across a range of variables.

And I might mention that these publications, which date back into September in many cases, are interesting to review both because of their projections and because of what they miss – notably the drop in oil prices and aggressive new round of quantitative easing by the Bank of Japan.

The fact these developments are missed in these September and even later releases qualifies them as genuine surprises. Thus, their impacts are not discounted in past market developments, and, going forward, oil prices and Japan QE could exert significant, discrete effects on markets.

Morgan Stanley

According to the Federal Reserve’s National Information Center, Morgan Stanley is the nation’s 6th largest bank.
JPMorgan

The Global Investment Committee (GOC) Weekly for November 10 is notable for some straight talk on the Implications of the US midterms, which Morgan Stanley see as slightly pro-growth, positive for equities, with constructive compromises, characteristic of lame duck presidencies. I quote fairly extensively, because the frankness of the insights and suggestions is refreshing.

The maxim that gridlock in Washington is good for markets has certainly held true during the “do nothing” Congress of the past two years. Now, with the Republicans winning control of the Senate and adding 15 seats to their House majority, the outlook appears to be for more of the same. Happily for investors, an analysis going back to 1900 shows that equity markets have averaged annualized 15% returns when the Congress is controlled by Republicans and the White House by a Democrat.

Although many pundits have suggested that the GOP sweep creates a mandate, the Global Investment Committee (GIC) sees the results as a mandate for change in the functioning and compromise in Washington rather than the embrace of a specific agenda. On that score, unlike the deeply partisan divide between the House and the Senate of the last four years that prevented any compromise bills from getting off the Hill, legislation may actually get to the president’s desk. While President Obama will be free to veto, he is now playing for his legacy and may be apt to compromise on some issues.

The Republicans’ challenge is to demonstrate leadership and competence in governing, a task that will require corralling the Tea Party caucus and, as Morgan Stanley & Co. Chief US Economist Vincent Reinhart wrote last week, “sequencing priorities” in a constructive way. Lacking a coherent issue-driven platform, most Republicans simply ran against Obama. Party infighting or an immediate battle about the debt ceiling and budget authorizations would likely be disastrous for the GOP—and the markets. From the GIC’s perspective, a better result would be for Congress to focus on job-creating initiatives and not on eviscerating the Affordable Care Act (ACA).

Agreement should be easiest around initiatives involving the energy sector, where this year’s 25% decline in oil prices has been front and center. American energy independence is no longer a dream but a real prospect with profound geopolitical as well as economic consequences (see Chart of the Week, page 3). Heretofore, the Keystone XL pipeline, a six-year-old proposal to connect Canadian oil with US Gulf Coast refineries, has been stalled amid wrangling with environmentalists. We believe the pipeline is now likely to win approval, creating a large national infrastructure project. Similarly, the growth of US energy supply is likely to reignite a debate on oil exports, which have been banned since the Arab oil embargoes of the 1970s. With US dollar strength likely to crimp other exports, expanding energy exports is a way to maintain economic growth. There is likely to be similar debate about exports of liquefied natural gas as the US is the world’s largest and lowest-cost producer. We believe that energy exports would be a major beneficiary focus if the new Congress approves the Trans-Pacific Partnership, a free trade agreement that would give the president authority to negotiate deals with 11 Asian nations.

Beyond energy, we expect repeal of the medical-device tax; expansion of defense spending, which has been curtailed under sequestration; and a debate on corporate tax reform, especially given the noise around tax-driven international mergers. Revisions to the ACA, to the extent they are pursued, will likely focus on measures that impact the number of insured and thus, hospitals and managed-care companies. The employer mandate, which requires employers with more than 100 workers to make available health insurance for any employee working more than 30 hours per week, is most likely to be revised, in our view.

As a final note, a review of state and local ballot initiatives suggest that voters are far from embracing an ideological position on fiscal austerity. Minimum-wage increases were passed in each state where they were on the ballot as did several large new-money infrastructure projects in New York and California—a development that MS & Co. Municipals Strategist, Michael Zezas, notes will likely increase bond supplies in 2015.

It looks like the august Global Economic Forum is being being published more infrequently than in the past, the last edition being March 5 of this year.

Wells Fargo

Wells Fargo, accounting to Wikipedia is –

an American multinational banking and financial services holding company which is headquartered in San Francisco, California, with “hubquarters” throughout the country… It is the fourth largest bank in the U.S. by assets and the largest bank by market capitalization…Wells Fargo is the second largest bank in deposits, home mortgage servicing, and debit cards. In 2011, Wells Fargo was the 23rd largest company in the United States.

The Wells Fargo website has a suite of forecasting reports, ranging from weekly, to monthly, to the big annual report, all downloadable in PDF format.

In October, the bank also released this video interview about their economic outlook.


In case you did not get time to watch that, one of the key graphics is the PCE deflator, which has been trending down recently, raising the spectre of deflation in the minds of some.
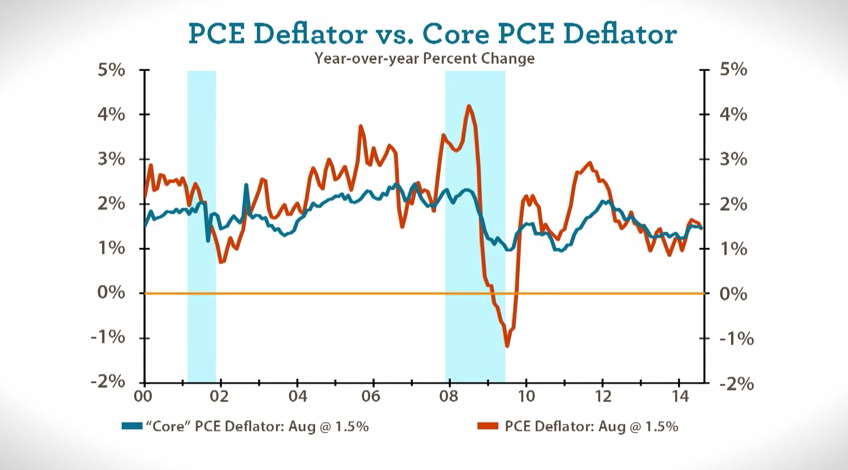
PCEdeflator

Credit Agricole

Credit Agricole is an international full services banking company, headquartered in France, with historical ties to French farming,

Their website offers at least two quarterly macroeconomic forecasting publications.

The publication Economic and Financial Forecasts presents a series of tabular forecasts for interest rates, exchange rates and commodity prices, together with the Crédit Agricole Group’s central economic projections. This is a kind of “just the numbers ma’am report.”

Macro Prospects is more discursive and with short highlights on key countries, such as, in the September issue, Brazil and China.

I signed up for emails from Credit Agricole, announcing updates of these documents.
Cycles -1

I’d like  to focus on cycles in business and economic forecasting for the next posts.

The Business Cycle

“Cycles” – in connection with business and economic time series – evoke the so-called business cycle.

Immediately after World War II, Burns and Mitchell offered the following characterization –

Business cycles are a type of fluctuation found in the aggregate economic activity of nations that organize their work mainly in business enterprises: a cycle consists of expansions occurring at about the same time in many economic activities, followed by similarly general recessions, contractions, and revivals which merge into the expansion phase of the next cycle

Earlier, several types of business and economic cycles were hypothesized, based on their average duration. These included the 3 to 4 year Kitchin inventory investment cycle, a 7 to 11 year Juglar cycle associated with investment in machines, the 15 to 25 year Kuznets cycle, and the controversial Kondratieff cycle of from 48 to 60 years.

Industry Cycles

I have looked at industry cycles relating to movements of sales and prices in semiconductor and computer markets. While patterns may be changing, there is clear evidence of semi-regular pulses of activity in semiconductors and related markets. These stochastic cycles probably are connected with Moore’s Law and the continuing thrust of innovation and new product development.

Methods

Spectral analysis, VAR modeling, and standard autoregressive analysis are tools for developing evidence for time series cycles. STAMP, now part of the Oxmetrics suite of software, fits cycles with time-varying parameters.

Sometimes one hears of estimations in the time domain moving into the frequency domain. Time series, as normally graphed with time on the horizontal axis, are in the “time domain.” This is where VAR and autoregressive models operate. The frequency domain is where we get indications of the periodicity of cycles and semi-cycles in a time series.

Cycles as Artifacts

There is something roughly analogous to spurious correlation in regression analysis in the identification of cyclical phenomena in time series. Eugen Slutsky, a Russian mathematical economist and statistician, wrote a famous “unknown” paper on how moving averages of random numbers can create the illusion of cycles. Thus, if we add or average together elements of a time series in a moving window, it is easy to generate apparently cyclical phenomena. This can be demonstrated with the digits in the irrational number π, for example, since the sequence of digits 1 through 9 in its expansion is roughly random.

Significances

Cycles in business have sort of reassuring effect, it seems to me. And, of course, we are all very used to any number of periodic phenomena, ranging from the alternation of night and day, the phases of the moon, the tides, and the myriad of biological cycles.

As a paradigm, however, they probably used to be more important in business and economic circles, than they are today. There is perhaps one exception, and that is in rapidly changing high tech fields of which IT (information technology) is still in many respects a subcategory.

I’m looking forward to exploring some estimations, putting together some quantitative materials on this.

Links – late July

First post with my Android, so there are some minor items that need polishing – mainly how to embed links. It’s a complicated process, compared with MS Word and Windows.

In any case,  there are couple of fairly deep pieces here.

Enjoy.

A detailed exposé on how the market is rigged from a data-centric approach

We received trade execution reports from an active trader who wanted to know why his large orders almost never completely filled, even when the amount of stock advertised exceeded the number of shares wanted. For example, if 25,000 shares were at the best offer, and he sent in a limit order at the best offer price for 20,000 shares, the trade would, more likely than not, come back partially filled. In some cases, more than half of the amount of stock advertised (quoted) would disappear immediately before his order arrived at the exchange. This was the case, even in deeply liquid stocks such as Ford Motor Co (symbol F, market cap: $70 Billion, NYSE DMM is Barclays). The trader sent us his trade execution reports, and we matched up his trades with our detailed consolidated quote and trade data to discover that the mechanism described in Michael Lewis’s “Flash Boys” was alive and well on Wall Street.

This is just beautifully done. clean, simple, irrefutable. i hope it gets read far and wide. –Michael Lewis after reading this article

Did the Other Shoe Just Drop? Black Rock and PIMCO Sue Banks for $250 Billion. Any award this size would destabilize the banking system.

Rand Paul eyes tech-oriented donors, geeks in Bay Area.  The libertarian wedge in a liberal-dem stronghold.

Predictive analytics at World Cup  – Goldman Sachs does a big face plant, predicts Brazil would win. Importance of crowd-sourcing.

A Hands-on Lesson in Return Forecasting Models. I’ve almost never seen a longer blog post, and it ends up dissing the predictive models it exhaustively covers. But I think you will want to bookmark this one, and return to it for examples and ideas.


Yellen Yap: Silliness, Outright Lies, and Some Refreshingly Accurate Reporting. Point of concord between libertarian free market advocates and progressive-left commentators.


Video Friday – Andrew Ng’s Machine Learning Course

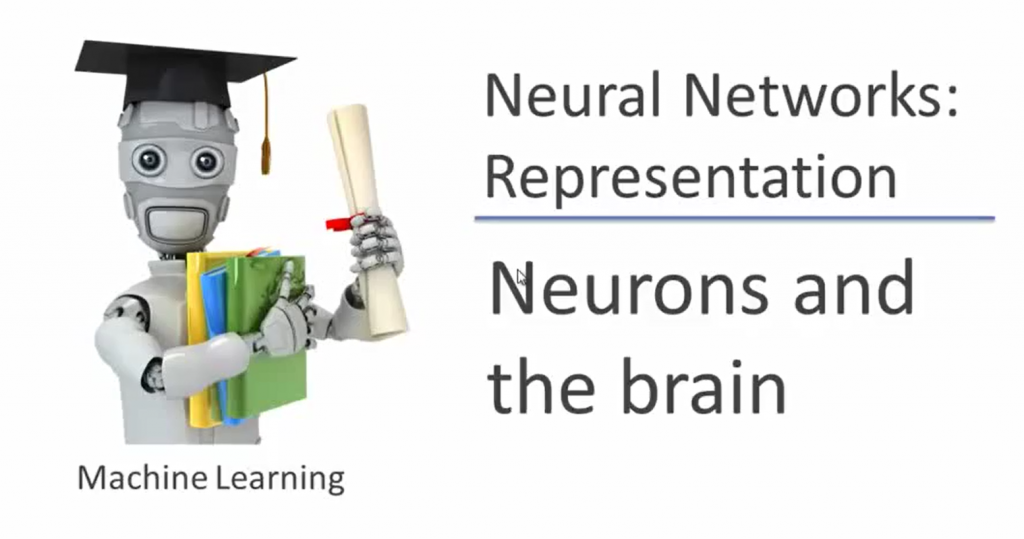
Well, I signed up for Andrew Ng’s Machine Learning Course at Stanford. It began a few weeks ago, and is a next generation to lectures by Ng circulating on YouTube. I’m going to basically audit the course, since I started a little late, but I plan to take several of the exams and work up a few of the projects. This course provides a broad introduction to machine learning, datamining, and statistical pattern recognition. Topics include: (i) Supervised learning (parametric/non-parametric algorithms, support vector machines, kernels, neural networks). (ii) Unsupervised learning (clustering, dimensionality reduction, recommender systems, deep learning). (iii) Best practices in machine learning (bias/variance theory; innovation process in machine learning and AI). The course will also draw from numerous case studies and applications, so that you’ll also learn how to apply learning algorithms to building smart robots (perception, control), text understanding (web search, anti-spam), computer vision, medical informatics, audio, database mining, and other areas. I like the change in format. The YouTube videos circulating on the web are lengthly, and involve Ng doing derivations on white boards. This is a more informal, expository format. Here is a link to a great short introduction to neural networks. Ngrobot Click on the link above this picture, since the picture itself does not trigger a YouTube. Ng’s introduction on this topic is fairly short, so here is the follow-on lecture, which starts the task of representing or modeling neural networks. I really like the way Ng approaches this is grounded in biology. I believe there is still time to sign up. Comment on Neural Networks and Machine Learning I can’t do much better than point to Professor Ng’s definition of machine learning – Machine learning is the science of getting computers to act without being explicitly programmed. In the past decade, machine learning has given us self-driving cars, practical speech recognition, effective web search, and a vastly improved understanding of the human genome. Machine learning is so pervasive today that you probably use it dozens of times a day without knowing it. Many researchers also think it is the best way to make progress towards human-level AI. In this class, you will learn about the most effective machine learning techniques, and gain practice implementing them and getting them to work for yourself. More importantly, you’ll learn about not only the theoretical underpinnings of learning, but also gain the practical know-how needed to quickly and powerfully apply these techniques to new problems. Finally, you’ll learn about some of Silicon Valley’s best practices in innovation as it pertains to machine learning and AI. And now maybe this is the future – the robot rock band.

Predicting the Singularity, the Advent of Superintelligence

From thinking about robotics, automation, and artificial intelligence (AI) this week, I’m evolving a picture of the future – the next few years. I think you have to define a super-technological core, so to speak, and understand how the systems of production, communication, and control mesh and interpenetrate across the globe. And how this sets in motion multiple dynamics.

But then there is the “singularity” –  whose main publicizer is Ray Kurzweil, current Director of Engineering at Google. Here’s a particularly clear exposition of his view.

There’s a sort of rebuttal by Paul Root Wolpe.

Part of the controversy, as in many arguments, is a problem of definition. Kurzweil emphasizes a “singularity” of superintelligence of machines. For him, the singularity is at first the point at which the processes of the human brain will be well understood and thinking machines will be available that surpass human capabilities in every respect. Wolpe, on the other hand, emphasizes the “event horizon” connotation of the singularity – that point beyond which out technological powers will have become so immense that it is impossible to see beyond.

And Wolpe’s point about the human brain is probably well-taken. Think, for instance, of how decoding the human genome was supposed to unlock the secrets of genetic engineering, only to find that there were even more complex systems of proteins and so forth.

And the brain may be much more complicated than the current mechanical models suggest – a view espoused by Roger Penrose, English mathematical genius. Penrose advocates a  quantum theory of consciousness. His point, made first in his book The Emperor’s New Mind, is that machines will never overtake human consciousness, because, in fact, human consciousness is, at the limit, nonalgorithmic. Basically, Penrose has been working on the idea that the brain is a quantum computer in some respect.

I think there is no question, however, that superintelligence in the sense of fast computation, fast assimilation of vast amounts of data, as well as implementation of structures resembling emotion and judgment – all these, combined with the already highly developed physical capabilities of machines, mean that we are going to meet some mojo smart machines in the next ten to twenty years, tops.

The dysutopian consequences are enormous. Bill Joy, co-founder of Sun Microsystems, wrote famously about why the future does not need us. I think Joy’s singularity is a sort of devilish mirror image of Kurzweil’s – for Joy the singularity could be a time when nanotechnology, biotechnology, and robotics link together to make human life more or less impossible, or significantly at risk.

There’s is much more to say and think on this topic, to which I hope to return from time to time.

Meanwhile, I am reminded of Voltaire’s Candide who, at the end of pursuing the theories of Dr. Pangloss, concludes “we must cultivate our garden.”