Tag Archives: Data Science

Hal Varian and the “New” Predictive Techniques

Big Data: New Tricks for Econometrics is, for my money, one of the best discussions of techniques like classification and regression trees, random forests, and penalized  regression (such as lasso, lars, and elastic nets) that can be found.

Varian, pictured aove, is emeritus professor in the School of Information, the Haas School of Business, and the Department of Economics at the University of California at Berkeley. Varian retired from full-time appointments at Berkeley to become Chief Economist at Google.

He also is among the elite academics publishing in the area of forecasting according to IDEAS!.

Big Data: New Tricks for Econometrics, as its title suggests, uses the wealth of data now being generated (Google is a good example) as a pretext for promoting techniques that are more well-known in machine learning circles, than in econometrics or standard statistics, at least as understood by economists.

First, the sheer size of the data involved may require more sophisticated 18 data manipulation tools. Second, we may have more potential predictors than appropriate for estimation, so we need to do some kind of variable selection. Third, large data sets may allow for more flexible relationships than simple linear models. Machine learning techniques such as decision trees, support vector machines, neural nets, deep learning and so on may allow for more effective ways to model complex relationships.

He handles the definitional stuff deftly, which is good, since there is not standardization of terms yet in this rapidly evolving field of data science or predictive analytics, whatever you want to call it.

Thus, “NoSQL” databases are

sometimes interpreted as meaning “not only SQL.” NoSQL databases are more primitive than SQL databases in terms of data manipulation capabilities but can handle larger amounts of data.

The essay emphasizes out-of-sample prediction and presents a nice discussion of k-fold cross validation.

1. Divide the data into k roughly equal subsets and label them by s =1; : : : ; k. Start with subset s = 1.

2. Pick a value for the tuning parameter.

3. Fit your model using the k -1 subsets other than subset s.

4. Predict for subset s and measure the associated loss.

5. Stop if s = k, otherwise increment s by 1 and go to step 2.

Common choices for k are 10, 5, and the sample size minus 1 (“leave one out”). After cross validation, you end up with k values of the tuning parameter and the associated loss which you can then examine to choose an appropriate value for the tuning parameter. Even if there is no tuning parameter, it is useful to use cross validation to report goodness-of-t measures since it measures out-of-sample performance which is what is typically of interest.

Varian remarks that Test-train and cross validation, are very commonly used in machine learning and, in my view, should be used much more in economics, particularly when working with large datasets

But this essay is by no means methodological, and presents several nice worked examples, showing how, for example, regression trees can outperform logistic regression in analyzing survivors of the sinking of the Titanic – the luxury ship, and how several of these methods lead to different imputations of significance to the race factor in the Boston Housing Study.

The essay also presents easy and good discussions of bootstrapping, bagging, boosting, and random forests, among the leading examples of “new” techniques – new to economists.

For the statistics wonks, geeks, and enthusiasts among readers, here is a YouTube presentation of the paper cited above with extra detail.

 

What’s the Lift of Your Churn Model? – Predictive Analytics and Big Data

Churn analysis is a staple of predictive analytics and big data. The idea is to identify attributes of customers who are likely leave a mobile phone plan or other subscription service, or, more generally, switch who they do business with. Knowing which customers are likely to “churn” can inform customer retention plans. Such customers, for example, may be contacted in targeted call or mailing campaigns with offers of special benefits or discounts.

Lift is a concept in churn analysis. The lift of a target group identified by churn analysis reflects the higher proportion of customers who actually drop the service or give someone else their business, when compared with the population of customers as a whole. If, typically, 2 percent of customers drop the service per month, and, within the group identified as “churners,” 8 percent drop the service, the “lift” is 4.

In interesting research, originally published in the Harvard Business Review, Gregory Piatetsky-Shapiro questions the efficacy of big data applied to churn analysis – based on an estimation of costs and benefits.

We looked at some 30 different churn-modeling efforts in banking and telecom, and surprisingly, although the efforts used different data and different modeling algorithms, they had very similar lift curves. The lists of top 1% likely defectors had a typical lift of around 9-11. Lists of top 10% defectors all had a lift of about 3-4. Very similar lift curves have been reported in other work. (See here and here.) All this suggests a limiting factor to prediction accuracy for consumer behavior such as churn.

Backtracking through earlier research by Piatetsky-Shapiro and his co-researchers, there is this nugget,

For targeted marketing campaigns, a good model lift at T, where T is the target rate in the overall population, is usually sqrt(1/T) +/- 20%.

So, if the likely “churners” are 5 percent of the customer group, a reasonable expectation of the lift that can be obtained from churn analysis is 4.47. This means probably no more than 25 percent of the target group identified by the churn analysis will, in fact, do business elsewhere in the defined period.

This is a very applied type of result, based on review of 30 or more studies.

But the point Piatetsky-Shapiro make is that big data probably can’t push these lift numbers much higher, because of the inherent randomness in the behavior of consumers. And small gains to existing methods simply do not meet a cost/benefit criterion.

Some Israeli researchers may in fact best these numbers with a completely different approach based on social network analysis. Their initial working hypothesis was that social influence on churn is highly dominant in relatively tight social groups. Their approach is clearly telecommunications-based, since they analyzed patterns of calling between customers, identifying networks of callers who had more frequent communications.

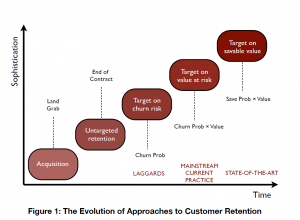
Still, there is a good argument for an evolution from standard churn analysis to predictive analytics that uncovers the value-at-risk in the customer base, or even the value that can be saved by customer retention programs. Customers who have trouble paying their bill, for example, might well be romanced less strongly by customer retention efforts, than premium customers.

evolution

Along these lines, I enjoyed reading the Stochastic Solutions piece on who can be saved and who will be driven away by retention activity, which is responsible for the above graphic.

It has been repeatedly demonstrated that the very act of trying to ‘save’ some customers provokes them to leave. This is not hard to understand, for a key targeting criterion is usually estimated churn probability, and this is highly correlated with customer dissatisfaction. Often, it is mainly lethargy that is preventing a dissatisfied customer from actually leaving. Interventions designed with the express purpose of reducing customer loss can provide an opportunity for such dissatisfaction to crystallise, provoking or bringing forward customer departures that might otherwise have been avoided, or at least delayed. This is especially true when intrusive contact mechanisms, such as outbound calling, are employed. Retention programmes can be made more effective and more profitable by switching the emphasis from customers with a high probability of leaving to those likely to react positively to retention activity.

This is a terrific point. Furthermore,

..many customers are antagonised by what they feel to be intrusive contact mechanisms; indeed, we assert without fear of contradiction that only a small proportion of customers are thrilled, on hearing their phone ring, to discover that the caller is their operator. In some cases, particularly for customers who are already unhappy, such perceived intrusions may act not merely as a catalyst but as a constituent cause of churn.

Bottom-line, this is among the most interesting applications of predictive analytics.

Logistic regression is a favorite in analyzing churn data, although techniques range from neural networks to regression trees.

Measuring the Intelligence of Crowds

Researchers at Microsoft Research in the UK and Cambridge University report some fascinating and potentially useful results on crowdsourcing, based on a study of aggregating questions from a standard IQ test on Amazon’s Mechanical Turk (AMT).

The AMT site provides a place where workers can find problems that requesters have set up for crowdsourcing.

The introductory page to the site looks like this (click to enlarge).

AMT

So here’s an interesting way for people to make some money working from home, at their own hours, and yet stay busy. I’d like to look more deeply into this in a future post, but what these Crowd IQ researchers did is divvy up the questions from a widely utilized IQ test on the AMT site. They studied the effects of changing several parameters on their measures of Crowd IQ, but basically found that, with five or more reputable workers in a group, the Crowd IQ was usually higher than that of the individual workers in the group.

The Abstract for their 2012 study Crowd IQ: Measuring the Intelligence of Crowdsourcing Platforms describes the research and findings succinctly:

We measure crowdsourcing performance based on a standard IQ questionnaire, and examine Amazon’s Mechanical Turk (AMT) performance under different conditions. These include variations of the payment amount offered, the way incorrect responses affect workers’ reputations, threshold reputation scores of participating AMT workers, and the number of workers per task. We show that crowds composed of workers of high reputation achieve higher performance than low reputation crowds, and the effect of the amount of payment is non-monotone—both paying too much and too little affects performance. Furthermore, higher performance is achieved when the task is designed such that incorrect responses can decrease workers’ reputation scores. Using majority vote to aggregate multiple responses to the same task can significantly improve performance, which can be further boosted by dynamically allocating workers to tasks in order to break ties.

The IQ test is Raven’s Standard Progressive Matrices (SPM). If you want to take the test, look here.

SPM is a nonverbal, multiple-choice intelligence test based on the theory of general ability. The general setup is as in the following example.

Ravenex

Free riders are an interesting problem in a site like the Mechanical Turk. So, if people get paid by the number of correct answers, some simply select responses at random to maximize the speed at which they can put up answers. Because of this, AMT has a reputation mechanism indicating the expected quality of work of a worker, based on his or her past performance.

This research is has real-world implications. For example, increasing the payment for tasks too much results in actually diminuishing the quality of the answers, for a variety of reasons the authors consider.

The “workers” in this AMT-based study did not consult with each other about the answers, but were grouped into teams somehow by the researchers.

Here is a chart showing the increase in crowd IQ with the number of people in the group.

MSFTcurve

Here a HIT refers to a Human Intelligence Task.

 Recommendations

First, experiment and monitor the performance. Our results suggest that relatively small changes to the parameters of the task may result in great changes in crowd performance. Changing parameters of the task (e.g. reward, time limits, reputation rage) and observing changes in performance may allow you to greatly increase performance. Second, make sure to threaten workers’ reputation by emphasizing that their solutions will be monitored and wrong responses rejected. Obviously, in a real-world setting it may be hard to detect free-riders without using a “gold-set” of test questions to which the requester already knows the correct response. However, designing and communicating HIT rejection conditions can discourage free riding or make it risky and more difficult. For instance, in the case of translation tasks requesters should determine what is not acceptable (e.g. using Google Translate) and may suggest that the response quality would be monitored and solutions of low quality would be rejected. Third, do not over-pay. Although the reward structure obviously depends on the task at hand and the expected amount of effort required to solve it, our results suggest that pricing affects not only the ability to s source enough workers to perform the task but also the quality of the obtained results. Higher rewards are likely to encourage a free-riding behavior and may affect the cognitive abilities of workers by increasing psychological pressure. Thus, for long term projects or tasks that are run repeatedly in a production environment, we believe it is worthwhile to experiment with the reward scheme in order to
find an optimum reward level. Fourth, aggregate multiple solutions to each HIT, preferably using an adaptive sourcing scheme. Even the simplest aggregation method – majority voting – has a potential to greatly improve the quality of the solution. In the context of more complicated tasks, e.g. translations, requesters may consider a two-stage design in which they first request several solutions, and then use another batch of workers to vote for the best one. Additionally, requesters may consider inspecting the responses provided by individuals that often disagree with the crowd – they might be coveted geniuses or free-riders deserving rejection.

Interesting stuff, and makes you want to try crowdsourcing.

Analytics 2013 Conference in Florida

Looking for case studies of data analytics or predictive analytics, or for Big Data applications?

You can hardly do better, on a first cut, than peruse the material now available from October’s Analytics 2013 Conference, held at the Hyatt Regency Hotel in Orlando, Florida.

Presented by SAS, dozens of presentations and posters from the Conference can be downloaded as zip files, unbundling as PDF files.

Download the conference presentations and poster presentations (.zip)

I also took an hour to look at the Keynote Presentation of Dr. Sven Crone of Lancaster University in the UK, now available on YouTube.

Crone, who also is affiliated with the Lancaster Centre for Forecasting, gave a Keynote which was, in places, fascinating, and technical and a little obscure elsewhere – worth watching if you time, or can run it in the background while you sort through your desk, for example.

A couple of slides caught my attention.

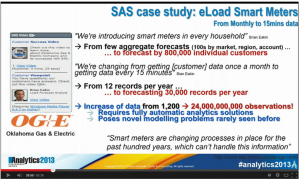
One segment gave concrete meaning to the explosion of data available to forecasters and analysts. For example, for electric power load forecasting, it used be the case that you had, perhaps, monthly total loads for the system or several of its parts, or perhaps daily system loads. Now, Crone notes the data to be modeled has increased by orders of magnitude, for example, with Smart Meters recording customer demand at fifteen minute intervals.

 Analytics13A1                      

Another part of Crone’s talk which grabbed my attention was his discussion of forecasting techniques employed by 300 large manufacturing concerns, some apparently multinational in scale. The following graph – which is definitely obscure by virtue of its use of acronyms for types of forecasting systems, like SOP for Sales and Operation Planning – highlights that almost no company uses anything except the simplest methods for forecasting, relying largely on judgmental approaches. This aligns with a survey I once did which found almost no utilities used anything except the simplest per capita forecasting approaches. Perhaps things have changed now.

Analytics13A1 Analytics13A2

Crone suggests relying strictly on judgment becomes sort of silly in the face of the explosion of information now available to management.

Another theme Crone spins in an amusing, graphic way is that the workhorses of business forecasting, such as exponential smoothing, are really products from many decades ago. He uses funny pics of old business/office environments, asking whether this characterizes your business today.

The analytic meat of the presentation comes with exposition of bagging and boosting, as well as creative uses for k-means clustering in time series analysis.

At which point he descends into a technical wonderland of complexity.

Incidentally, Analytics 2014 is scheduled for Frankfurt, Germany June 4-5 this coming Spring.

Watch here for my follow-on post on boosting time series.