Category Archives: exponential smoothing forecasts

Wrap on Exponential Smoothing

Here are some notes on essential features of exponential smoothing.

  1. Name. Exponential smoothing (ES) algorithms create exponentially weighted sums of past values to produce the next (and subsequent period) forecasts. So, in simple exponential smoothing, the recursion formula is Lt=αXt+(1-α)Lt-1 where α is the smoothing constant constrained to be within the interval [0,1], Xt is the value of the time series to be forecast in period t, and Lt is the (unobserved) level of the series at period t. Substituting the similar expression for Lt-1 we get Lt=αXt+(1-α) (αXt-1+(1-α)Lt-2)= αXt+α(1-α)Xt-1+(1-α)2Lt-2, and so forth back to L1. This means that more recent values of the time series X are weighted more heavily than values at more distant times in the past. Incidentally, the initial level L1 is not strongly determined, but is established by one ad hoc means or another – often by keying off of the initial values of the X series in some manner or another. In state space formulations, the initial values of the level, trend, and seasonal effects can be included in the list of parameters to be established by maximum likelihood estimation.
  2. Types of Exponential Smoothing Models. ES pivots on a decomposition of time series into level, trend, and seasonal effects. Altogether, there are fifteen ES methods. Each model incorporates a level with the differences coming as to whether the trend and seasonal components or effects exist and whether they are additive or multiplicative; also whether they are damped. In addition to simple exponential smoothing, Holt or two parameter exponential smoothing is another commonly applied model. There are two recursion equations, one for the level Lt and another for the trend Tt, as in the additive formulation, Lt=αXt+(1-α)(Lt-1+Tt-1) and Tt=β(Lt– Lt-1)+(1-β)Tt-1 Here, there are now two smoothing parameters, α and β, each constrained to be in the closed interval [0,1]. Winters or three parameter exponential smoothing, which incorporates seasonal effects, is another popular ES model.
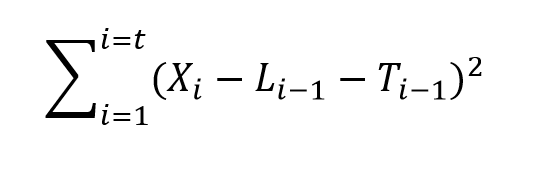
  3. Estimation of the Smoothing Parameters. The original method of estimating the smoothing parameters was to guess their values, following guidelines like “if the smoothing parameter is near 1, past values will be discounted further” and so forth. Thus, if the time series to be forecast was very erratic or variable, a value of the smoothing parameter which was closer to zero might be selected, to achieve a longer period average. The next step is to set up a sum of the squared differences of the within sample predictions and minimize these. Note that the predicted value of Xt+1 in the Holt or two parameter additive case is Lt+Tt, so this involves minimizing the expression Sqerroreq Currently, the most advanced method of estimating the value of the smoothing parameters is to express the model equations in state space form and utilize maximum likelihood estimation. It’s interesting, in this regard, that the error correction version of ES recursion equations are a bridge to this approach, since the error correction formulation is found at the very beginnings of the technique. Advantages of using the state space formulation and maximum likelihood estimation include (a) the ability to estimate confidence intervals for point forecasts, and (b) the capability of extending ES methods to nonlinear models.
  4. Comparison with Box-Jenkins or ARIMA models. ES began as a purely applied method developed for the US Navy, and for a long time was considered an ad hoc procedure. It produced forecasts, but no confidence intervals. In fact, statistical considerations did not enter into the estimation of the smoothing parameters at all, it seemed. That perspective has now changed, and the question is not whether ES has statistical foundations – state space models seem to have solved that. Instead, the tricky issue is to delineate the overlap and differences between ES and ARIMA models. For example, Gardner makes the statement that all linear exponential smoothing methods have equivalent ARIMA models. Hyndman points out that the state space formulation of ES models opens the way for expressing nonlinear time series – a step that goes beyond what is possible in ARIMA modeling.
  5. The Importance of Random Walks. The random walk is a forecasting benchmark. In an early paper, Muth showed that a simple exponential smoothing model provided optimal forecasts for a random walk. The optimal forecast for a simple random walk is the current period value. Things get more complicated when there is an error associated with the latent variable (the level). In that case, the smoothing parameter determines how much of the recent past is allowed to affect the forecast for the next period value.
  6. Random Walks With Drift. A random walk with drift, for which a two parameter ES model can be optimal, is an important form insofar as many business and economic time series appear to be random walks with drift. Thus, first differencing removes the trend, leaving ideally white noise. A huge amount of ink has been spilled in econometric investigations of “unit roots” – essentially exploring whether random walks and random walks with drift are pretty much the whole story when it comes to major economic and business time series.
  7. Advantages of ES. ES is relatively robust, compared with ARIMA models, which are sensitive to mis-specification. Another advantage of ES is that ES forecasts can be up and running with only a few historic observations. This comment applied to estimation of the level and possibly trend, but does not apply in the same degree to the seasonal effects, which usually require more data to establish. There are a number of references which establish the competitive advantage in terms of the accuracy of ES forecasts in a variety of contexts.
  8. Advanced Applications.The most advanced application of ES I have seen is the research paper by Hyndman et al relating to bagging exponential smoothing forecasts.

The bottom line is that anybody interested in and representing competency in business forecasting should spend some time studying the various types of exponential smoothing and the various means to arrive at estimates of their parameters.

For some reason, exponential smoothing reaches deep into actual process in data generation and consistently produces valuable insights into outcomes.

Exponential Smoothing – I

As I wrote recently, most business forecasting assignments are relatively simple. You collect the data (often the most challenging part), and plug this data into an automatic forecasting program. The program probably applies some type of exponential smoothing (ES) to produce forecasts for a horizon of a few periods ahead, and, bam, there you have it. The rest is presentation, developing the “story” and so forth.

So what about this exponential smoothing? What’s basically involved? What are the differences between exponential smoothing and the other primary univariate forecasting technique – ARIMA or Box-Jenkins modeling? What are these automatic forecasting programs, and which ones are best?

All good questions, and, if you are interested or involved in forecasting, the answers are good to rehearse from time to time.

Level, Trend, Seasonality – Components of Time Series

Exponential smoothing originated with the work of Brown and Holt for the US Navy (see the discussion in Gardiner). The perspective was not theoretical, but applied.

Nevertheless, there is an intuitive aspect to exponential smoothing (ES). That has to do with the decomposition of time series into components – such as level, trend, and seasonal effects.

So, applying the algorithms of ES to some time series Xt t=1,2,…,n, we extract estimates of the level Lt, trend Tt, and seasonal component, St, so that at any time t, we can express Xt as

Xt = Lt + Tt + St

This would be an additive model.

It’s also possible that the time series Xt could be multiplicative, as in

Xt = LtTtSt

By way of example, consider the following time series for public construction spending in the US, obtained from FRED (Federal Reserve Economic Data).

PCS

Now if you look closely, it’s clear there are strongly delineated seasonal effects. Furthermore, these seasonal variations appear to fluctuate more or less in proportion to the annual levels of the series. Thus, the variation is considerably more over a year, when spending is at a $25 billion level, than it does at a $10 billion level.

And the fact that these levels are different, and the series does not simply oscillate around a single level, indicates that there is probably a meaningful trend component to this time series.

Automatic Forecasting Programs

These are the considerations that you take into account in building an exponential smoothing model.

Now it is possible to create ES models within the framework of a spreadsheet. Thus, ES models have smoothing parameters which can be set by minimizing a squared sum of forecast errors over historic data. In Microsoft’s Excel, you can use Solver to do this, once you set up the recursion equations for level, trend, and seasonal components or effects.

In coming posts, I want to show how this can be done for a simple example.

But really, setting up spreadsheets to estimate exponential smoothing models can be laborious, since you need a separate set of computations for every possible model. In addition to the additive and purely multiplicative models shown above, for example, there can be hybrid cases – multiplicative seasonality but additive trend, and so forth.

So it’s a good idea to equip yourself with one of the several, good automatic forecasting programs out there to speed model identification and evaluation.

I will have reference to two such automatic forecasting programs in coming posts – Forecast Pro and Rob Hyndman’s Forecast package in R. I’ll make comparisons between these programs. A demo version of Forecast Pro is available for download for free, but it is a commercial package with various options at various price steps. Hyndman’s R forecasting package, on the other hand, is open source software and free, as is the R platform. While this sounds like an unbeatable advantage, there always are questions of bugs and performance – which in this case seem to be to be resolved for reasons we can discuss.

What’s The Big Deal?

Finally, the reason why ES forecasting is so widely applied is that, in many cases, it produces forecasts which are of comparable or superior accuracy to other univariate forecasting approaches.

ES has performed well, for example, in international forecasting competitions, including the widely-publicized M-competitions.

There also is a link between exponential smoothing and the Kalman filter. So ES is in a sense an adaptive forecasting approach. For example, ES weights more recent observations more heavily than observations more distant in the past, unlike a regression trend model.

Finally, recent research has provided statistical pedigree to exponential smoothing, rescuing it in a sense from consignment to “a purely ad hoc” approach. Thus, there is a direct link between time series that embody a random walk or random walk with drift and exponential smoothing.

Bagging Exponential Smoothing Forecasts

Bergmeir, Hyndman, and Benıtez (BHB) successfully combine two powerful techniques – exponential smoothing and bagging (bootstrap aggregation) – in ground-breaking research.

I predict the forecasting system described in Bagging Exponential Smoothing Methods using STL Decomposition and Box-Cox Transformation will see wide application in business and industry forecasting.

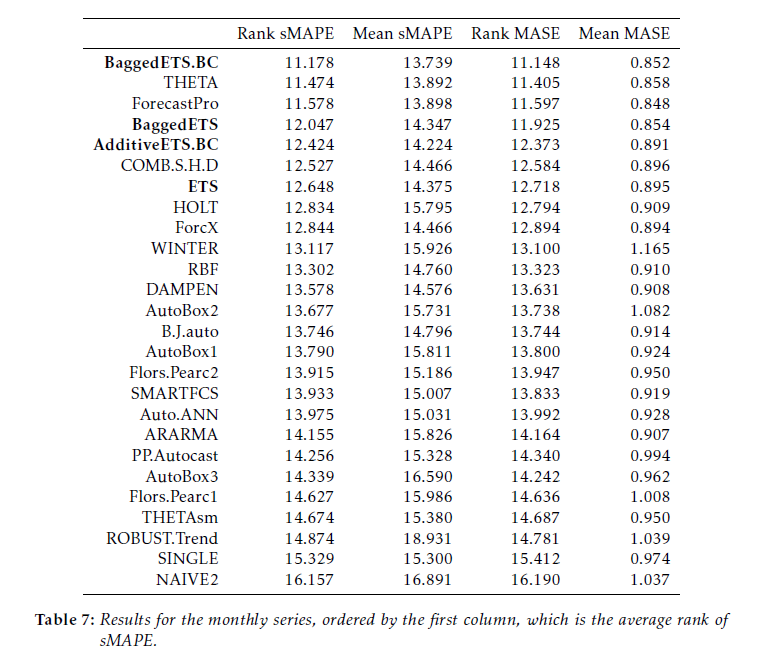
These researchers demonstrate their algorithms for combining exponential smoothing and bagging outperform all other forecasting approaches in the M3 forecasting competition database for monthly time series, and do better than many approaches for quarterly and annual data. Furthermore, the BHB approach can be implemented with extant routines in the programming language R.

This table compares bagged exponential smoothing with other approaches on monthly data from the M3 competition.

BaggedES

Here BaggedETS.BC refers to a variant of the bagged exponential smoothing model which uses a Box Cox transformation of the data to reduce the variance of model disturbances, The error metrics are the symmetric mean absolute percentage error (sMAPE) and the mean absolute scaled error (MASE). These are calculated for applications of the various models to out-of-sample, holdout, or test sample data from each of 1428 monthly time series in the competition.

See the online text by Hyndman and Athanasopoulos for motivations and discussions of these error metrics.

The BHB Algorithm

In a nutshell, here is the BHB description of their algorithm.

After applying a Box-Cox transformation to the data, the series is decomposed into trend, seasonal and remainder components. The remainder component is then bootstrapped using the MBB, the trend and seasonal components are added back, and the Box-Cox transformation is inverted. In this way, we generate a random pool of similar bootstrapped time series. For each one of these bootstrapped time series, we choose a model among several exponential smoothing models, using the bias-corrected AIC. Then, point forecasts are calculated using all the different models, and the resulting forecasts are averaged.

The MBB is the moving block bootstrap. It involves random selection of blocks of the remainders or residuals, preserving the time sequence and, hence, autocorrelation structure in these residuals.

Several R routines supporting these algorithms have previously been developed by Hyndman et al. In particular, the ets routine developed by Hyndman and Khandakar fits 30 different exponential smoothing models to a time series, identifying the optimal model by an Akaike information criterion.

Some Thoughts

This research lays out an almost industrial-scale effort to extract more information for prediction purposes from time series, and at the same time to use an applied forecasting workhorse – exponential smoothing.

Exponential smoothing emerged as a forecasting technique in applied contexts in the 1950’s and 1960’s. The initial motivation was error correction from forecasts of arbitrary origin, instead of an underlying stochastic model. Only later were relationships between exponential smoothing and time series processes, such as random walks, revealed with the work of Muth and others.

The M-competitions, initially organized in the 1970’s, gave exponential smoothing a big boost, since, by some accounts, exponential smoothing “won.” This is one of the sources of the meme – simpler models beat more complex models.

Then, at the end of the 1990’s, Makridakis and others organized a penultimate M-competition which was, in fact, won by the automatic forecasting software program Forecast Pro. This program typically compares ARIMA and exponential smoothing models, picking the best model through proprietary optimization of the parameters and tests on holdout samples. As in most sales and revenue forecasting applications, the underlying data are time series.

While all this was going on, the machine learning community was ginning up new and powerful tactics, such as bagging or bootstrap aggregation. Bagging can be a powerful technique for focusing on parameter estimates which are otherwise masked by noise.

So this application and research builds interestingly on a series of efforts by Hyndman and his associates and draws in a technique that has been largely confined to machine learning and data mining.

It is really almost the first of its kind – where bagging applications to time series forecasting have been less spectacularly successful than in cross-sectional regression modeling, for example.

A future post here will go through the step-by-step of this approach using some specific and familiar time series from the M competition data.