Category Archives: global business forecasts

Superforecasting – The Art and Science of Prediction

Philip Tetlock’s recent Superforecasting says, basically, some people do better at forecasting than others and, furthermore, networking higher performing forecasters, providing access to pooled data, can produce impressive results.

This is a change from Tetlock’s first study – Expert Political Judgment – which lasted about twenty years, concluding, famously, ‘the average expert was roughly as accurate as a dart-throwing chimpanzee.”

Tetlock’s recent research comes out of a tournament sponsored by the Intelligence Advanced Research Projects Activity (IARPA). This forecasting competition fits with the mission of IARPA, which is to improve assessments by the “intelligence community,” or IC. The IC is a generic label, according to Tetlock, for “the Central Intelligence Agency, the National Security Agency, the Defense Intelligence Agency, and thirteen other agencies.”

It is relevant that the IC is surmised (exact figures are classified) to have “a budget of more than $50 billion .. [and employ] one hundred thousand people.”

Thus, “Think how shocking it would be to the intelligence professionals who have spent their lives forecasting geopolical events – to be beaten by a few hundred ordinary people and some simple algorithms.”

Of course, Tetlock reports, this actually happened – “Thanks to IARPA, we now know a few hundred ordinary people and some simple math can not only compete with professionals supported by multibillion-dollar apparatus but also beat them.”

IARPA’s motivation, apparently, traces back to the “weapons of mass destruction (WMD)” uproar surrounding the Iraq war –

“After invading in 2003, the United States turned Iraq upside down looking for WMD’s but found nothing. It was one of the worst – arguable the worst – intelligence failure in modern history. The IC was humiliated. There were condemnations in the media, official investigations, and the familiar ritual of intelligence officials sitting in hearings ..”

So the IC needs improved methods, including utilizing “the wisdom of crowds” and practices of Tetlock’s “superforecaster” teams.

Unlike the famous M-competitions, the IARPA tournament collates subjective assessments of geopolitical risk, such as “will there be a fatal confrontation between vessels in the South China Sea” or “Will either the French or Swiss inquiries find elevated levels of polonium in the remains of Yasser Arafat’s body?”

Tetlock’s book is entertaining and thought-provoking, but many in business will page directly to the Appendix – Ten Commandments for Aspiring Superforecasters.

    1. Triage – focus on questions which are in the “Goldilocks” zone where effort pays off the most.
    2. Break seemingly intractable problems into tractable sub-problems. Tetlock really explicates this recommendation with his discussion of “Fermi-izing” questions such as “how many piano tuners there are in Chicago?.” The reference here, of course, is to Enrico Fermi, the nuclear physicist.
    3. Strike the right balance between inside and outside views. The outside view, as I understand it, is essentially “the big picture.” If you are trying to understand the likelihood of a terrorist attack, how many terrorist attacks have occurred in similar locations in the past ten years? Then, the inside view includes facts about this particular time and place that help adjust quantitative risk estimates.
    4. Strike the right balance between under- and overreacting to evidence. The problem with a precept like this is that turning it around makes it definitely false. Nobody would suggest “do not strike the right balance between under- and overreacting to evidence.” I guess keep the weight of evidence in mind.
    5. Look for clashing causal forces at work in each problem. This reminds me of one of my models of predicting real world developments – tracing out “threads” or causal pathways. When several “threads” or chains of events and developments converge, possibility can develop into likelihood. You have to be a “fox” (rather than a hedgehog) to do this effectively – being open to diverse perspectives on what drives people and how things happen.
    6. Strive to distinguish as many degrees of doubt as the problem permits but no more. Another precept that could be cast as a truism, but the reference is to an interesting discussion in the book about how the IC now brings quantitative probability estimates to the table, when developments – such as where Osama bin Laden lives – come under discussion.
    7. Strike the right balance between under- and overconfidence, between prudence and decisiveness. I really don’t see the particular value of this guideline, except to focus on whether you are being overconfident or indecisive. Give it some thought?
    8. Look for the errors behind your mistakes but beware of rearview-mirror hindsight biases. I had an intellectual mentor who served in the Marines and who was fond of saying, “we are always fighting the last war.” In this regard, I’m fond of the saying, “the only certain thing about the future is that there will be surprises.”
    9. Bring out the best in others and let others bring out the best in you. Tetlock’s following sentence is more to the point – “master the fine art of team management.”
  • Master the error-balancing cycle. Good to think about managing this, too.

Puckishly, Tetlocks adds an 11th Commandment – don’t treat commandments as commandments.

Great topic – forecasting subjective geopolitical developments in teams. Superforecasting touches on some fairly subtle points, illustrated with examples. I think it is well worth having on the bookshelf.

There are some corkers, too, like when Tetlock’s highlights the recommendations of 2nd Century physician to Roman emperors Galen, the medical authority for more than 1000 years.

Galen once wrote, apparently,

“All who drink of this treatment recover in a short time, except those whom it does not help, who all die…It is obvious, therefore, that it fails only in incurable cases.”

Economic Outlook – July 2015

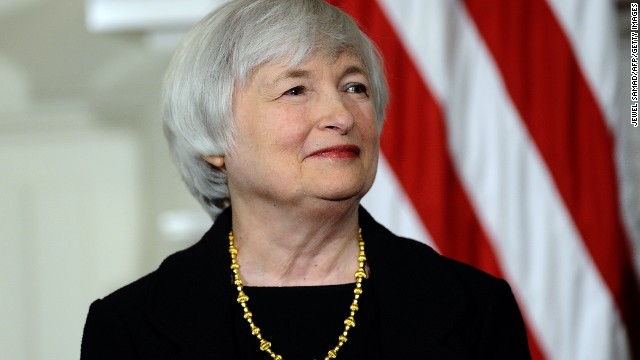
For my money, Janet Yellen’s speech July 10 – parts of which I quote below – is important.

Yellen says the Fed plans the first increase in interest rates this year – in September or December, given Fed meeting schedules.

I believe the fact that we have virtually zero interest rates, and have for some time, creates distortions in economic discussions, not to mention its bizarre effects on the real economy.

On the one hand, the US Federal Reserve must realize that if it does not raise interest rates in this phase of the business cycle, it may be a very long time before we get off the zero lower bound. This creates a tendency to “happy talk” from monetary officials, although not Ms. Yellen specifically, papering over weakness in the US and global economy.

On the other hand, I suspect there are now economic interests invested in continuation of low rates, and their contribution going forward may be to sound the alarm at the slightest sign of economic troubles.

And, truly, this expansion phase of the current business cycle is “growing long in the tooth.” It began, according to the National Bureau of Economic Research, in summer 2009. This makes for 96 months from the previous trough of the business cycle to the current time. Only two previous US business expansions historically are longer than this, and only by one or two years.

The price of (economic) freedom is eternal vigilance. With that in mind, consider some of the datapoints on the current economic outlook.

United States

There is an extensive extract from Ms. Yellen’s speech, assessing US economic conditions, the latest report indicating retail sales softened, and the earlier May 2015 consensus forecast of the Survey of Professional Forecasters, indicating lower economic growth expectations.

Janet Yellen’s Speech at the City Club of Cleveland, Ohio

Let me turn now to where I think the economy is headed over the next several years. The latest estimates show that both real GDP and industrial production actually edged down in the first quarter of this year. Some of this weakness appears to be the result of factors that I expect will be only transitory, such as the unusually harsh winter weather in some regions of the country and the West Coast port labor dispute that briefly restrained international trade and caused disruptions in manufacturing supply chains. Also, statistical noise or measurement issues may have played some role. This is not the first time in recent years that real GDP has been reported to decline, or grow unusually slowly, in the first quarter of the year. There is a healthy debate among economists–many within the Federal Reserve System–about some of the technical factors that may lie behind this pattern.4 Nevertheless, at least a couple of other more persistent factors also likely weighed on economic output and industrial production in the first quarter. In particular, the higher foreign exchange value of the dollar that I mentioned, as well as weak growth in some foreign economies, has restrained the demand for U.S. exports. Moreover, lower crude oil prices have significantly depressed business investment in the domestic energy sector. Indeed, industrial production continued to decline somewhat in April and May. We expect the drag on domestic economic activity from these factors to ease over the course of this year, as the value of the dollar and crude oil prices stabilize, and I anticipate moderate economic growth, on balance, for this year as a whole. As always, however, the economic outlook is uncertain. Notably, although the economic recovery in the euro area appears to have gained a firmer footing, the situation in Greece remains unresolved.
JenetYellen

Looking further ahead, I think that many of the fundamental factors underlying U.S. economic activity are solid and should lead to some pickup in the pace of economic growth in the coming years. In particular, I anticipate that employment will continue to expand and the unemployment rate will decline further.

An improving job market should, in turn, help support a faster pace of household spending growth. Additional jobs and potentially faster wage growth bolster household incomes, and lower energy prices mean consumers have more money to spend on other goods and services. In addition, growing employment and wages should make consumers more comfortable in spending a greater portion of their incomes than they have been in the aftermath of the Great Recession. Moreover, increases in house values and stock market prices, along with reductions in debt in recent years, have pushed up households’ net worth, which also should support more spending. Finally, interest rates faced by borrowers remain low, reflecting the FOMC’s highly accommodative monetary policies. Indeed, recent encouraging data about retail sales and light motor vehicle purchases in the beginning of the second quarter could be an indication that the pace of consumer spending is picking up.

Another positive factor for the outlook is that the drag on economic growth in recent years from changes in federal fiscal policies appears to have waned. Temporary fiscal stimulus measures supported economic output during the recession and early in the recovery, but those stimulus measures have since expired, and additional policy actions were taken to reduce the federal budget deficit. By 2011, these changes in fiscal policies were holding back economic growth. However, the effects of those fiscal policy actions now seem to be mostly behind us.5

There are a couple of factors, however, that I expect could restrain economic growth. First, business owners and managers remain cautious and have not substantially increased their capital expenditures despite the solid fundamentals and brighter prospects for consumer spending. Businesses are holding large amounts of cash on their balance sheets, which may suggest that greater risk aversion is playing a role. Indeed, some economic analysis suggests that uncertainty about the strength of the recovery and about government economic policies could be contributing to the restraint in business investment.6

A second factor that could restrain economic growth regards housing. While national home prices have been rising for a few years and home sales have improved recently, residential construction has remained quite soft. Many households still find it difficult to obtain mortgage credit, but, more generally, the weak job market and slow wage gains in recent years appear to have induced people to double-up on housing. For example, many young adults continue to live with their parents. Population growth is creating a need for more housing, whether to rent or to own, and I do expect that continuing job and wage gains will encourage more people to form new households. Nevertheless, activity in the housing sector seems likely to improve only gradually.

Regarding inflation, as I mentioned earlier, the recent effects of lower prices for crude oil and for imports on overall inflation are expected to wane during this year. Combined with further tightening in labor and product markets, I expect inflation will move toward the FOMC’s 2 percent objective over the next few years. Importantly, a number of different surveys indicate that longer-term inflation expectations have remained stable even as recent readings on inflation have fallen. If inflation expectations had not remained stable, I would be more concerned because consumer and business expectations about inflation can become self-fulfilling.

From the New York Times – To my ears, most of Ms. Yellen’s speech expertly laid out why the economy is not ready for interest rate increases anytime soon. Then, toward the end, she said that based on her views, she expected to begin raising rates “at some point later this year.” That would mean a rate hike in three months, at the Fed’s next meeting in September, or six months hence at its December meeting.

ADVANCE MONTHLY SALES FOR RETAIL AND FOOD SERVICES

The U.S. Census Bureau announced today that advance estimates of U.S. retail and food services sales for June, adjusted for seasonal variation and holiday and trading-day differences, but not for price changes, were $442.0 billion, a decrease of 0.3 percent (±0.5%)* from the previous month, but up 1.4 percent (±0.9%) above June 2014. Total sales for the April 2015 through June 2015 period were up 1.7 percent (±0.7%) from the same period a year ago. The April 2015 to May 2015 percent change was revised from +1.2 percent (±0.5%) to +1.0 percent (±0.3%).

Retail trade sales were down 0.3 percent (±0.5%)* from May 2015, but up 0.6 percent (±0.7%)* above last year. Food services and drinking places were up 7.7 percent (±3.3%) from June 2014 and sporting goods, hobby, books and music were up 6.6 percent (±1.9%) from last year. Gasoline stations were down 17.1% (±1.4%) from the previous year.

Second Quarter 2015 Survey of Professional Forecasters

(Release Date: May 15, 2015) Weaker Outlook for Growth

The outlook for growth in the U.S. economy over the next three years looks weaker now than it did in February, according to 44 forecasters surveyed by the Federal Reserve Bank of Philadelphia. The forecasters predict real GDP will grow at an annual rate of 2.5 percent this quarter and 3.1 percent next quarter. On an annual-average over annual-average basis, real GDP will grow 2.4 percent in 2015, down 0.8 percentage point from the previous estimate. The forecasters predict real GDP will grow 2.8 percent each in 2016 and 2017, and 2.5 percent in 2018.

Global

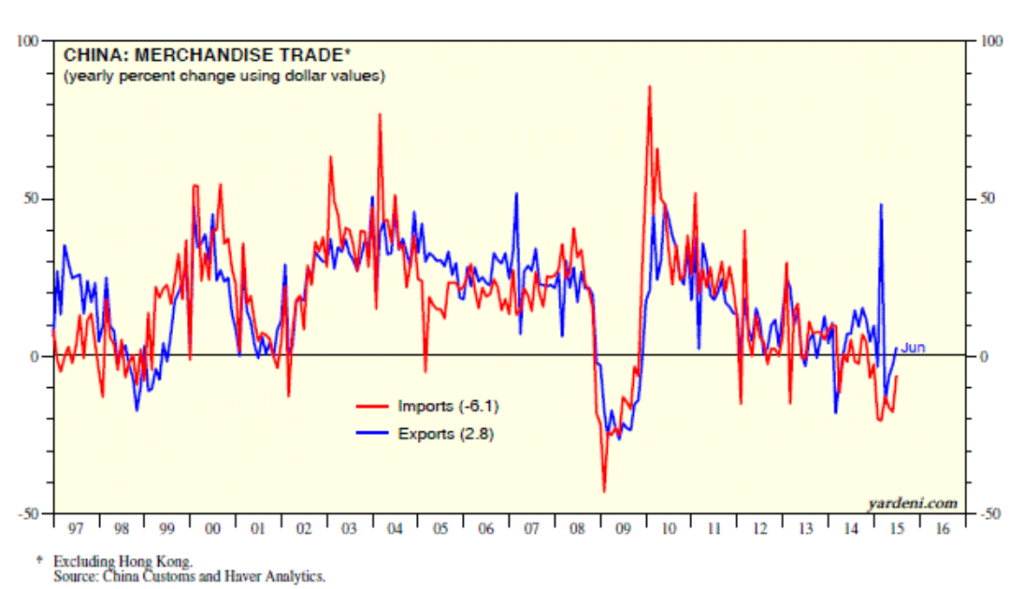
Emerging markets made up some of the slack in the global economy after 2008-2009, but today are everywhere slowing, as the latest revision of the International Monetary Fund (IMF) World Economic Outlook indicates.

IMF July World Economic Outlook – Slower Growth in Emerging Markets, a Gradual Pickup in Advanced Economies

Global growth is projected at 3.3 percent in 2015, marginally lower than in 2014, with a gradual pickup in advanced economies and a slowdown in emerging market and developing economies. In 2016, growth is expected to strengthen to 3.8 percent.

  • A setback to activity in the first quarter of 2015, mostly in North America, has resulted in a small downward revision to global growth for 2015 relative to the April 2015 World Economic Outlook (WEO). Nevertheless, the underlying drivers for a gradual acceleration in economic activity in advanced economies—easy financial conditions, more neutral fiscal policy in the euro area, lower fuel prices, and improving confidence and labor market conditions—remain intact.
  • In emerging market economies, the continued growth slowdown reflects several factors, including lower commodity prices and tighter external financial conditions, structural bottlenecks, rebalancing in China, and economic distress related to geopolitical factors. A rebound in activity in a number of distressed economies is expected to result in a pickup in growth in 2016.
  • The distribution of risks to global economic activity is still tilted to the downside. Near-term risks include increased financial market volatility and disruptive asset price shifts, while lower potential output growth remains an important medium-term risk in both advanced and emerging market economies. Lower commodity prices also pose risks to the outlook in low-income developing economies after many years of strong growth.

Link to Blanchard video

China May Tip World Into Recession: Morgan Stanley

Also there is this interesting chart From Dr. Ed’s Blog
ChinaTrade

Impending Disaster In Greece

My take is that the harsh dealing with Greece led by, apparently, the Germans is more symbolic than directly material to global economic conditions. Nevertheless, it is an ugly symbol, representing, it seems, the end of dreamy thoughts about European integration and the onset of recognition of new German hegemony in Europe.

I am an admirer of modern Germany, having struggled to relearn enough German to read newspapers recently and ask for items in German bakeries. I see the German perspective, but I deeply regret its narrow scope. I think more conservative Germans are missing the big picture here. Of course, the plight of the Greeks is desperate and lamentable.

One final remark – forecasting comes to the fore at junctures such as these. Are we on the cusp, have we started to slide down, or is there still some upside? Compelling questions.

Chinese Stock Market Collapse

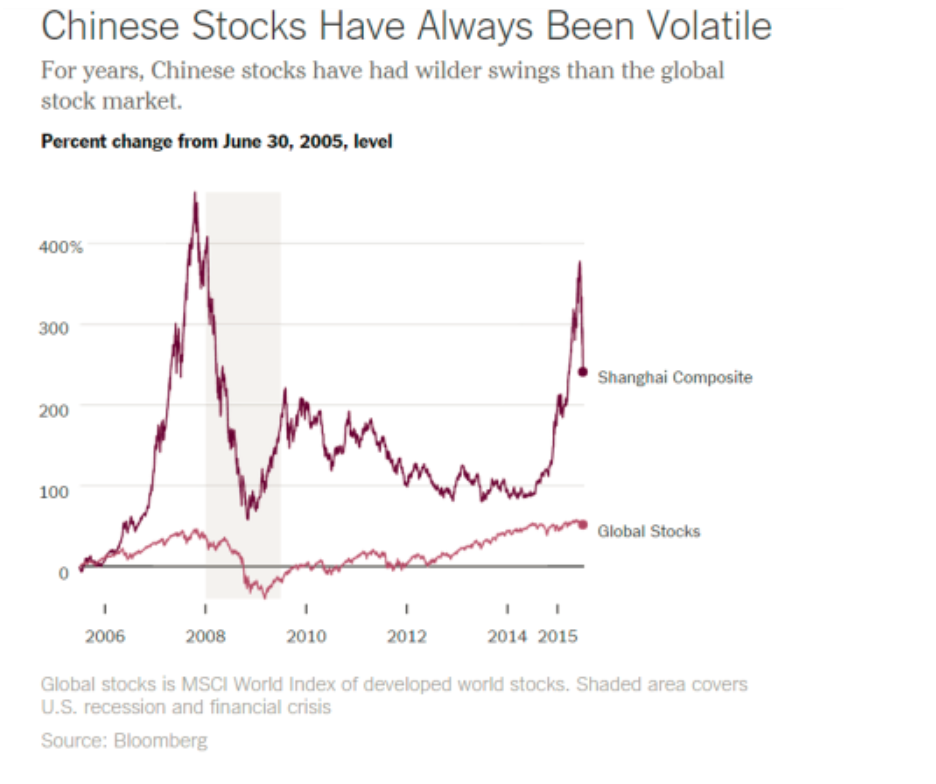
Chinese stocks are more volatile, in terms of percent swings, than stocks on other global markets, as this Bloomberg chart highlights.

ChinaStockVolatileGlobal

So the implication is maybe that the current bursting of the Chinese stock bubble is not such a big deal for the global economy, or perhaps it can be contained – despite signs of correlations between the Global Stocks and Shanghai Composite series.

Facts and Figures

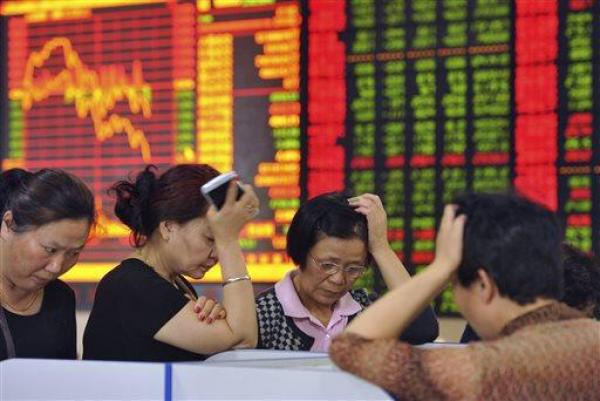
Panic selling hit the major Chinese exchanges in Shanghai and Shenzeng, spreading now to the Hong Kong exchange.

Trades on most companies are limited or frozen, and major indexes continue to drop, despite support from the Chinese government.

Chinese Trading Suspensions Freeze $1.4 Trillion of Shares Amid Rout

The rout in Chinese shares has erased at least $3.2 trillion in value, or twice the size of India’s entire stock market. The Shenzhen Composite Index has led declines with a 38 percent plunge since its June 12 peak, as margin traders unwound bullish bets.

China: The Stock Market Meltdown Continues

Briefly put, there are few alternatives for saving in China. The formal banking system provides negative returns (low deposit yields, lower than inflation typically). Housing is no longer returning positive capital gains — partly as a consequence of deliberate policy actions to moderate a perceived housing bubble. So, what’s left (given you can’t easily save in overseas assets)? Equities. We have a typical boom-bust phenomenon, amplified by underdeveloped financial markets, opacity in valuations, and uncertainty regarding the government’s intentions (and will-power).

Stock Sell-Off Is Unabated in China (New York Times)

Most of the trades on Chinese exchanges are made by “retail traders,” basically individuals speculating on the market. These individuals often are highly leveraged or operating with borrowed money.

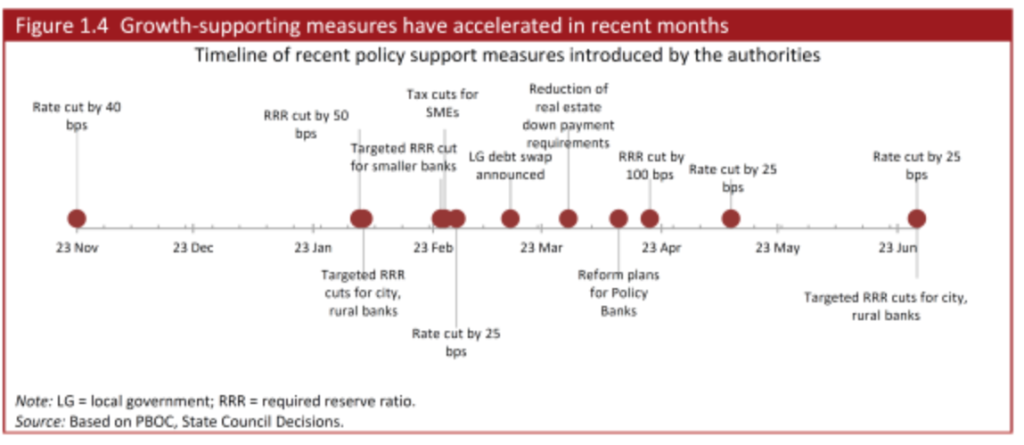
The Chinese markets moved into bubble territory several months back, and when a correction hit and as it accelerated recently, the Chinese government has tried all sorts of stuff, some charted below.

Chinameasures

Public/private funds to buy stocks and slow the fall in their prices have been created, also.

Risks of Contagion

It’s hard for foreign investors to gain access to the Chinese markets, where there are different classes of stocks for Chinese and foreign traders. So, by that light, only a few percent of Chinese stocks are held by foreign interests, and direct linkages between the sharp turn in values in China and elsewhere should be limited.

There may indirect linkages going from the Chinese stock market to the Chinese economy, and then to foreign supplies.

Here’s why the crash in Chinese stocks matters so much to Australia, i.e.  Australian property markets and reduced Chinese demand for iron.

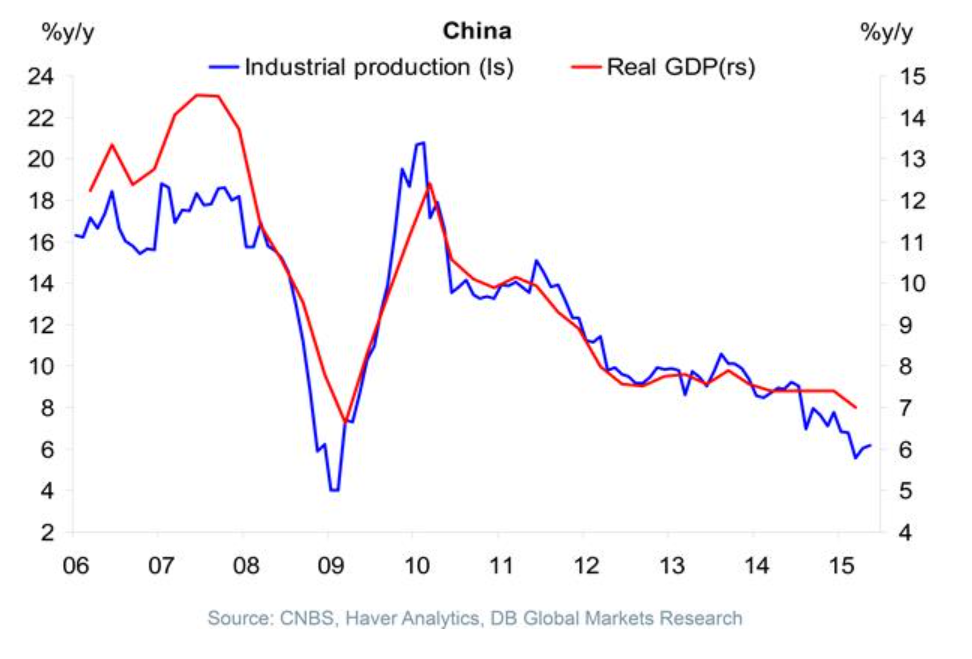
Iron ore demand by China and the drop in Chinese stocks actually seems more related to somewhat independent linkage with the longer term cascade down by Chinese GDP growth, illustrated here (See Ongoing Developments in China).

ChinaGDPgr

But maybe the most dangerous and unpredictable linkage is psychological.

Thus, the Financial Express of India reports Shanghai blues trigger panic selling on Dalal Street, metals feel the heat

Video Friday

Here are some short takes on topics of the day related to the economic outlook for the rest of 2015, nationally and globally.

First a couple of videos on the poor performance of the US economy in the first quarter 2015, when real GDP contracted slightly. This also happened last year, and so there may be a rebound, and, of course, the estimates are released at a significant lag – so we won’t know for a while.

US economy shrank in the first quarter of 2015

U.S. Economy Shrank in First Quarter

Then, a couple of videos on the Chinese stock market crash and condition of the Chinese economy – worrisome since China plays a bigger and bigger role in global business. Bear with the halting English in the first video; there is a payoff in terms of a look from the inside. The second is from a couple of months ago, but is extremely informative vis a vis the big picture.

Stock market of China Falls 16, June 2015

China’s Economy: The Numbers Look Scary

And finally Greece.

Greek crisis in 90 seconds | FT Markets

In closing, I have a comments on technical forecasting issues suggested by the above.

First, “nowcasting” with mixed frequency data should always be applied to these prognostications of what will happen to past economic growth, e.g. the 2nd quarter of 2015. My sense is this is not being done widely, but it’s easy to show its efficacy. There is no reason to drawl on about imponderables, when you can just apply available weekly and monthly data, maybe using MIDAS, to get a better idea of what number we are likely see for the 2nd quarter 2015.

Secondly, I doubt data analytics can provide much light on the situation in China, precisely because there is a lot of evidence the data being announced are suspect. You can go too far in claiming this, but there are warning signs about Chinese data these days. It’s probably comparable to assessing the integrity of Chinese company financials – which see very creative accounting. in certain cases.

As far as Greece goes, I think the outcome is completely unpredictable. Greece is a small economy. If turning Greece away means catastrophic consequences, assistance should be forthcoming, and there are resources available for the size of the problem.  Events, however, may have moved beyond rationality.

The crux of the matter seems to be that there needs to be a way to recirculate funds from the surplus exporters (Germany, largely) to the deficit importers (peripheral Europe).

One proposal is for Germany to create a kind of “New Deal” to invest in the European periphery, so that down the line, their economies can become more balanced and competitive. Another approach, which seems to be that of the Christian Democratic Union (CDU) of Germany, is the neoliberal “solution.” Essentially, force wages and living standards down in debtor countries to the point where they again become globally competitive.

What’s Going On?

Teaching economics during Vietnam and, later, the onset of Reagan – I developed a sort of sideline patter about current events. Later, I realized this bore resemblance to a kind of global system dynamics.

Then, my consulting made these considerations more relevant – to the point that, in recent years, I make correlations between what you might call a global regional analysis and sales prospects, as well as corporate strategy.

How do you go about developing this perspective? The question is especially relevant for me now, since I am emerging from a deep dive into hands-on statistical modeling.

Well, one way to visualize this is as a series of threads through time. Each of these threads is strung with events that can turn out one way or another. There are main threads as believed to be constituted by “serious people.” The conventional view of things, if you will. There also are many outliers, story lines which incorporate unusual, perhaps foreboding developments. I guess you could think of these threads as scenarios, too. A whole bunch of movie scripts about how the future is going to unfold.

Now before getting into specifics, let me make what might be considered an obscure remark, but one relevant to forecasting. What you want to do is disentangle and identify as many of these threads as you have the energy to consider, and then, watch for convergences. If there are several ways, in other words, for some events to become manifested, these events become more likely.

One of the things this methodology accommodates is a fact that it seems to me that many people overlook or downplay. This is that there can be really fundamental differences between how different groups of people, perhaps with different interests or things to gain or lose out of situations, look at things.

One of the clearest examples, perceptually, is the arrow illusion.

arrowillusion

So this is one reason why I try to glean perspectives from all over – including heterodox and contrarian views.

Noone at this point can convince me this is not a good practice, even though it may make those who busy themselves with thought control (“reality construction”) uncomfortable.

For example, many years ago, I was sitting at my father’s breakfast nook glancing at some books he had recently bought, and I found Andrei Amalrik’s Will the Soviet Union Survive Until 1984? What a preposterous idea, it seemed to me. Collapse of the Soviet Union.

It pays to look at heterodox views, even if only a few of these will have any relevance to the future.

Some Specifics

Well, today we have the internet – a font of views of all types.

In thinking about developing this and its successors on the same or similar topics this morning, I first turned to Zero Hedge. From Wikipedia,

Zero Hedge is a financial blog that aggregates news and presents editorial opinions from original and outside sources. It has been described as offering a “deeply conspiratorial, anti-establishment and pessimistic view of the world”… It reports on economics, Wall Street, and the financial sector and is credited with bringing the controversial practice of flash trading to public attention in 2009 via a series of posts alleging that Goldman Sachs’ access to flash order information allowed it to gain unfair profits. The news portion of the site is written by a group of editors who collectively write under the pseudonym “Tyler Durden”, a character from the novel and film Fight Club.

Since I have been out of the loop for a while, the litany of shocking or bad news on this site does not bother me yet.

Some of the headings include:

Iran Forces Seize US Cargo Ship With 34 People On Board, Al Arabiya Reports

West Baltimore In Ashes: A Night Of Violence And Looting In Photos

Stocks Soar On Non-War, Bad-News-Is-Good-News V-Shaped Recovery

Well, I’m not sure what to make of all that. Conflict is increasing. War and riot memes.

Another site I frequently turn to, quite frankly, is Naked Capitalism, and, in particular, Links assembled by “Yves Smith” and others. Today, these range over topics like the Greek-European Union negotiations and the threat of an exit of Greece from the Eurozone, the TPP (trans-Pacific Partnership secret trade bill), Yemen and Syria, and a reference to a new and important report from MIT about the decline in US science spending –The Future Postponed.

I also consult what I would call “libertarian” financial blogs such as Mish Shedlock’s Global Economic Trend Analysis.

Then, I guess, after surveying these “oppositional views,” I turn to official forecasts and publications of US and European banks and financial institutions, as well as central banks.

I’ve given play to JP Morgan forecasters here, as well as Bloomberg’s list of leading macroeconomic forecasters.  It is always good to try to keep tabs on the latest sayings of these celebrity forecasters.

The Bank of England Financial Stability Report, most recently issued December 2014, is a relevant publication.

I also tend to look at, but basically discount, sources such as the Survey of Professional Forecasters, assembled by the Philadelphia Federal Reserve Bank. The record of macroeconomic forecasting is truly abysmal. But, apart from turning points, there may be value in tracking the projected movement of indicators and their trends.

The Central Issue

I have not mentioned slowing of the Chinese economy in the above discussion or several other megatrends, but let me move on to a key pivot for the next few years.

Business expansions never last forever. The current expansion, perhaps because it began so slowly, has sustained for a relatively long time already.

Another key point is that many central banks have pushed interest rates to near the zero bound, and they remain historically very low.

Frankly, it challenges my capabilities to imagine a future in which interest rates sort of disappear as key economic factors – although this may be a thread we need to consider. The attack on cash and movement to purely electronic money could be part of this, with negative interest rates entering the picture in a real way.

But assuming that does not happen, central banks will have to encourage higher interest rates, and that will have wide-ranging effects on business, it seems certain. There are many tangible forecasting problems associated with this prospective development.

I have to believe this is the central issue at present. How can the US Federal Reserve, for example, move off the zero bound for the federal funds rate, when the US economic recovery should, according to historical patterns, be moving toward its final months or years?

There are other tough issues – in the Middle East, the Ukraine, climate change, and so forth – but, as an economic or business forecaster, I have to believe this tension between normal banking practice and the business cycle is fundamental.

In any case, I want to return to putting up business forecasts, including longer term scenarios, in addition to carrying forth with my stock market forecasting experiment.

Future Scenarios

An item from ETF Daily News caught my eye. It’s a post from Tyler Durden Lord Rothschild Warns Investors: Geopolitical Situation Most Dangerous Since WWII.

Lord Rothschild is concerned about the growing military conflict in eastern Europe and the mid-east, deflation and economic challenge in Europe, stock market prices moving above valuations, zero interest rates, and other risk prospects.

Durden has access to some advisory document associated with Rothschild which features two interesting exhibits.

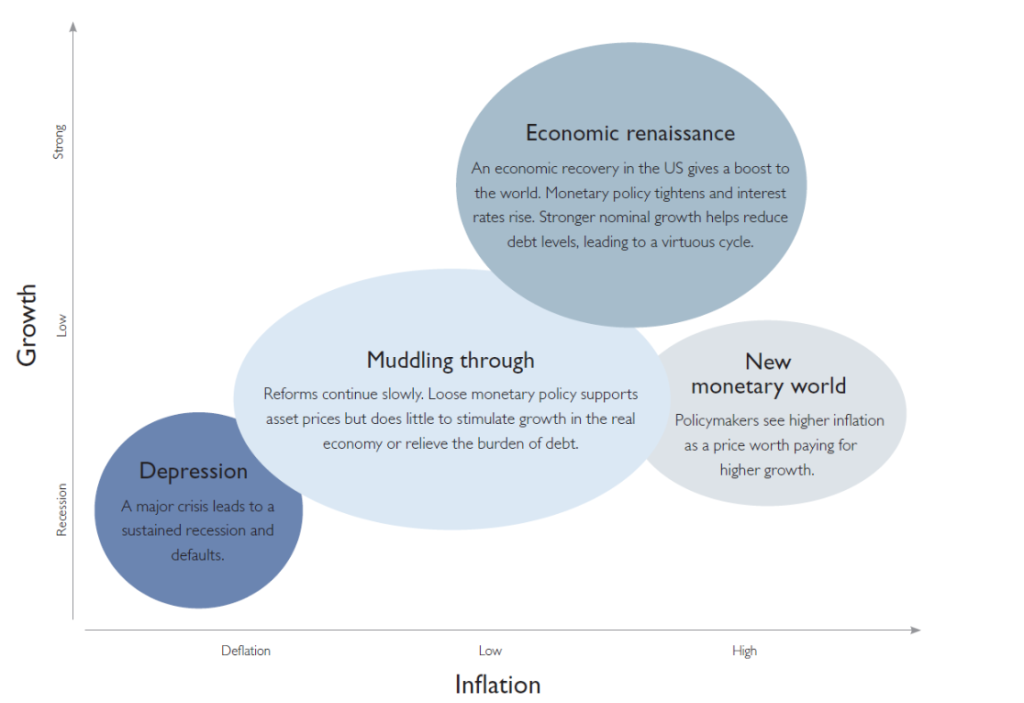
There is this interesting graphic highlighting four scenarios for the future.

R2

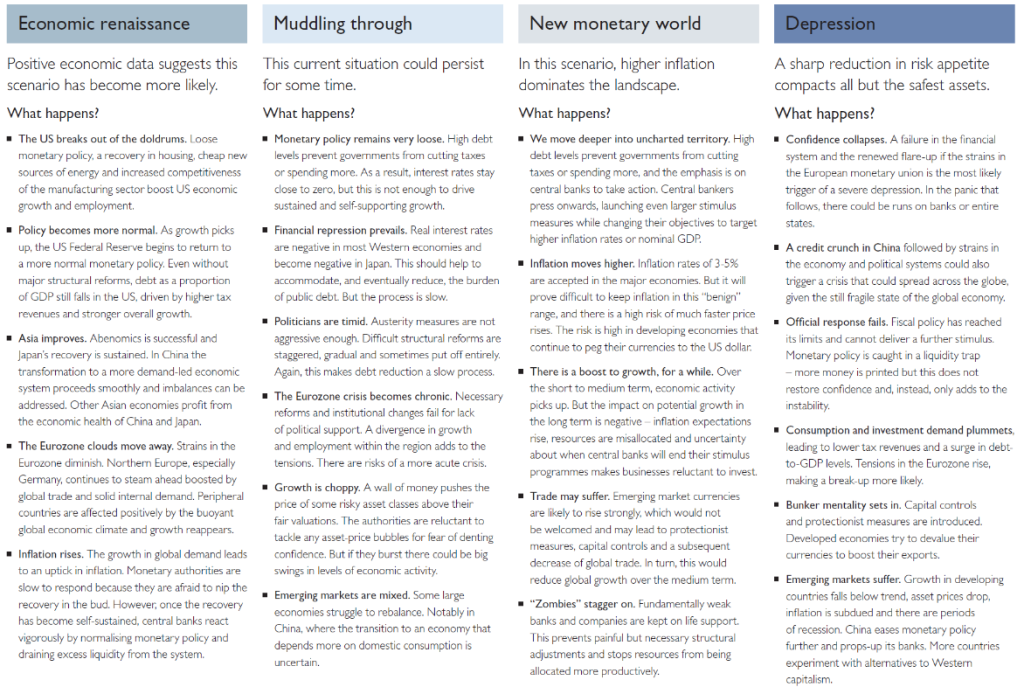
And there are details, as follows, for each scenario (click to enlarge).

RSheet

If I am not mistaken, these exhibits originate from last year at this time.

Think of them then as forecasts, and what has actually happened since they were released, as the actual trajectory of events.

For example, we have been in the “Muddling through” scenario. Monetary policy has remained “very loose,” and real interest rates have remained negative. We have even seen negative nominal interest rates being explored by, for example, the European Central Bank (ECB) – charging banks for maintaining excess reserves, rather than putting them into circulation. Emerging markets certainly are mixed, with confusing signals coming out of China. Growth has been choppy – witness quarterly GDP growth in the US recently – weak and then strong. And one could argue that stagnation has become more or less endemic in Europe with signs of real deflation.

It is useful to decode “structural reform” in the above exhibit. I believe this refers to eliminating protections and rules governing labor, I suppose, to follow a policy of general wage reduction in the idea that European production then could again become competitive with China.

One thing is clear to me pertaining to these scenarios. Infrastructure investment at virtually zero interest rates is no brainer in this economic context, especially for Europe. Also, there is quite a bit of infrastructure investment which can be justified as a response to, say, rising sea levels or other climate change prospects.

This looks to be on track to becoming a very challenging time. The uproar over Iranian nuclear ambitions is probably a sideshow compared to the emerging conflict between nuclear powers shaping up in the Ukraine. A fragile government in Pakistan, also, it must be remembered, has nuclear capability. For more on the growing nuclear threat, see the recent Economist article cited in Business Insider.

In terms of forecasting, the type of scenario formulation we see Rothschild doing is going to become a mainstay of our outlook for 2015-16. There are many balls in the air.

More on the Price of Oil

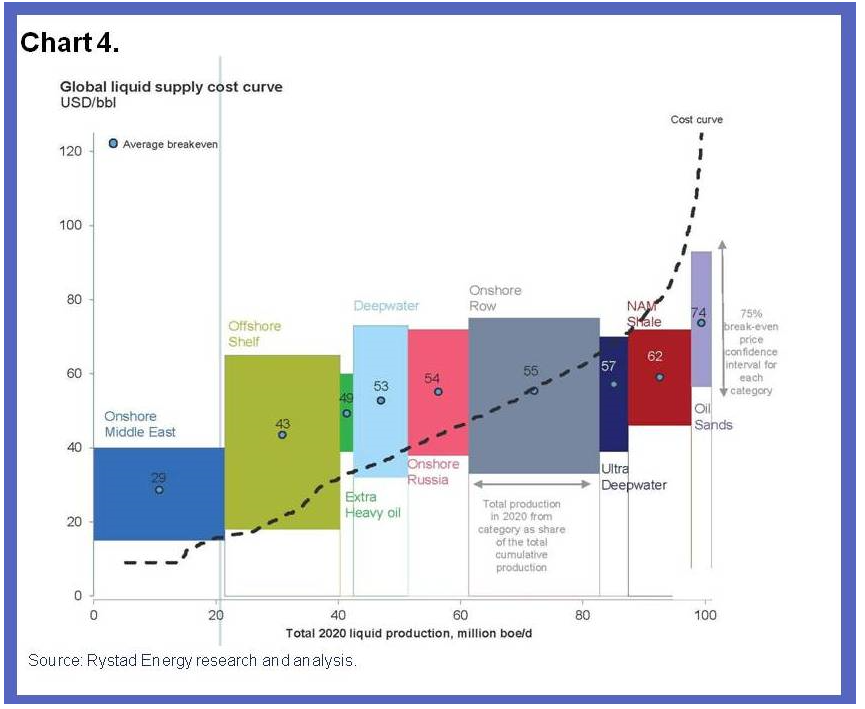
James Hamilton firms up the role for demand factors behind the free fall in oil prices in Supply, demand and the price of oil. This Econbrowser post also features a great chart for the global supply curve for crude oil – highlighting the geographic spread of oil production costs.

LongRunOilSupplyCurve

Hamilton notes (a) the International Energy Agency current estimate of world oil demand growth for 2014:Q3 is 800,000 barrels/day below what the IEA projected as of last June, (b) continuing improvements in the fuel economy of new cars sold in the US, (c) aging populations in the US drive less, and (d) US labor force participation is on a longer trend downward, and, again, unemployed persons drive less.

At the same time, US shale oil production materially contributes to the global oil glut at present.

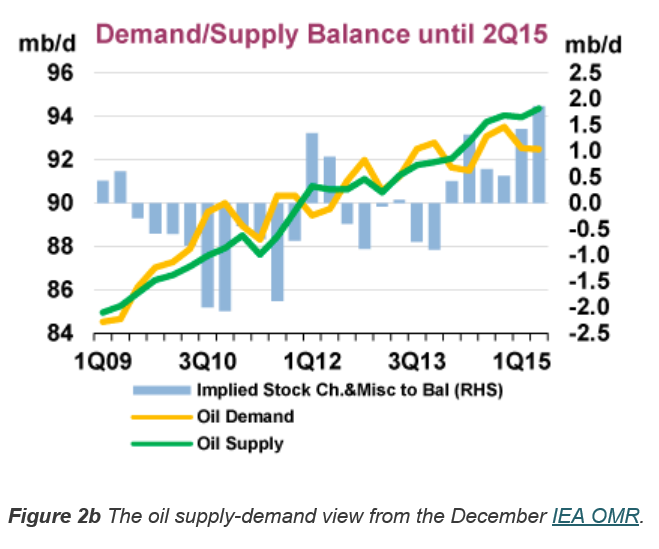
IEA demand and supply projections are contained in the Oil Market Report – which features this interesting graphic.

OMR

Note the large gap between demand (yellow line) and supply (green line) in early 2015 of about 2 million barrels per day (mb/d).

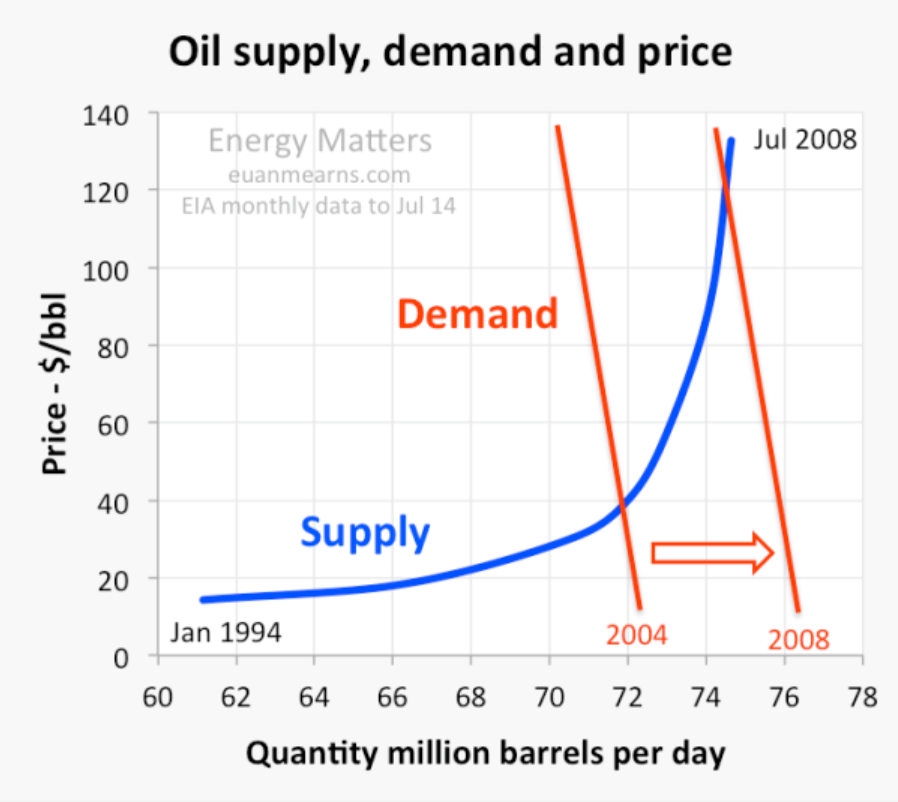
In a piece for OilPrice.com Euan Means does up a lot of supply-demand charts, such as the one below, in Oil Price Scenarios For 2015 And 2016.

SDOil

One point seems to jump out from these discussions.

This is that the supply curve for oil rises steeply at a certain point – as is validated from the geographic production cost curve presented initially in this post.

This means demand does not have to change very much to result in big changes in price, and that peak oil is probably still a relevant concept, despite the current glut of supply on the market.

Wither the Price of Oil?

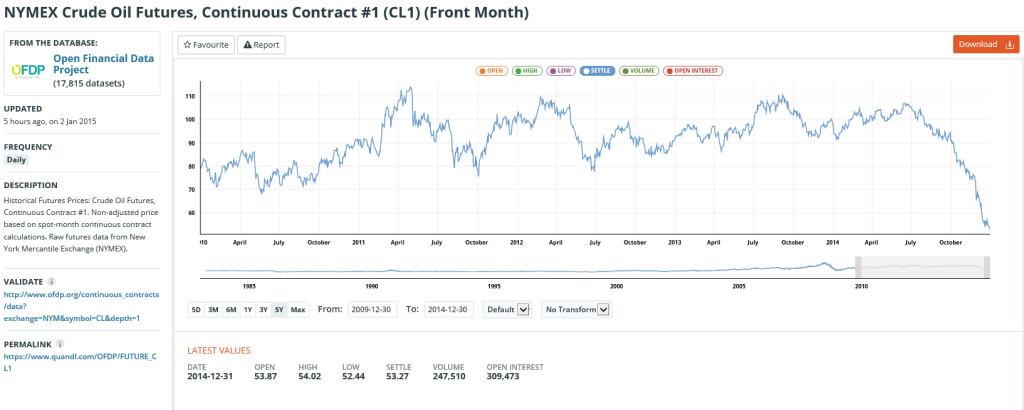
Crude oil futures continue their descent, as the chart below from January 2, 2015 shows.

oilfuturesJan215

What is going to happen here?

Discussions organize around several issues, pretty well nailed recently by IMF bloggers (including Chief Economist Oliver Blanchard) in Seven Questions About The Recent Oil Price Slump.

  1. What are the respective roles of demand and supply factors?
  2. How persistent is this supply shift likely to be?
  3. What are the effects likely to be on the global economy?
  4. What are likely to be the effects on oil importers?
  5. What are likely to be the effects on oil exporters?
  6. What are the financial implications?
  7. What should be the policy response of oil importers and exporters?

The first point to note is the drop in oil prices involves both supply and demand – and is not just the result of increased pumping by Saudi Arabia.

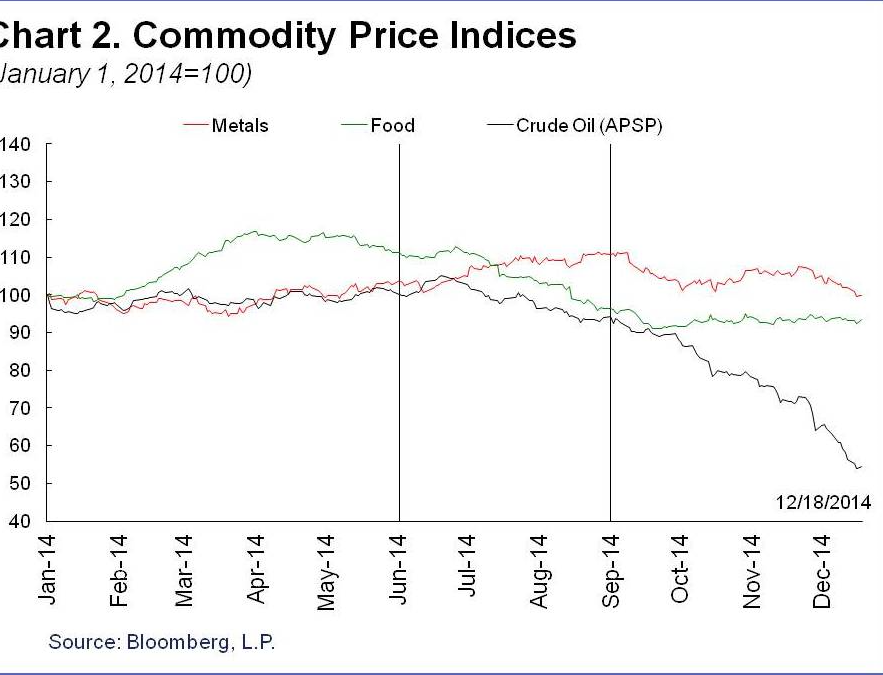
The IMF discussion includes this interesting comparison between oil and other commodity price indices.

commoditypriceindeices

So over 2014, there have been drops in other commodity prices – probably due to weakened global demand – but not nearly much as oil.

Overall, the IMF counts lower oil prices as a net positive to the global economy, resulting in a gain for world GDP between 0.3 and 0.7 percent in 2015, compared to a scenario without the drop in oil prices.

There are big losers, of course. These include oil exporters with higher production costs, such as Russia, Iran, and Venezuela.

To take some examples, energy accounts for 25 percent of Russia’s GDP, 70 percent of its exports, and 50 percent of federal revenues. In the Middle East, the share of oil in federal government revenue is 22.5 percent of GDP and 63.6 percent of exports for the Gulf Cooperation Council countries. In Africa, oil exports accounts for 40-50 percent of GDP for Gabon, Angola and the Republic of Congo, and 80 percent of GDP for Equatorial Guinea. Oil also accounts for 75 percent of government revenues in Angola, Republic of Congo and Equatorial Guinea. In Latin America, oil contributes respectively about 30 percent and 46.6 percent to public sector revenues, and about 55 percent and 94 percent of exports for Ecuador and Venezuela.[8] This shows the dimension of the challenge facing these countries.

How long the Saudi’s can hold the line, maintaining higher production? Is it true, for example, that Saudi Arabia has a $750bn war chest of foreign currency reserves that will be burned through quickly by propping up the shortfall in export revenues? There are speculations that the health of King Abdullah, a strong supporter of the current Saudi Oil Minister, could come into play in coming months.

Interestingly, low oil prices maintained long enough could be self-correcting. This is probably the bet the Saudi’s are making – that their policy can eventually trigger faster growth and enable them to maintain or increase their market share.

As I’ve said before, I think it’s a game changer. The trick is to figure out the linkages and connections, backwards and forwards along the supply chains.

Image of King Abdullah from Telegraph.

The Gift of Low Oil Prices

Oil May Drop top $20 a Barrel

At the end of last week, Anatole Kaletsky wrote an insightful piece for Reuters – The reason oil could drop as low as $20 per barrel.

Kaletsky writes,

There are several reasons to expect a new trading range as low as $20 to $50, as in the period from 1986 to 2004. Technological and environmental pressures are reducing long-term oil demand and threatening to turn much of the high-cost oil outside the Middle East into a “stranded asset” similar to the earth’s vast unwanted coal reserves. Additional pressures for low oil prices in the long term include the possible lifting of sanctions on Iran and Russia and the ending of civil wars in Iraq and Libya, which between them would release additional oil reserves bigger than Saudi Arabia’s on to the world markets.

The U.S. shale revolution is perhaps the strongest argument for a return to competitive pricing instead of the OPEC-dominated monopoly regimes of 1974-85 and 2005-14. Although shale oil is relatively costly, production can be turned on and off much more easily – and cheaply – than from conventional oilfields. This means that shale prospectors should now be the “swing producers” in global oil markets instead of the Saudis. In a truly competitive market, the Saudis and other low-cost producers would always be pumping at maximum output, while shale shuts off when demand is weak and ramps up when demand is strong. This competitive logic suggests that marginal costs of U.S. shale oil, generally estimated at $40 to $50, should in the future be a ceiling for global oil prices, not a floor.

As if in validation of this perspective, Sheik Ali al-Naimi, the Saudi Oil Minister, is quoted in an interview at the beginning of this week

“It is not in the interest of Opec producers to cut their production, whatever the price is … Whether it goes down to $20, $40, $50, $60, it is irrelevant.”

Also, Mr Naimi said that if Saudi Arabia reduced its production, “the price will go up and the Russians, the Brazilians, US shale oil producers will take my share”.

Higher Cost Oil Producers Impacted

Estimates of the cost to the Saudi’s for extracting their oil out of the ground seem to be plummeting, along with the spot price of a barrel of crude. The above interview cited by the Financial Times also asserts that Saudi and other Gulf States can extract at $4-$5 a barrel.

That is an order of magnitude less than the production costs of oil from many US shale plays, much of the North Sea oil supplying revenues to Norway and the UK, as well as Russian and Iranian oil.

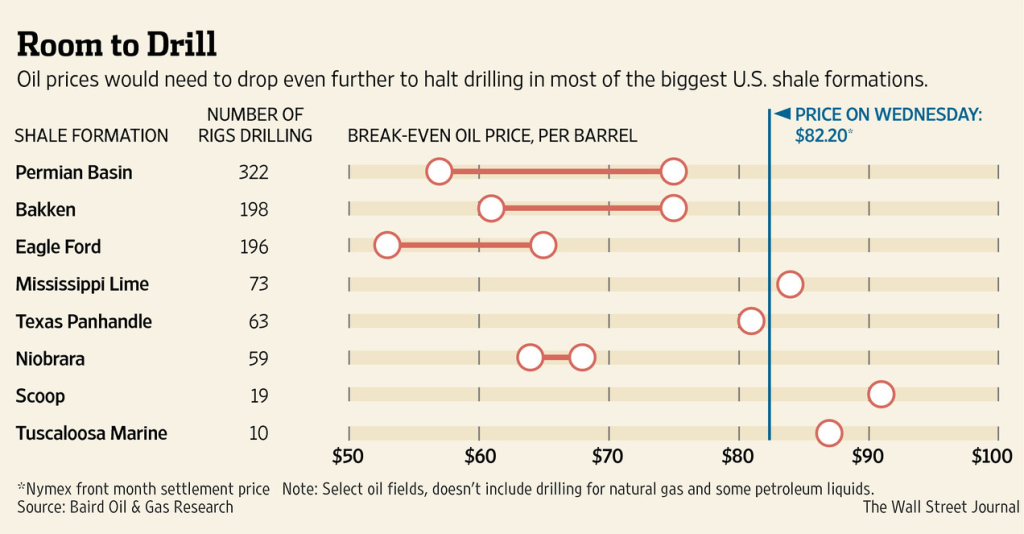
Here is a chart from the Wall Street Journal from late October of this year, estimating production costs in US shale oil plays (click to enlarge).

USSalePC

The rig count has been dropping, but many expect US shale oil production to continue increasing, as companies optimize existing wells and drill as long as already secured futures contracts cover output.

Given the low growth to deflationary profile in the global economy, this probably means a glut of petroleum on world markets for 2015 and, possibly, 2016.

Implications of a Period of Significantly Lower Oil Prices

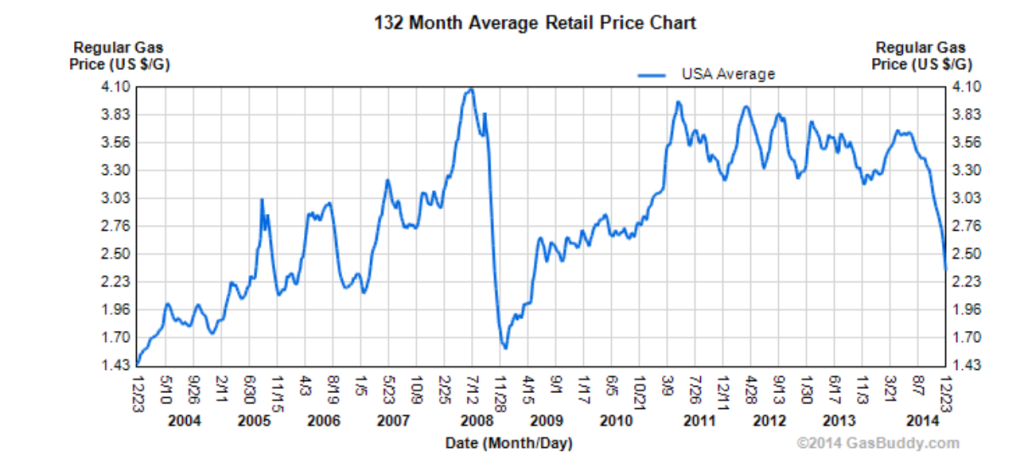
The price of gasoline at the pump in the US is plummeting.

regulargasprice

First-order effects for the American consumer probably more than balance the short-run negative impacts of cutbacks in the oil or shale patch. The typical household gets on the order of $100 extra in their pocket monthly, as long as the low prices continue. This is discretionary money that would have in all likelihood be spent anyway. So other products will benefit, plus people will drive more. It’s as simple as that.

China may be a major beneficiary, since its production is relatively energy-intensive and it is a net importer of petroleum products.

Japan should also benefit significantly.

In Japan, which imports energy (all at prices based on crude oil) worth roughly 6% of GDP, the recent sharp price drop could lift real GDP growth by 1.5%–2%! This would largely offset the 3% hike in VAT imposed last year – or justify the second round 2% hike that was just cancelled. The drop in oil prices may save Abe short term, but it will also put at risk both the 3% inflation goal and the need to turn nuclear facilities back on.

Going Out on a Limb – Business Forecast Blog Prediction

OK, so I’m going out on a limb here and make the following prediction.

As long as there is no banking collapse, as a result of oil companies turning the junk bonds that financed their land purchases into true junk, or the Russian economy collapsing, dragging down the European banking system – all bets are off for a recession in 2015 and probably 2016.

These low oil prices are like a gift to many of the world’s economies, as well as many families reliant on the internal combustion engine to get them to and from work. Low oil prices also should help keep the cost of agricultural products down, again benefitting consumers.

My intuition is that this is a real game changer.

Top graphic from Wall Street Daily

Economic Outlook 2015 – I

Well, it’s that time – end of one calendar year and, soon, the beginning of another, and that means major banks and financial institutions are releasing their big picture “economic outlooks” for 2015.

Here are two well worth watching.

Jan Hatzius of Goldman Sachs provides an interesting, short discussion of the US economic outlook for 2015.

Huw Pills, also of Goldman Sachs, gives a nuanced discussion of Europe’s more vulnerable economic position for 2015.

For other regions, see Outlook 2015.

Barron’s Outlook 2015: Stick With the Bull focuses on stocks and is based on a survey of investment advisors; its outlook is decidedly upbeat.

Born in March 2009, today’s bull market is the fourth longest in history—and it isn’t about to end, despite last week’s shellacking. That’s the word from Wall Street’s top strategists, who expect the Standard & Poor’s 500 stock index to rise 10% in 2015. A gain of that magnitude surely would merit applause, coming atop an 8% rally year to date, not to mention 2013’s 30% advance. Almost six years in, the old bull still seems sprightly….

U.S. stocks are neither cheap nor expensive, based on the market’s current price/earnings ratio of 15.8 times future four-quarter earnings. Few strategists expect the multiple to expand much in the coming year.

“In isolation, U.S. stocks are on the expensive side,” says Jeffrey Knight, head of global asset allocation at Columbia Management. But measured against other financial assets—whether emerging-market equities or developed-market bonds—U.S. shares look strong, he adds.

And, in researching this article, I found Janet Yellen’s Dashboard available from the Brookings Institution website.

A lot of what happens in 2015 has to do with whether, when, and then how much the Fed raises interest rates.

I’m aiming to be as inclusive as I can in putting up these videos of the various celebrity forecasters and their outlook for 2015, so stay tuned.