Category Archives: the LASSO

Some Ways in Which Bayesian Methods Differ From the “Frequentist” Approach

I’ve been doing a deep dive into Bayesian materials, the past few days. I’ve tried this before, but I seem to be making more headway this time.

One question is whether Bayesian methods and statistics informed by the more familiar frequency interpretation of probability can give different answers.

I found this question on CrossValidated, too – Examples of Bayesian and frequentist approach giving different answers.

Among other things, responders cite YouTube videos of John Kruschke – the author of Doing Bayesian Data Analysis A Tutorial With R and BUGS

Here is Kruschke’s “Bayesian Estimation Supercedes the t Test,” which, frankly, I recommend you click on after reading the subsequent comments here.

I guess my concern is not just whether Bayesian and the more familiar frequentist methods give different answers, but, really, whether they give different predictions that can be checked.

I get the sense that Kruschke focuses on the logic and coherence of Bayesian methods in a context where standard statistics may fall short.

But I have found a context where there are clear differences in predictive outcomes between frequentist and Bayesian methods.

This concerns Bayesian versus what you might call classical regression.

In lecture notes for a course on Machine Learning given at Ohio State in 2012, Brian Kulis demonstrates something I had heard mention of two or three years ago, and another result which surprises me big-time.

Let me just state this result directly, then go into some of the mathematical details briefly.

Suppose you have a standard ordinary least squares (OLS) linear regression, which might look like,

linreg

where we can assume the data for y and x are mean centered. Then, as is well, known, assuming the error process ε is N(0,σ) and a few other things, the BLUE (best linear unbiased estimate) of the regression parameters w is –

regressionformulaNow Bayesian methods take advantage of Bayes Theorem, which has a likelihood function and a prior probability on the right hand side of the equation, and the resulting posterior distribution on the left hand side of the equation.

What priors do we use for linear regression in a Bayesian approach?

Well, apparently, there are two options.

First, suppose we adopt priors for the predictors x, and suppose the prior is a normal distribution – that is the predictors are assumed to be normally distributed variables with various means and standard deviations.

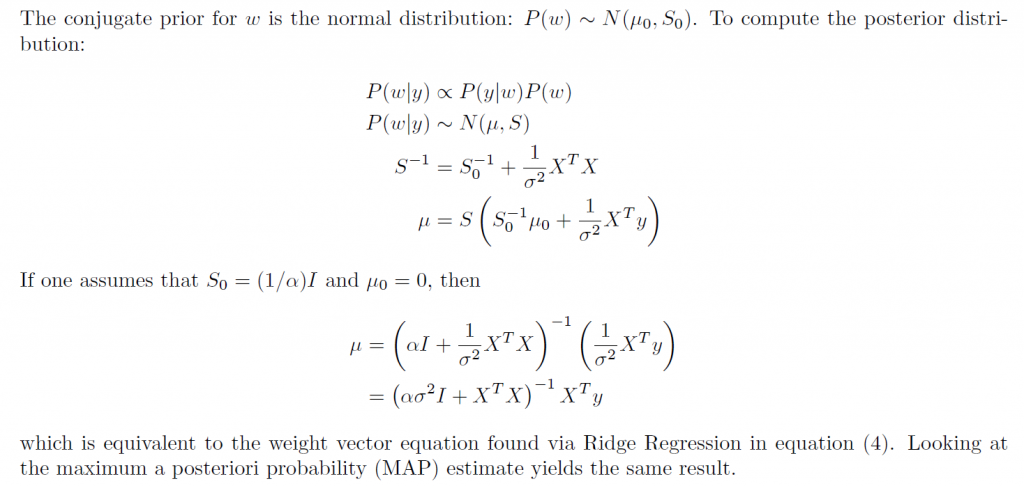
In this case, amazingly, the posterior distribution for a Bayesian setup basically gives the equation for ridge regression.

ridgebayes

On the other hand, assuming a prior which is a Laplace distribution gives a posterior distribution which is equivalent to the lasso.

This is quite stunning, really.

Obviously, then, predictions from an OLS regression, in general, will be different from predictions from a ridge regression estimated on the same data, depending on the value of the tuning parameter λ (See the post here on this).

Similarly with a lasso regression – different forecasts are highly likely.

Now it’s interesting to question which might be more accurate – the standard OLS or the Bayesian formulations. The answer, of course, is that there is a tradeoff between bias and variability effected here. In some situations, ridge regression or the lasso will produce superior forecasts, measured, for example, by root mean square error (RMSE).

This is all pretty wonkish, I realize. But it conclusively shows that there can be significant differences in regression forecasts between the Bayesian and frequentist approaches.

What interests me more, though, is Bayesian methods for forecast combination. I am still working on examples of these procedures. But this is an important area, and there are a number of studies which show gains in forecast accuracy, measured by conventional metrics, for Bayesian model combinations.

Estimation and Variable Selection with Ridge Regression and the LASSO

I’ve posted on ridge regression and the LASSO (Least Absolute Shrinkage and Selection Operator) some weeks back.

Here I want to compare them in connection with variable selection  where there are more predictors than observations (“many predictors”).

1. Ridge regression does not really select variables in the many predictors situation. Rather, ridge regression “shrinks” all predictor coefficient estimates toward zero, based on the size of the tuning parameter λ. When ordinary least squares (OLS) estimates have high variability, ridge regression estimates of the betas may, in fact, produce lower mean square error (MSE) in prediction.

2. The LASSO, on the other hand, handles estimation in the many predictors framework and performs variable selection. Thus, the LASSO can produce sparse, simpler, more interpretable models than ridge regression, although neither dominates in terms of predictive performance. Both ridge regression and the LASSO can outperform OLS regression in some predictive situations – exploiting the tradeoff between variance and bias in the mean square error.

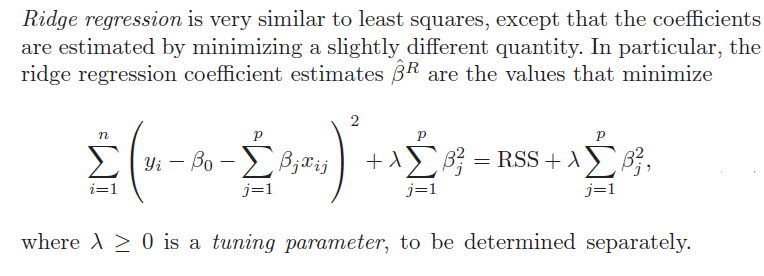
3. Ridge regression and the LASSO both involve penalizing OLS estimates of the betas. How they impose these penalties explains why the LASSO can “zero” out coefficient estimates, while ridge regression just keeps making them smaller. From
An Introduction to Statistical Learning

ridgeregressionOF

Similarly, the objective function for the LASSO procedure is outlined by An Introduction to Statistical Learning, as follows

LASSOobkf

4. Both ridge regression and the LASSO, by imposing a penalty on the regression sum of squares (RWW) shrink the size of the estimated betas. The LASSO, however, can zero out some betas, since it tends to shrink the betas by fixed amounts, as λ increases (up to the zero lower bound). Ridge regression, on the other hand, tends to shrink everything proportionally.

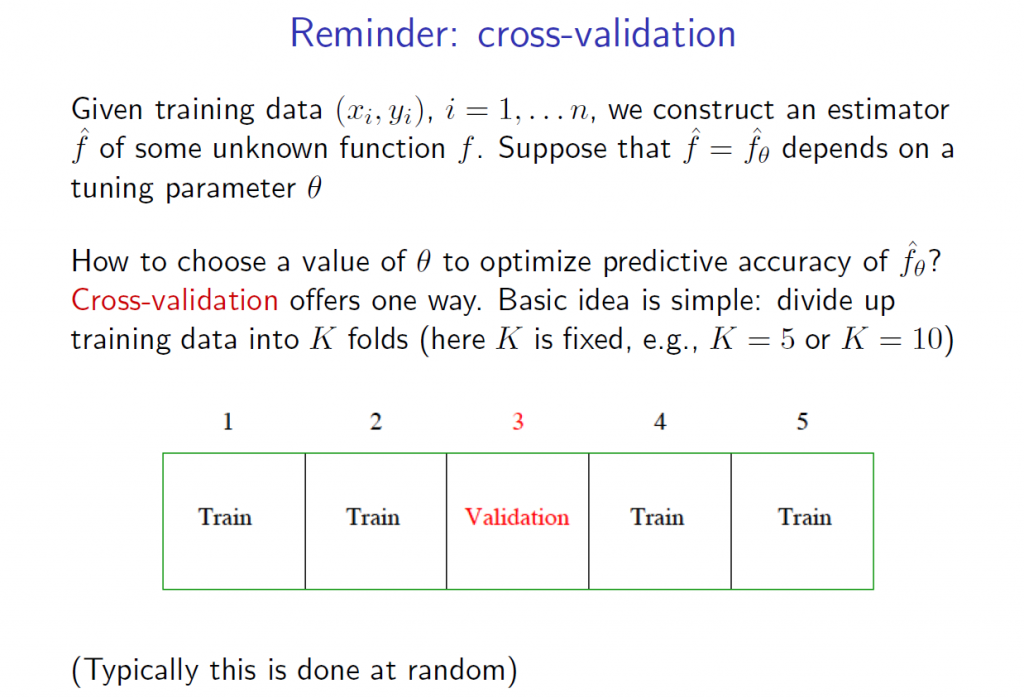
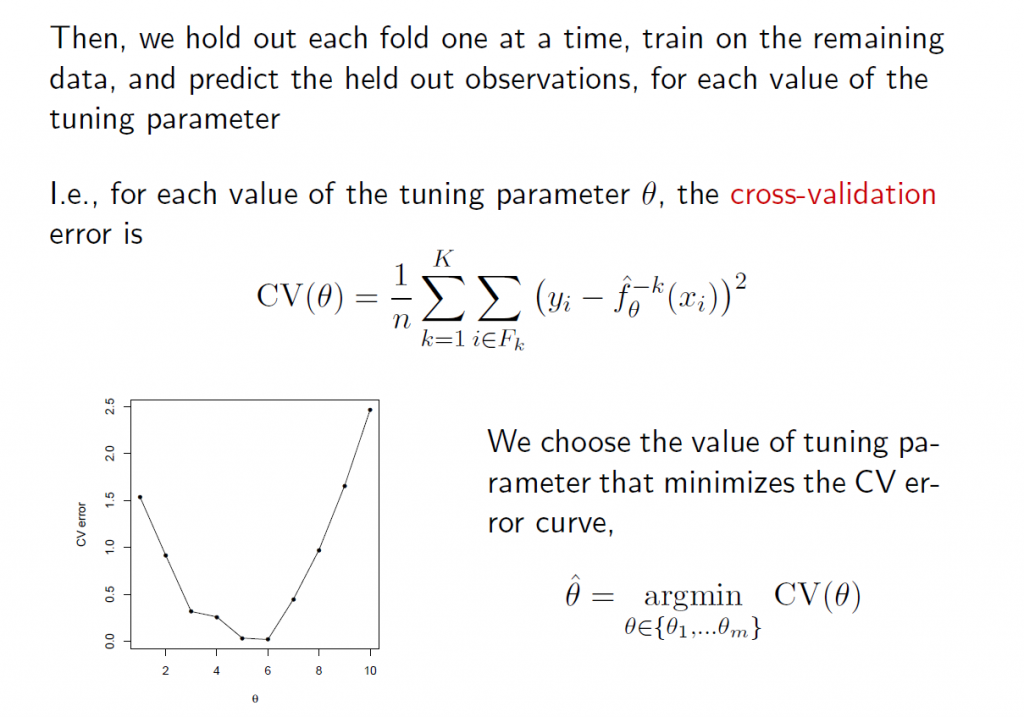
5.The tuning parameter λ in ridge regression and the LASSO usually is determined by cross-validation. Here are a couple of useful slides from Ryan Tibshirani’s Spring 2013 Data Mining course at Carnegie Mellon.

RTCV1

RTCV2

6.There are R programs which estimate ridge regression and lasso models and perform cross validation, recommended by these statisticians from Stanford and Carnegie Mellon. In particular, see glmnet at CRAN. Mathworks MatLab also has routines to do ridge regression and estimate elastic net models.

Here, for example, is R code to estimate the LASSO.

lasso.mod=glmnet(x[train,],y[train],alpha=1,lambda=grid)
plot(lasso.mod)
set.seed(1)
cv.out=cv.glmnet(x[train,],y[train],alpha=1)
plot(cv.out)
bestlam=cv.out$lambda.min
lasso.pred=predict(lasso.mod,s=bestlam,newx=x[test,])
mean((lasso.pred-y.test)^2)
out=glmnet(x,y,alpha=1,lambda=grid)
lasso.coef=predict(out,type=”coefficients”,s=bestlam)[1:20,]
lasso.coef
lasso.coef[lasso.coef!=0]

 What You Get

I’ve estimated quite a number of ridge regression and LASSO models, some with simulated data where you know the answers (see the earlier posts cited initially here) and other models with real data, especially medical or health data.

As a general rule of thumb, An Introduction to Statistical Learning notes,

 ..one might expect the lasso to perform better in a setting where a relatively small number of predictors have substantial coefficients, and the remaining predictors have coefficients that are very small or that equal zero. Ridge regression will perform better when the response is a function of many predictors, all with coefficients of roughly equal size.

The R program glmnet linked above is very flexible, and can accommodate logistic regression, as well as regression with continuous, real-valued dependent variables ranging from negative to positive infinity.


The Tibshirani’s – Statistics and Machine Learning Superstars

As regular readers of this blog know, I’ve migrated to a weekly (or potentially longer) topic focus, and this week’s topic is variable selection.

And the next planned post in the series will compare and contrast ridge regression and the LASSO (least absolute shrinkage and selection operator). There also are some new results for the LASSO. But all this takes time and is always better when actual computations can be accomplished to demonstrate points.

But in researching this, I’ve come to a deeper appreciation of the Tibshiranis.

Robert Tibshirani was an early exponent of the LASSO and has probably, as much as anyone, helped integrate the LASSO into standard statistical procedures.

Here’s his picture from Wikipedia.

RobertTib2

You might ask why put his picuture up, and my answer is that Professor Robert Tibshirani (Stanford) has a son Ryan Tibshirani, whose picture is just below.

Ryan Tibsharani has a great Data Mining course online from Carnegie Mellon, where he is an Assistant Professor.

RyanTib

Professor Ryan Tibshirani’s Spring 2013 a Data Mining course can be found at http://www.stat.cmu.edu/~ryantibs/datamining/

Reviewing Ryan Tibsharani’s slides is very helpful in getting insight into topics like cross validation, ridge regression and the LASSO.

And let us not forget Professor Ryan Tibshirani is author of essential reading about how to pick your target in darts, based on your skill level (hint – don’t go for the triple-20 unless you are good).

Free Books on Machine Learning and Statistics

Robert Tibshirani et al’s text – Elements of Statistical Learning is now in the 10th version and is available online free here.

But the simpler An Introduction to Statistical Leaning is also available for an online download of a PDF file here. This is the corrected 4th printing. The book, which I have been reading today, is really dynamite – an outstanding example of scientific exposition and explanation.

These guys and their collaborators are truly gifted teachers. They create windows into new mathematical and statistical worlds, as it were.

Variable Selection Procedures – The LASSO

The LASSO (Least Absolute Shrinkage and Selection Operator) is a method of automatic variable selection which can be used to select predictors X* of a target variable Y from a larger set of potential or candidate predictors X.

Developed in 1996 by Tibshirani, the LASSO formulates curve fitting as a quadratic programming problem, where the objective function penalizes the absolute size of the regression coefficients, based on the value of a tuning parameter λ. In doing so, the LASSO can drive the coefficients of irrelevant variables to zero, thus performing automatic variable selection.

This post features a toy example illustrating tactics in variable selection with the lasso. The post also dicusses the issue of consistency – how we know from a large sample perspective that we are honing in on the true set of predictors when we apply the LASSO.

My take is a two-step approach is often best. The first step is to use the LASSO to identify a subset of potential predictors which are likely to include the best predictors. Then, implement stepwise regression or other standard variable selection procedures to select the final specification, since there is a presumption that the LASSO “over-selects” (Suggested at the end of On Model Selection Consistency of Lasso).

Toy Example

The LASSO penalizes the absolute size of the regression coefficients, based on the value of a tuning parameter λ. When there are many possible predictors, many of which actually exert zero to little influence on a target variable, the lasso can be especially useful in variable selection.

For example, generate a batch of random variables in a 100 by 15 array – representing 100 observations on 15 potential explanatory variables. Mean-center each column. Then, determine coefficient values for these 15 explanatory variables, allowing several to have zero contribution to the dependent variable. Calculate the value of the dependent variable y for each of these 100 cases, adding in a normally distributed error term.

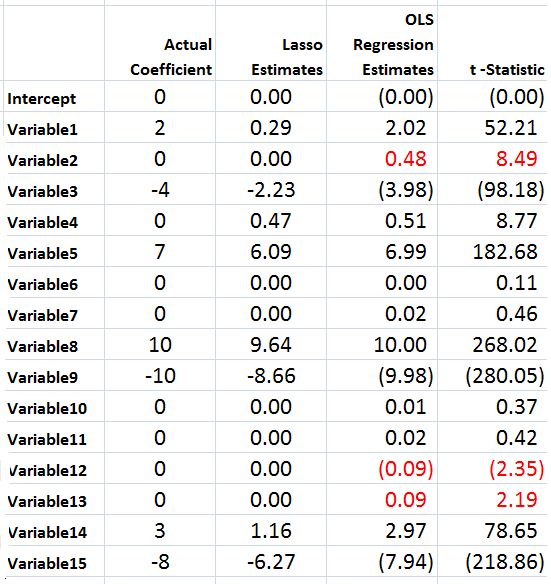
The following Table illustrates something of the power of the lasso.

LassoSS

Using the Matlab lasso procedure and a lambda value of 0.3, seven of the eight zero coefficients are correctly identified. The OLS regression estimate, on the other hand, indicates that three of the zero coefficients are nonzero at a level of 95 percent statistical significance or more (magnitude of the t-statistic > 2).

Of course, the lasso also shrinks the value of the nonzero coefficients. Like ridge regression, then, the lasso introduces bias to parameter estimates, and, indeed, for large enough values of lambda drives all coefficient to zero.

Note OLS can become impossible, when the number of predictors in X* is greater than the number of observations in Y and X. The LASSO, however, has no problem dealing with many predictors.

Real World Examples

For a recent application of the lasso, see the Dallas Federal Reserve occasional paper Hedge Fund Dynamic Market Stability. Note that the lasso is used to identify the key drivers, and other estimation techniques are employed to hone in on the parameter estimates.

For an application of the LASSO to logistic regression in genetics and molecular biology, see Lasso Logistic Regression, GSoft and the Cyclic Coordinate Descent Algorithm, Application to Gene Expression Data. As the title suggests, this illustrates the use of the lasso in logistic regression, frequently utilized in biomedical applications.

Formal Statement of the Problem Solved by the LASSO

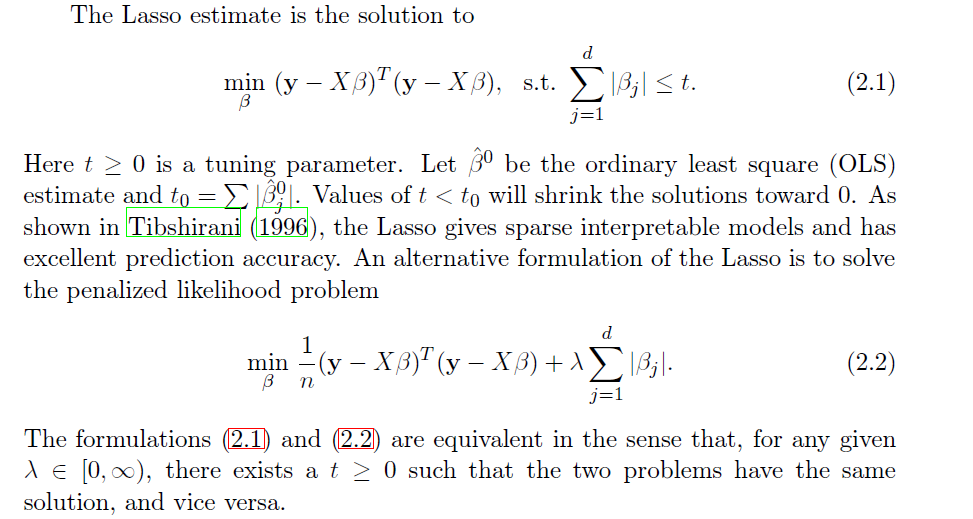
The objective function in the lasso involves minimizing the residual sum of squares, the same entity figuring in ordinary least squares (OLS) regression, subject to a bound on the sum of the absolute value of the coefficients. The following clarifies this in notation, spelling out the objective function.

LassoDerivation

LassoDerivation2

The computation of the lasso solutions is a quadratic programming problem, tackled by standard numerical analysis algorithms. For an analytical discussion of the lasso and other regression shrinkage methods, see the outstanding free textbook The Elements of Statistical Learning by Hastie, Tibshirani, and Friedman.

The Issue of Consistency

The consistency of an estimator or procedure concerns its large sample characteristics. We know the LASSO produces biased parameter estimates, so the relevant consistency is whether the LASSO correctly predicts which variables from a larger set are in fact the predictors.

In other words, when can the LASSO select the “true model?”

Now in the past, this literature is extraordinarily opaque, involving something called the Irrepresentable Condition, which can be glossed as –

almost necessary and sufficient for Lasso to select the true model both in the classical fixed p setting and in the large p setting as the sample size n gets large…This Irrepresentable Condition, which depends mainly on the covariance of the predictor variables, states that Lasso selects the true model consistently if and (almost) only if the predictors that are not in the true model are “irrepresentable” (in a sense to be clarified) by predictors that are in the true model.

Fortunately a ray of light has burst through with Assumptionless Consistency of the Lasso by Chatterjee. Apparently, the LASSO selects the true model almost always – with minimal side assumptions – providing we are satisfied with the prediction error criterion – the mean square prediction error – employed in Tibshirani’s original paper.

Finally, cross-validation is typically used to select the tuning parameter λ, and is another example of this procedure highlighted by Varian’s recent paper.