Category Archives: emerging market forecasts

Global and US Economic Outlook – November 2014

There are a number of free, publically available macroeconomic forecast resources which have standing and a long track record.

Also, investment and other banks make partial releases of their macro projections.

IMF World Economic Outlook

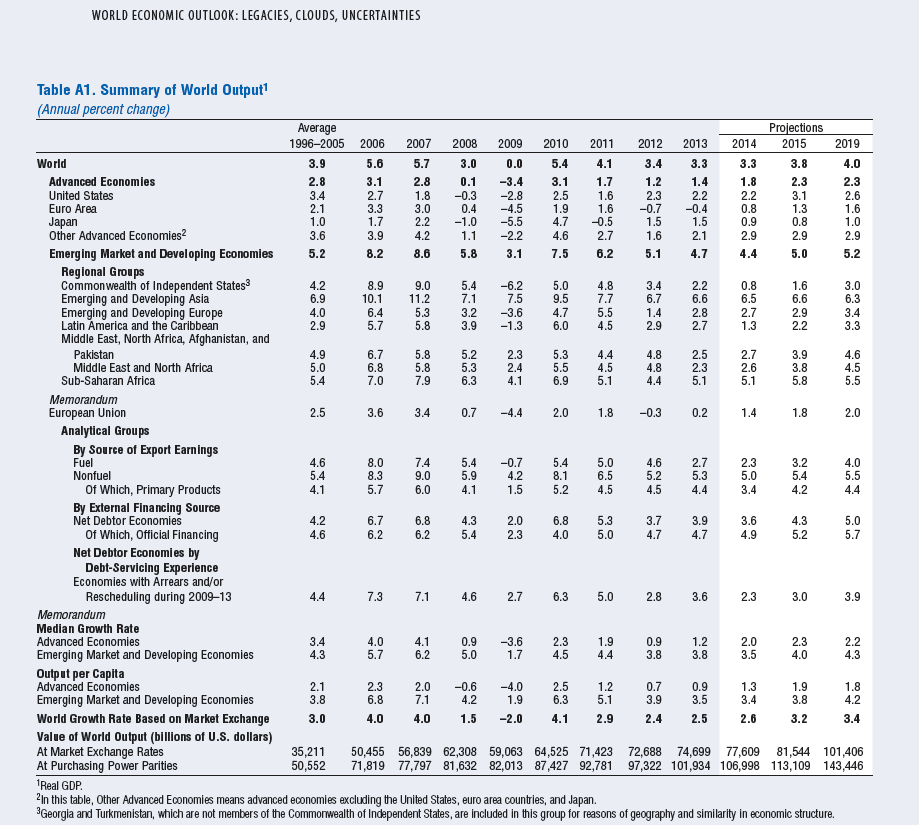
The International Monetary Fund (IMF) revises its World Economic Outlook (WEO) toward the end of each year, this year in October with Legacies, Clouds, Uncertainties.

One advantage is comprehensive coverage. So there are WEO projections over 1, 2 and 3 year horizons for more than 100 countries, even obscure island principalities, and for dozens of variables, including GDP variously measured, inflation, imports and exports, unemployment rate, and population.

Here are highlights of the October revision (click to enlarge).

WEO14

Largely due to weaker-than-expected global activity in the first half of 2014, the growth forecast for the world economy has been revised downward to 3.3 percent for this year, 0.4 percentage point lower than in the April 2014 World Economic Outlook (WEO). The global growth projection for 2015 was lowered to 3.8 percent.

The global recovery continues to be uneven, with some countries and areas struggling, while others move forward into growth.

Downside risks are increasing and include –

SHORT TERM: worsening geopolitical tensions (Ukraine, Syria) and reversal of recent risk spread and volatility compression in financial markets

MEDIUM TERM: stagnation and low potential growth in advanced economies (Eurozone flirting with deflation) and a decline in potential growth in emerging markets

Organization of Economic Cooperation and Development (OECD) Projections

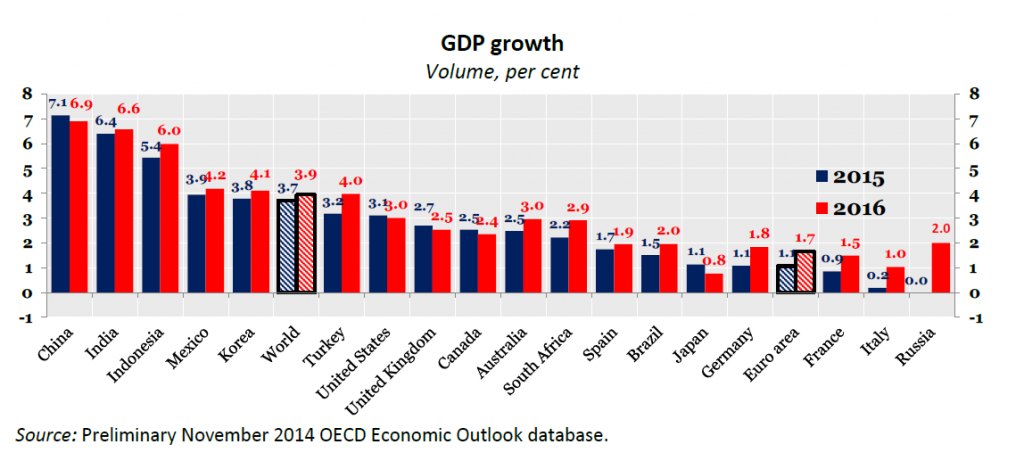
The OECD Economic Outlook Advance Release for the G-20 from October 2014 projects the following growth rates for 2014 and 2015 (click to enlarge).

OECDgraphic

For total global GDP growth, the OECD projects 3.3 percent for 2014 and 3.7 percent for 2015 or 0.1 percent less for 2015 than the IMF.

Chinese economic growth is ratcheting down from double-digit levels several years ago, to around 7 percent, while Indian GDP growth is projected to stay in the 6 percent range.

There are significant differences in the IMF and OECD forecasts for the United States.

Survey of Professional Forecasters

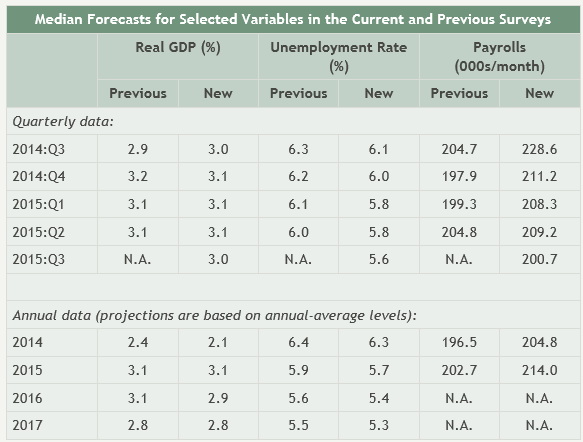
The Survey of Professional Forecasters (SPF) is another publically available set of macroeconomic forecasts, but focusing on the US economy. The SPF is maintained by the Philadelphia Federal Reserve Bank, which polls participating analysts quarterly, compiling consensus results, spreads, and distributions.

The latest SPF Survey was released August 2014, and is somewhat more optimistic about US economic growth than the IMF and OECD projections.

SPF3rdQ14

Investment Bank Data and Projections

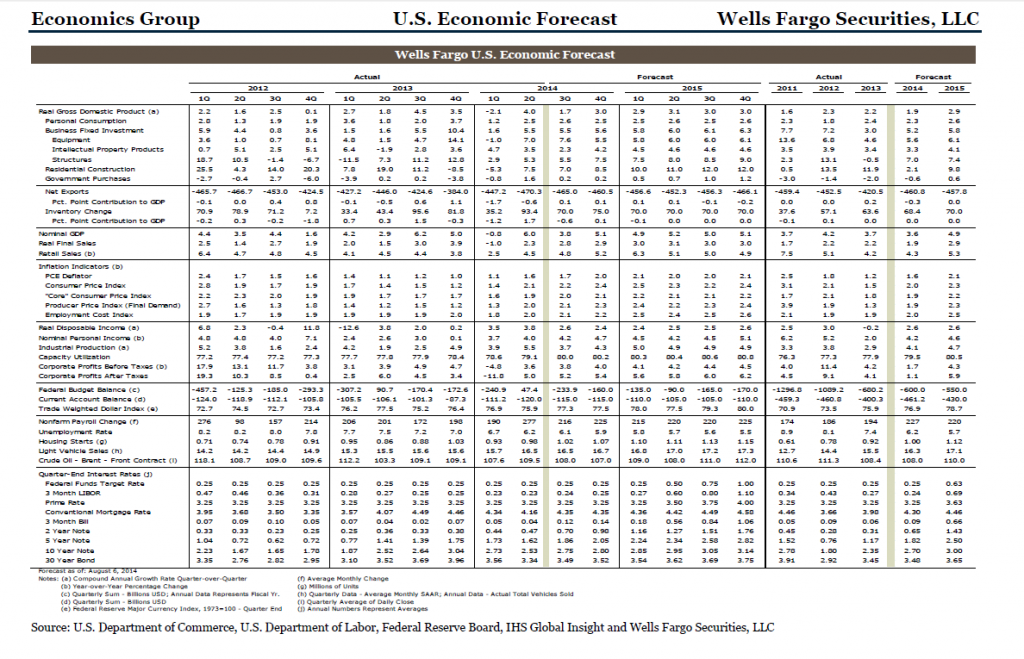
Wells Fargo Securities Economics Group produces a monthly report with detailed quarterly forecasts for the US economy. Here is a sample from August 2014 (click to enlarge).

WFforecast

I’m compiling a list of these products and their availability.

The bottom line is there are plenty of forecasts to average together to gin up high likelihood numbers to plug into sales and other business forecast models.

At the same time, there is a problem with calling turning points in almost all these products.

This is not a problem on YouTube now, though. If you search “economic forecasts 2015” on YouTube today, you will see a lengthly list of predictions of economic collapse and market catastrophe by the likes of Jim Rogers, Gerald Calente, and others who dabble in this genre.

We need something like the canary in the coal mine.

2020 and 2030 – Forecasts and Projections

I’d like to establish a context for discussing longer term forecasts, in this case to 2020 and 2030.

So, just below, I give you my take on 1990-2005. A lot happened that was unanticipated at the beginning of this period. One should expect, I think, the same to be true for 2015-2030.

Along those lines, I also suggest Big Picture factors that may come into play over the next fifteen or so years.

In coming posts, I want to summarize forecasts and projections I have seen for this period.

And I’m a little unusual in the technical forecasting community, since I’m equipped to do matrix programming, discuss boosting and bagging and so forth, and, on the other side of the aisle, weave together these stories and scenarios about process, causes, and factors. The quantitative is usually where I get paid, but, at the same time, I think it is easy to underestimate the benefit of trying to keep track of the Big Picture, the global dynamics, the political economy, and so forth.

1990-2005

The 1990’s rolled out with a nasty little recession in 1991 and voters throwing the first George Bush out of office, in favor of a clarinet-playing former Governor of Arkansas with a penchant for the ladies. Then, the United States experienced the longest period of economic prosperity since the 1960’s, fueled by the tech revolution and rise of the Internet. The breakup of the Soviet Union became official with democratic forms struggling to take root in Russia and former Soviet Republics. The US defense budget was cut about 40 percent from 1980 levels. Deregulation became a theme, and deregulation of telecoms led to burgeoning investments in telecom systems. The end of the decade saw the absurd Y2K problem, where details of computer clocks were supposed to stop everything at midnight, the turn of the century.

The New Millennium saw another recession in 2001, which was particularly sharp for the tech industry. Another Bush took the Presidency, after the Supreme Court intervened in the disputed General Election. Then there was 9/11 – September 11, 2001, with the destruction of the World Trade Center by large airliners being flown into the upper stories. This was a pivotal event. There was immediate surge in the military budget and in US military action in Afghanistan and then the invasion of Iraq, putatively because Saddam Hussein possessed “weapons of mass destruction.”

The US economy pretty much languished after the 2001-2002 recession, being stimulated to an extent by the rise in the defense budget, then by housing activity triggered by continued lowering of interest rates by the US Federal Reserve Bank under the redoubtable Alan Greenspan.

Another development that became especially noticeable after 2000 was the rise of China as a manufacturing and export power. The construction of the Shanghai skyline from the late 1990’s to the middle of the last decade was nothing less than stupendous.

The Importance of Technical Change

So what is important over a span of time? Are there underlying determinants?

I’ve got to believe technical change is an important element in historical process. If we take the fifteen year period sketched above, for example, a lot of the story is driven, at some level, by technical developments, especially in information technology (IT).

My favorite explanation of the collapse of the Soviet Union, for example, includes Silicon Valley as a key driver. The Soviet planned economy was a huge lumbering machine, compared to the nimble, change-oriented shops in the Valley, innovating new computer setups every few months. One immediate consequence was the US fighter aircraft came to totally dominate the old MIG planes, with their electronically guided missiles and tracking systems.

And to go on in this vein, focusing on the rise of US tech and then the movement of production to China is a strategic process for understanding the past couple of decades.

Big Picture Factors

Suffice it to say – new technology will be as much a driver of change in the next fifteen years, as it has been over the past fifteen.

Indeed, according to the futurist Ray Kurzweil, something called The Singularity stalks the human future. Perhaps around 2045, somewhat outside our forecast horizon in this discussion, technology will converge to completely outperform human intelligence. Commentators ranging from Stanislaus Ulam to Kurzweil believe that it is impossible to project human history beyond this point – hence the name.

Conventionally, this will involve biotechnology, computer technology, and robotics – but also could involve nanotechnology.

In any case, hefty doses of new technology may be necessary just to keep on a level course. I’m thinking, for example, of the diminishing effectiveness of antibiotics. So we have the evolution of “superbugs,” as well as the emergence of new epidemics through mutation or disease vectors jumping species lines. Ebola is a particularly gruesome example.

And while on technology, it is fair to observe that complex technologies just at or beyond the boundary of human control present deep challenges. Deep-sea oil drilling and the Gulf of Mexico oil spill, under British Petroleum, and the Fukishima nuclear disaster, still leaking radioactivity into the Pacific, are two examples.

Population or more generally demography is another Big Picture factor. Populations are aging in the United States, Europe, and Japan, but also in China. And global population continues to grow, possibly by another billion by 2030.

Climate change is another Big Picture factor.

The global climate is a complex, dynamic system. There is lots of noise in the discussion and uncertainties, such as whether there may be a cooling interval, as carbon dioxide and methane concentrations continue to rise globally. A number of studies commissioned by US and other intelligence agencies, though, highlight the potential for massive impacts from, say, basic changes in monsoon patterns in South Asia.

In terms of geopolitics, I suspect the shift in the economic center of gravity to somewhere along the Asian rim is another Big Picture development.

There are many relevant metrics. The proportion of global output produced by the United States, according to the World Economic Outlook (WEO) of the International Monetary Fund (IMF), will continue to diminuish, as Chinese growth in the worst case is projected to exceed levels of economic growth in the US and, certainly, in Europe.

Then, there is the issue of the US being the policeman of the world. At some point, the cost of maintaining a global span of military bases and force readiness for multiple theatres of action will weigh heavily on the US – as one could argue is already happening to some degree.

Challenges to the global dominance of the US dollar can be predicted, also, in the next fifteen years.

Sustainability

Whether any of the above “Big Picture” factors actually come into play by 2020 or 2030 is, of course, a speculation. But I think the basic technique of long term forecasting is to inventory possible influences like these. Then, you construct scenarios.

One thing appears certain. And that is there will be surprises.

In looking at forecasts for the next five to fifteen years, I also want to give thought to sustainability. Are there institutions and arrangements which could offer a backup to the various types of instabilities which could emerge?

And there is apparently an increasing chance of an increase in the general level of warfare, perhaps with linking of action in various theatres. I have to say, too, that I am poorly equipped to comment on these conflicts, although, as they ramp up, I attempt to learn more about the players and underlying dynamics.

I’ll be using this venue as a scratch-pad to record the projections of others and some thoughts I might have in response vis a vis 2020 and 2030.

Highlights of National and Global Energy Projections

Christof Rühl – Group Chief Economist at British Petroleum (BP) just released an excellent, short summary of the global energy situation, focused on 2013.

Ruhl

Rühl’s video is currently only available on the BP site at –

http://www.bp.com/en/global/corporate/about-bp/energy-economics/statistical-review-of-world-energy.html

Note the BP Statistical Review of World Energy June 2014 was just released (June 16).

Highlights include –

  • Economic growth is one of the biggest determinants of energy growth. This means that energy growth prospects in Asia and other emerging markets are likely to dominate slower growth in Europe – where demand is actually less now than in 2005 – and the US.
  • Tradeoffs and balancing are a theme of 2013. While oil prices remained above $100/barrel for the third year in a row, seemingly stable, underneath two forces counterbalanced one another – expanding production from shale deposits in the US and an increasing number of supply disruptions in the Middle East and elsewhere.
  • 2013 saw a slowdown in natural gas demand growth with coal the fastest growing fuel. Growth in shale gas is slowing down, partly because of a big price differential between gas and oil.
  • While CO2 emissions continue to increase, the increased role of renewables or non-fossil fuels (including nuclear) have helped hold the line.
  • The success story of the year is that the US is generating new fuels, improving its trade position and trade balance with what Rühl calls the “shale revolution.”

The BP Statistical Reviews of World Energy are widely-cited, and, in my mind, rank alongside the Energy Information Agency (EIA) Annual Energy Outlook and the International Energy Agency’s World Energy Outlook. The EIA’s International Energy Outlook is another frequently-cited document, scheduled for update in July.

Price is the key, but is difficult to predict

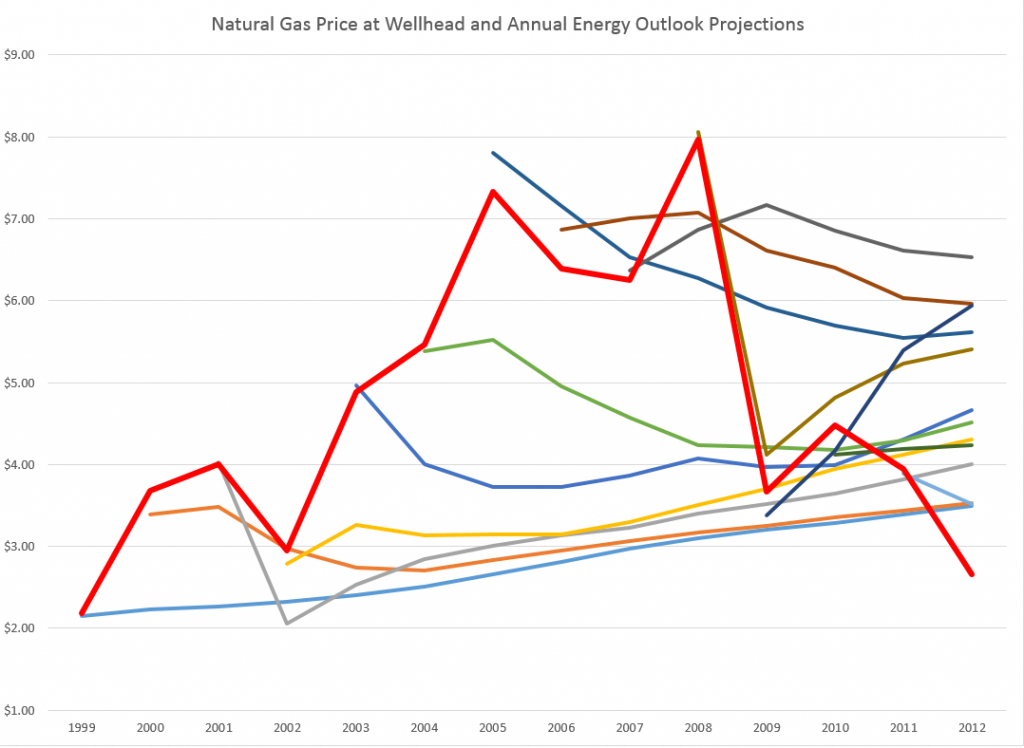
The EIA, to its credit, publishes a retrospective on the accuracy of its forecasts of prices, demand and production volumes. The latest is on a page called Annual Energy Outlook Retrospective Review which has a revealing table showing the EIA projections of the price of natural gas at wellhead and actual figures (as developed from the Monthly Energy Review).

I pulled together a graph showing the actual nominal price at the wellhead and the EIA forecasts.

natgasforecasterrorgraph

The solid red line indicates actual prices. The horizontal axis shows the year for which forecasts are made. The initial value in any forecast series is nowcast, since wellhead prices are available at only a year lag. The most accurate forecasts were for 2008-2009 in the 2009 and 2010 AEO documents, when the impact of the severe recession was already apparent.

Otherwise, the accuracy of the forecasts is completely underwhelming.

Indeed, the EIA presents another revealing chart showing the absolute percentage errors for the past two decades of forecasts. Natural gas prices show up with more than 30 percent errors, as do imported oil prices to US refineries.

Predicting Reserves Without Reference to Prices

Possibly as a result of the difficulty of price projections, the EIA apparently has decoupled the concept of Technically Recoverable Resources (TRR) from price projections.

This helps explain how you can make huge writedowns of TRR in the Monterey Shale without affecting forecasts of future shale oil and gas production.

Thus in Assumptions to AEO2014 and the section called the Oil and Gas Supply Module, we read –

While technically recoverable resources (TRR) is a useful concept, changes in play-level TRR estimates do not necessarily have significant implications for projected oil and natural gas production, which are heavily influenced by economic considerations that do not enter into the estimation of TRR. Importantly, projected oil production from the Monterey play is not a material part of the U.S. oil production outlook in either AEO2013 or AEO2014, and was largely unaffected by the change in TRR estimates between the 2013 and 2014 editions of the AEO. EIA estimates U.S. total crude oil production averaged 8.3 million barrels/day in April 2014. In the AEO2014 Reference case, economically recoverable oil from the Monterey averaged 57,000 barrels/day between 2010 and 2040, and in the AEO2013 the same play’s estimated production averaged 14,000 barrels/day. The difference in production between the AEO2013 and AEO2014 is a result of data updates for currently producing wells which were not previously linked to the Monterey play and include both conventionally-reservoired and continuous-type shale areas of the play. Clearly, there is not a proportional relationship between TRR and production estimates – economics matters, and the Monterey play faces significant economic challenges regardless of the TRR estimate.

This year EIA’s estimate for total proved and unproved U.S. technically recoverable oil resources increased 5.4 billion barrels to 238 billion barrels, even with a reduction of the Monterey/Santos shale play estimate of unproved technically recoverable tight oil resources from 13.7 billion barrels to 0.6 billion barrels. Proved reserves in EIA’s U.S. Crude Oil and Natural Gas Proved Reserves report for the Monterey/Santos shale play are withheld to avoid disclosure of individual company data. However, estimates of proved reserves in NEMS are 0.4 billion barrels, which result in 1 billion barrels of total TRR.

Key factors driving the adjustment included new geology information from a U. S. Geological Survey review of the Monterey shale and a lack of production growth relative to other shale plays like the Bakken and Eagle Ford. Geologically, the thermally mature area is 90% smaller than previously thought and is in a tectonically active area which has created significant natural fractures that have allowed oil to leave the source rock and accumulate in the overlying conventional oil fields, such as Elk Hills, Cat Canyon and Elwood South (offshore). Data also indicate the Monterey play is not over pressured and thus lacks the gas drive found in highly productive tight oil plays like the Bakken and Eagle Ford. The number of wells per square mile was revised down from 16 to 6 to represent horizontal wells instead of vertical wells. TRR estimates will likely continue to evolve over time as technology advances, and as additional geologic information and results from drilling activity provide a basis for further updates.

So the shale oil in the Monterey formation may have “migrated” from that convoluted geologic structure to sand deposits or elsewhere, leaving the productive potential much less.

I still don’t understand how it is possible to estimate any geologic reserve without reference to price, but there you have it.

I plan to move on to more manageable energy aggregates, like utility power loads and time series forecasts of consumption in coming posts.

But the shale oil and gas scene in the US is fascinating and a little scary. Part of the gestalt is the involvement of smaller players – not just BP and Exxon, for example. According to Chad Moutray, Economist for the National Association of Manufacturers, the fracking boom is a major stimulus to manufacturing jobs up and down the supply chain. But the productive life of a fracked oil or gas well is typically shorter than a conventional oil or gas well. So some claim that the increases in US production cannot be sustained or will not lead to any real period of “energy independence.” For my money, I need to watch this more before making that kind of evaluation, but the issue is definitely there.

The Next Recession – Will It Be A Global Meltdown?

One my focuses is the global economy and any cracks in the firmament which might presage the next recession. I rely a lot on my Twitter account to keep me on the crest of the wave, in this regard.

I’m really concerned, as are many of my colleagues and contacts in business and government.

We’ve hardly escaped the effects of last recession 2008-2009. Those are US dates, of course, set by the National Bureau of Economic Research (NBER) the official recession “dater” in this country.

There have been a series of rolling impacts and consequences of this so-called “Great Recession.”

Europe

Housing or real estate bubbles were present in Europe, too, particularly in Spain and Ireland. Then, there was the problem of the Greek economy and state, which did not support the level of public debt that had been garnered by, in some cases, corrupt public officials. And European problems were complicated by the currency union of the euro in a context where there is not, as yet, a centralized EU state. Anyway, not to reprise the whole matter blow-by-blow, but most of Europe, with the exception of Germany, plunged into recession and struggled with austerity policies that made things worse for Main Street or, as they like to say in Britain, “High Street.”

Many European countries are just now coming out of recession, and overall, the growth rate in the EU area is almost indistinguishable from zero.

So another recession in the next one to two years would really set them back.

China

Part of the problem China has been experiencing is related to the persisting downturn in most of Europe, since Europe is a big trading partner. And so, for that matter is the United States, which bought less from China during the recession years.

But another problem is that China now is experiencing a mojo big property bubble of its own.

Newly wealthy Chinese do not really have any place to put their money, except real estate. The Chinese, like the Japanese, are big savers, and for many middle class families, buying the second apartment or even a house is an investment for the future. Yet Chinese real estate prices have skyrocketed, leaving the average Chinese wage earner in the dust, with less and less hope of ever owning a residence.

Apparently, in connection with this real estate speculation, a large shadow banking system has emerged. Some estimates circulate on Twitter suggesting this rivals the size of the official Chinese banking system.

Can “market socialism” or “market Leninism” experience a financial crisis, based on too many debts that cannot be paid?

I’ve been to China a few times, and done some business there – all the while trying to understand how things are set up. My feeling is that one should not impute banking practices that seem pro forma in, say, Great Britain or the US, to the Chinese. I think they are much more ready to “break the rules” in order to keep the party going (which is sort of a pun).

Having said that, I do think a Chinese crisis could develop if property values collapse, as they are wont to do in bubble mode.

Again, it’s hard to say how this might play out, since the victims and suffering would be among the nouveau riche of China, of whom there are millions, and many more average families who have invested their nest egg in a hot property.

But I can’t think that collapse of real estate values in modern China would not have worldwide repurcussions.

The Rest of the World

Regrettably, I cannot go through other major regions, one-by-one, but I’d have to say that things are not so good. The BRIC’s as a group all have more problems than a few years back, when they were hailed as the bright new centers of economic growth by that Goldman Sachs analyst. That’s Brazil, Russia, India, and China, of course.

Possibilities of Increased Conflict

There is a kind of axiom of geopolitics and social interaction that when the pie is growing and everybody can get more, even though their slice may not have been very big to begin with, there is a tendency for people to make do, go about their business and so forth. Reverse this and you have the concept that shrinking the pie – as austerity policies and the Great Recession have done – tends to increase levels of conflict. At first, to the extent that people have the idea that “we are all in this together” there may be increased cooperation. But that is not the current situation in almost any society. Quite the contrary, as Piketty and the Occupy Movement highlight, there is growing awareness of inequality of wealth and income.

There are armed conflicts in Syria, the Ukraine, Afghanistan (resurgent Taliban), and areas and regions in Africa. The Indian elections recently installed a Hindu nationalist who hopefully will be a reformer, but may, if the going gets tough, revert or acquiesce to more conflict with Pakistan and with non-Hindu populations within India. Pakistan, one of the world’s nuclear powers, appears to be extremely unstable politically. There are deep civil divisions in Thailand between city and rural areas that parallel class divisions. China is flexing its muscles in the South China Sea.

And we may be moving from an era of US-centric global capitalism to a time when the Eurasian supercontinent will become significantly more important and perhaps decoupled from Wall Street and the City of London. Already, there are threats to dollar supremacy, and, historically, as US economic power is eclipsed by the more rapidly growing economies of Asia, some adjustment seems predictable.

In all this, Hollywood can be counted on to roll out some really corking new international intrigue films, perhaps (although I doubt it) with more complex plots.

The Situation with the US Federal Reserve Bank

The point of this international survey and reprise of recent business history is to highlight areas where surprises may originate, shaking the markets, and perhaps triggering the next recession.

But the most likely suspect is the US Federal Reserve Bank.

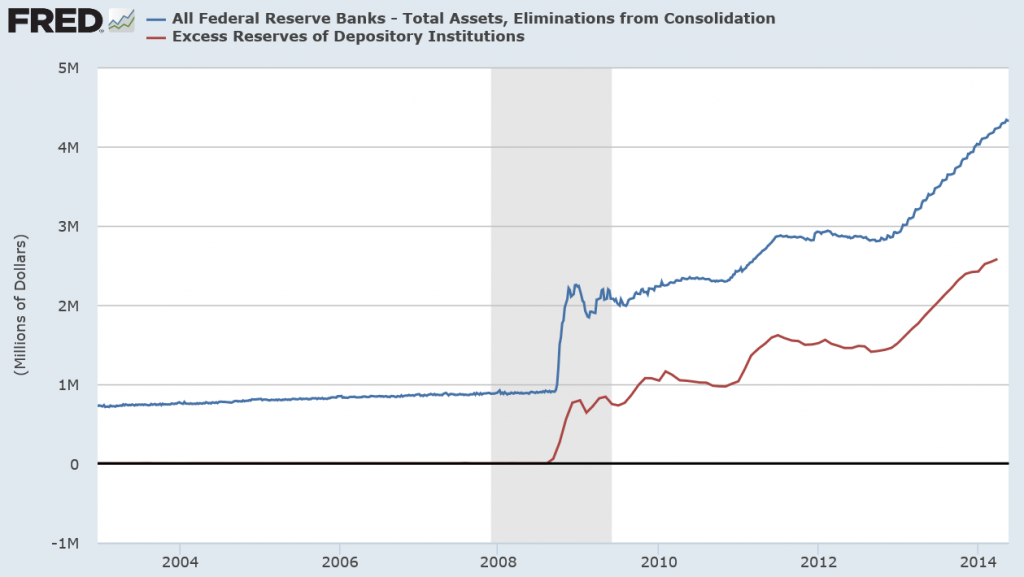
Two graphs speak volumes.
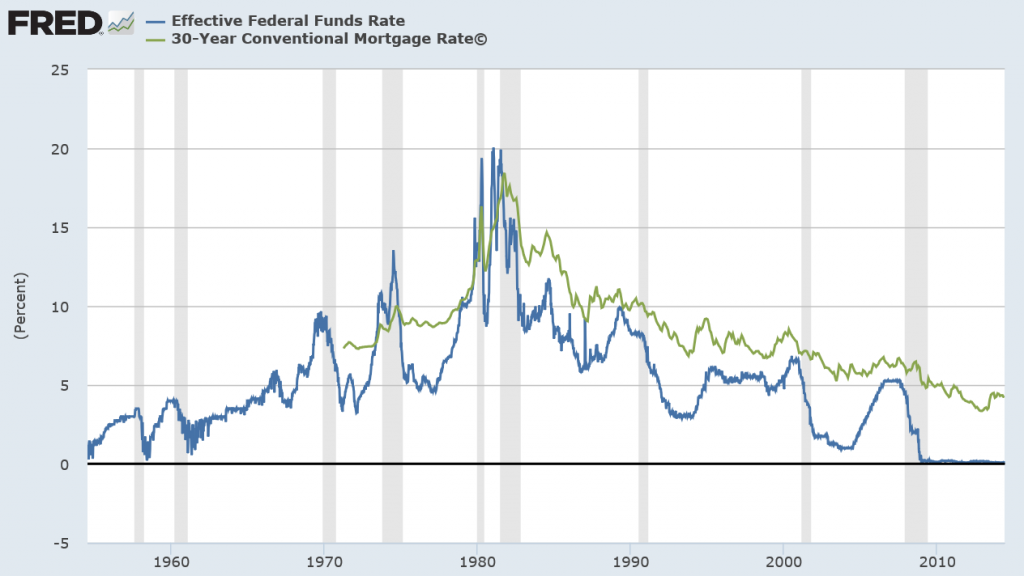
interestratesnew

Fedassets

Seeking to encourage economic recovery, the US Federal Reserve dropped the federal funds rate to a number effectively almost zero – a historically low number. This zero bound federal funds rate has persisted since the end of 2009, or for about five years.

The Fed also has engaged in new policies, whereby it goes into private bond markets and buys long term bonds – primarily mortgage-backed securities. The second chart tracks this inasmuch as a good portion of the more than 4 trillion in Fed assets (for which there are corresponding liabilities, of course) are these mortgage-backed securities. In effect, the Fed has purchased a sizeable portion of the US housing market – one might say “nationalize” except that would be forgetting the fact that the Fed is actually a private institution whose governance is appointed by the Executive Branch of the US government.

In any case, this bond-buying is the famous “quantitative easing” (QE) and is mirrored in the accumulation of excess reserves by the banking system. Generally, that is, banks and financial institutions issue mortgages, sell them among themselves to be packaged in mortgage-backed securities, and the Fed has been buying these.

Banks can easily loan these excess reserves, but they consistently have not. Why is an interesting question beyond the scope of this discussion, but the consequence is that the Fed’s actions are “firewalled” from increasing the rate of inflation, which is what ordinarily you might think would occur given that various metrics of money supply also have surged upward.

Now “Fed-watching” is its own little cottage industry among financial commentators, and I am not going to second-guess the media here. The Fed has announced a plan to “taper” these purchases of long term bonds. This is likely to increase the mortgage rates and, probably to some extent, based on expectations already has.

So, the long and the short of it are that this set of policies – zero federal funds rate and bond buying cannot go on forever.

If economic growth has been low-grade since 2010 with these low interest rates, what is the reasonable outlook for a higher interest rate regime?

Timing of the Next Recession

When is the most likely time for a recession, for example? Would it be later in 2014, in 2015, or thereafter, maybe in 2016.

Here is a table of all the recessions in the US since the middle 1850’s along with facts about their duration (source: NBER).
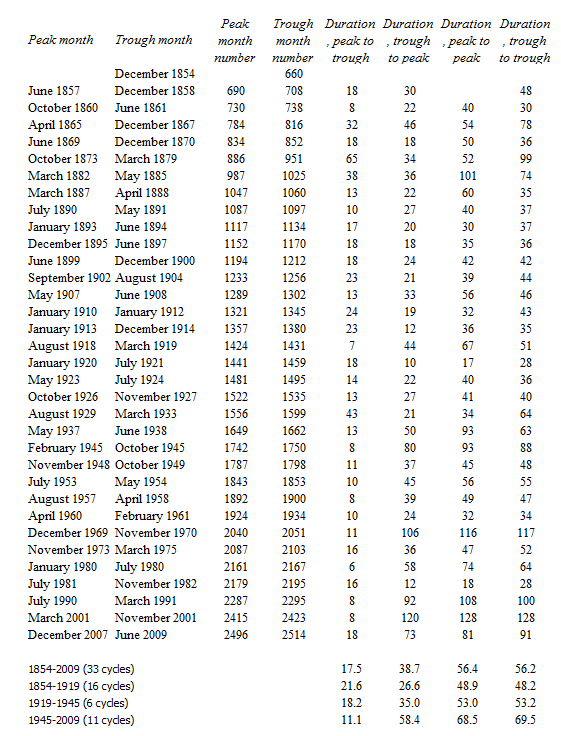
NBERRecess

Without even considering averages, the maximum period of trough to trough – that is, from the bottom of one recession to the bottom of the next – has been 128 months or ten years and eight months. Here, incidentally, the month numbers begin January 1800, for what that’s worth.

Thus, at the outside, based on these empirics, the trough of the next recession is likely to occur no later than early 2020.

Note that we have already blown through the average length from trough to trough of about 58.4 months or about five years from June 2009.

On a simple probabilistic basis, therefore, we are moving into the tail of the distribution of business cycle durations, suggesting that the chances of a downturn are in some sense already above 50 percent.

And note that the experience of the current business recovery is nothing like this historically maximum span in the 1990’s between the trough of the recession of 1990-1991 and the trough of November 2001.

This business recovery persistently seems to move ahead just above or, in the last quarter of 2013, below “stall speed.”

Seemingly, a fairly minor perturbation could set off a chain reaction, given the advanced frothiness in the stock market and softness in housing prices.

More of the Same, Worse

Neil Baroifsky was special inspector with oversight authority for the TARP during the bailout phase of the Great Recession, and currently is a partner in the Litigation Department of national law firm Jenner & Block LLP.

He’s also an author and often is called on for his opinion about developments in malfeasance writ large among the finance giants – such as the Credit Suisse settlement. In connection with a recent NPR interview, Barofsky said,

Although it is good that we averted a catastrophe back in 2008, the way that we did so I believe has unfortunately set the stage for an even more devastating financial crisis in the future.

HOBSON: In the future? How far?

BAROFSKY: Well, if I knew that, Michael Lewis would be writing his next book about people who made billions on timing the markets perfectly about me, which would be great.

(LAUGHTER)

BAROFSKY: But if you look, a lot of the same broken incentives from 2008 are still there. It’s just a question of when, not if. You can’t look at the fundamental broken incentives in the financial system and really come to a conclusion other than that we’re headed down the same dangerous path that we were that culminated in the explosion of ’08.

Barofsky’s point is readily supported by facts, such as –

The US and global financial system is even more concentrated today than in 2007, making “too big to fail”and even bigger potential problem now, than before the Great Recession. Even Alan Greenspan has taken note.

And the “pass the buck” system, whereby bond rating agencies are paid by the originators to evaluate exotic securities (“financial innovations”) created by the banking and shadow banking industries, securities which are then passed on to pension funds and hapless investors – this system appears to still be completely in place. Talk about the concept of “moral hazard.”

Global Impact

I think you get the picture.

For one reason or another, some fairly minor event is likely to set off a cascade of consequences in US and global financial markets, leading to the next recession. Probably, within one, two, or three years, as a matter of fact. Because the US Fed, and, for that matter, other central banks will still be working their way out of the last recession, there may be fewer “policy tools” to halt the stampede to sell, cutback, and so forth. Governments could respond with aggressive fiscal policy, but that option appears limited unless there are major changes in the political climate in the US and Europe.

Personally, I think wholly new directions of policy should be contemplated at the personal, local, regional, and of course at national levels.

We need to create what I have started to call “islands of stability.” This is the old idea of local self-reliance, but in new packaging. I really think there should be discussions widely across the US at least about how to decouple from the global economy and, indeed, from the financial concentrations on Wall Street. As a matter of self-preservation, until such time as more courageous national policies can be undertaken to reign in such obvious risks.
Global Economy Outlook – Some Problems

There seems to be a meme evolving around the idea that – while the official business outlook for 2014 is positive – problems with Chinese debt, or more generally, emerging markets could be the spoiler.

The encouraging forecasts posted by bank and financial economists (see Hatzius, for example) present 2014 as a balance of forces, with things tipping in the direction of faster growth in the US and Europe. Austerity constraints, sequestration in the US and draconian EU policies, will loosen, allowing the natural robustness of the underlying economy to assert itself – after years of sub-par performance. In the meanwhile, growth in the emerging economies is admittedly slowing, but is still is expected at much higher rates than in heartland areas of the industrial West or Japan.

So, fingers crossed, the World Bank and other official economic forecasting agencies show an uptick in economic growth in the US and, even, Europe for 2014.

But then we have articles that highlight emerging market risks:

China’s debtfuelled boom is in danger of turning to bust This Financial Times article develops the idea that only five developing countries have had a credit boom nearly as big as China’s, in each case leading to a credit crisis and slowdown. So currently Chinese “total debt” – a concept not well-defined in this short piece – is currently running about 230 per cent of gross domestic product. The article offers comparison with “33 previous credit binges” and to smaller economies, such as Taiwan, Thailand, Zimbabwe, and so forth. Strident, but not compelling.

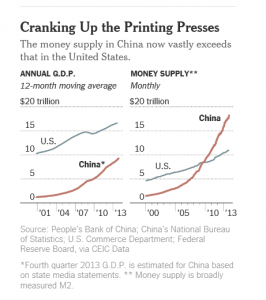
With China Awash in Money, Leaders Start to Weigh Raising the Floodgates  From the New York Times, a more solid discussion – The amount of money sloshing around China’s economy, according to a broad measure that is closely watched here, has now tripled since the end of 2006. China’s tidal wave of money has powered the economy to new heights, but it has also helped drive asset prices through the roof. Housing prices have soared, feeding fears of a bubble while leaving many ordinary Chinese feeling poor and left out.

The People’s Bank of China has been creating money to a considerable extent by issuing more renminbi to bankroll its purchase of hundreds of billions of dollars a year in currency markets to minimize the appreciation of the renminbi against the dollar and keep Chinese exports inexpensive in foreign markets; the central bank disclosed on Wednesday that the country’s foreign reserves, mostly dollars, soared $508.4 billion last year, a record increase.

 ChinaM2                 

Source: New York Times

Moreover, the rapidly expanding money supply reflects a flood of loans from the banking system and the so-called shadow banking system that have kept afloat many inefficient state-owned enterprises and bankrolled the construction of huge overcapacity in the manufacturing sector.

There also are two at least two recent, relevant posts by Yves Smith – who is always on the watch for sources of instability in the banking system

How Serious is China’s Shadow Banking/Wealth Management Products Problem?

China Credit Worries Rise as Large Shadow Banking Default Looms

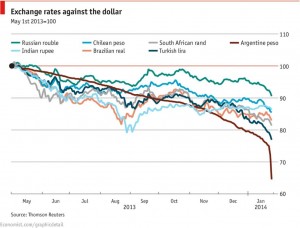
In addition to concerns about China, of course, there are major currency problems developing for Russia, India, Chile, Brazil, Turkey, South Africa, and Argentina.

emergingcurrencies

From the Economist The plunging currency club

So there are causes for concern, especially with the US Fed, under Janet Yellen, planning on winding down QE or quantitative easing.

When Easy Money Ends is a good read in this regard, highlighting the current scale of QE (quantitative easing) programs globally, and savings from lower interest rates – coupled with impacts of higher interest rates.

Since the start of the financial crisis, the Fed, the European Central Bank, the Bank of England, and the Bank of Japan have used QE to inject more than $4 trillion of additional liquidity into their economies…If interest rates were to return to 2007 levels, interest payments on government debt could rise by 20%, other things being equal…US and European nonfinancial corporations saved $710 billion from lower debt-service payments, with ultralow interest rates thus boosting profits by about 5% in the US and the UK, and by 3% in the euro-zone. This source of profit growth will disappear as interest rates rise, and some firms will need to reconsider business models – for example, private equity – that rely on cheap capital…We could also witness the return of asset-price bubbles in some sectors, especially real estate, if QE continues. The International Monetary Fund noted in 2013 that there were already “signs of overheating in real-estate markets” in Europe, Canada, and some emerging-market economies.