Tag Archives: macroeconomic forecasts

What Up? The Trump Years – I

From the standpoint of business forecasting, Donald Trump is important. His challenge to various conventional wisdoms and apparently settled matters raises questions about where things will go in 2017 and beyond. Furthermore, his style of governance is unknown, since as a businessman and minor celebrity, Trump has literally no government experience. He is an Outsider to the political scene, arriving with a portfolio of ideas like mass deportations of illegal immigrants, a massive wall between the United States and its southern neighbor, Mexico, bringing manufacturing jobs back, no further gun controls, and more rigorous screening of immigrants from the Middle East and Muslim countries.

So, with Donald Trump’s Inauguration January 20, a lot seems up in the air. But behind the hoopla, fundamental economic processes and trends are underway. What types of forecasts, therefore, seem reasonable, defensible?

Some Thoughts on Economics

Let’s start with economics.

Donald Trump could be the President who returns inflation and higher interest rates to the equation.

Offshoring and outsourcing have been factors in creating industrial wastelands and hollowed out production in the US – areas where you can drive for miles through abandoned buildings and decaying business centers. At the same time, offshoring and outsourcing bring low-cost electronics and other products to US consumers.

It is a Faustian bargain. If you were a wage-earner with a high school education (or less), supporting a family working in the “fast food sector” or convenience store, maybe holding two jobs to patch together enough income for bills – what you got was a $500 big screen TV and all sorts of gadgets for your kids. You could buy a cheap computer, and cheap clothing, too. Credit cards are available, although less so after 2008.

Oh yeah, another place you could work is in a Big Box store, whose long aisles and vanishing sakes clerks serve as the terminus of global supply chains coursing through ports on the West and East coasts. These are the ports where box-car size containers from China and elsewhere are unloaded, and put on rail cars or moved by truck to stores where consumers can purchase the goods packed in these containers largely on credit.

Is it even possible to slow, stop, or reverse this dynamic?

Let’s see, the plan for bringing manufacturing back to the United States involves deregulation of business, making doing business in the US more profitable. One idea that has been floated is that deregulation would provide incentives for US business to repatriate all that money they are holding overseas back to the US, where it could be invested in America.

Before taking office, President-elect Trump earned points with his supporters by “jawboning” US and foreign companies to keep jobs here, threatening taxes or fees for re-importing stuff to the US from newly relocated operations.

But most of the returning manufacturing would be highly capital intensive (think”robots”) so that only a few more jobs could be garnered from this re-investment in America, right?

Well, before dismissing the idea, note that some of these new jobs would be good-paying, probably requiring higher skills to run more automated production processes.

But this is a different game – producing in the United States, discouraging companies to move operations abroad to lower cost environments, placing taxes, fees, or tariffs on goods manufactured abroad coming into the US. This also involves higher prices.

There is another thread, though, to do with the impact of “deregulation” on the US oil and gas industry, aka “fracking.”

When American ingenuity developed hydraulic fracturing technology (“fracking”) to tap lower yield oil and gas reserves in areas of Texas, South Dakota, and elsewhere, US oil and gas production surged almost to the point of self-sufficiency. But then the Saudi’s lowered the boom, and oil prices dropped, making the higher cost US wells unprofitable, and slowing their expansion.

Before that happened, however, it was apparent fracking in the West and the older oil fields of the Eastern US energized activity up the supply chain, drawing forth significant manufacturing of pipes and equipment. The proverbial boom towns cropped up in the Dakotas and Texas, where hours of work could be long, and pay was good.

Clearly, as oil prices rise again with various global geopolitical instabilities, the US oil and gas industry can rise again, create large numbers of jobs and, also, significant environmental degradation – unless done with high standards for controlling wastes and methane emissions.

But Mr. Trump nominated the former Oklahoma Attorney General to head the US Environmental Protection Agency (EPA) – an agency which Mr. Trump vowed at one point in the campaign to eliminate and which his nominee Scott Pruitt fought tooth and nail in the courts.

So, concern with the environment to the winds, there is a case for a Trump “boom” in 2017 and 2018 – if global oil prices can stay above the breakeven point for US oil and gas production.

Another thread or storyline ties in here  – deportations and stronger controls over illegal immigration.

Again, we have to consider how things are actually made, and we see that, as Anthony Bourdain has noted, many of the restaurant jobs in New York City and other big cities  – in the kitchen especially – are filled by new migrants, many not here legally.

Also, scores of construction jobs in the Rocky Mountain West are filled by Hispanic workers.

Pressure on these working populations to produce their papers can only lead to higher wages and costs, which will be passed along to consumers.

And don’t forget President Trump’s promise to restore US military preparedness. As “cost-plus” contracts, US defense production acts as a conduit for price increases, and may be overpriced (the alternative being to let potential enemies manufacture US weapons).

So what this thought experiment suggests is that, initially, jobs in the Trump era may be boosted by captive or returning manufacturing operations and resumption of the US oil and gas boom – but be accompanied by higher prices. Higher prices also are thematic to limiting the labor pool in US industries, and the cost-overruns are endemic to US defense production.

This is not the end of the economics story, obviously.

The next thing to consider is the US Federal Reserve Bank, which, under Chairman Yellen and other members of the Board of Governors is itching to increase interest rates, as the US economy recovers.

Witnessing a surge of employment from fracking jobs plus a smatter of repatriation of US manufacturing, and the associated higher prices involved with all of this, the Fed should have plenty of excuse to bring interest rates back to historic levels.

Will this truncate the Trump boom?

And what about international response to these developments in the United States?
The Apostle of Negative Interest Rates

Miles Kimball is a Professor at the University of Michigan, and a vocal and prolific proponent of negative interest rates. His Confessions of a Supply-Side Liberal is peppered with posts on the benefits of negative interest rates.

March 2 Even Central Bankers Need Lessons on the Transmission Mechanism for Negative Interest Rates, after words of adoration, takes the Governor of the Bank of England (Mark Carney) to task. Carney’s problem? Carney wrote recently that unless regular households face negative interest rates in their deposit accounts.. negative interest rates only work through the exchange rate channel, which is zero-sum from a global point of view.

Kimball’s argument is a little esoteric, but promotes three ideas.

First, negative interest rates central bank charge member banks on reserves should be passed onto commercial and consumer customers with larger accounts – perhaps with an exemption for smaller checking and savings accounts with, say, less than $1000.

Second, moving toward electronic money in all transactions makes administration of negative interest rates easier and more effective. In that regard, it may be necessary to tax transactions conducted in paper money, if a negative interest rate regime is in force.

Third, impacts on bank profits can be mitigated by providing subsidies to banks in the event the central bank moved into negative interest rate territory.

Fundamentally, Kimball’s view is that.. monetary policy–and full-scale negative interest rate policy in particular–is the primary answer to the problem of insufficient aggregate demand. No need to set inflation targets above zero in order to get the economy moving. Just implement sufficiently negative interest rates and things will rebound quickly.

Kimball’s vulnerability is high mathematical excellence coupled with a casual attitude toward details of actual economic institutions and arrangements.

For example, in his Carney post,  Kimball offers this rather tortured prose under the heading -“Why Wealth Effects Would Be Zero With a Representative Household” –

It is worth clarifying why the wealth effects from interest rate changes would have to be zero if everyone were identical [sic, emphasis mine]. In aggregate, the material balance condition ensures that flow of payments from human and physical capital have not only the same present value but the same time path and stochastic pattern as consumption. Thus–apart from any expansion of the production of the economy as a whole as a result of the change in monetary policy–any effect of interest rate changes on the present value of society’s assets overall is cancelled out by the effect of interest rate changes on the present value of the planned path and pattern of consumption. Of course, what is actually done will be affected by the change in interest rates, but the envelope theorem says that the wealth effects can be calculated based on flow of payments and consumption flows that were planned initially.

That’s in case you worried a regime of -2 percent negative interest rates – which Kimball endorses to bring a speedy end to economic stagnation – could collapse the life insurance industry or wipe out pension funds.

And this paragraph is troubling from another standpoint, since Kimball believes negative interest rates or “monetary policy” can trigger “expansion of the production of the economy as a whole.” So what about those wealth effects?

Indeed, later in the Carney post he writes,

..for any central bank willing to go off the paper standard, there is no limit to how low interest rates can go other than the danger of overheating the economy with too strong an economic recovery. If starting from current conditions, any country can maintain interest rates at -7% or lower for two years without overheating its economy, then I am wrong about the power of negative interest rates. But in fact, I think it will not take that much. -2% would do a great deal of good for the eurozone or Japan, and -4% for a year and a half would probably be enough to do the trick of providing more than enough aggregate demand.

At the end of the Carney post, Kimball links to a list of his and other writings on negative interest rates called How and Why to Eliminate the Zero Lower Bound: A Reader’s Guide. Worth bookmarking.

Here’s a YouTube video.

Although not completely fair, I have to say all this reminds me of a widely-quoted passage from Keynes’ General Theory –

“Practical men who believe themselves to be quite exempt from any intellectual influence, are usually the slaves of some defunct economist. Madmen in authority, who hear voices in the air, are distilling their frenzy from some academic scribbler of a few years back”

Of course, the policy issue behind the spreading adoption of negative interest rates is that the central banks of the world are, in many countries, at the zero bound already. Thus, unless central banks can move into negative interest rate territory, governments are more or less “out of ammunition” when it comes to combatting the next recession – assuming, of course, that political alignments currently favoring austerity over infrastructure investment and so forth, are still in control.

The problem I have might be posed as one of “complexity theory.”

I myself have spent hours pouring over optimal control models of consumption  and dynamic general equilibrium. This stuff is so rarified and intellectually challenging, really, that it produces a mindset that suggests mastery of Portryagin’s maximum principle in a multi-equation setup means you have something relevant to say about real economic affairs. In fact, this may be doubtful, especially when the linkages between organizations are so complex, especially dynamically.

The problem, indeed, may be institutional but from a different angle. Economics departments in universities have, as their main consumer, business school students. So economists have to offer something different.

One would hope machine learning, Big Data, and the new predictive analytics, framed along the lines outlined by Hal Varian and others, could provide an alternative paradigm for economists – possibly rescuing them from reliance on adjusting one number in equations that are stripped of the real, concrete details of economic linkages.

Is the Economy Moving Toward Recession?

Generally, a recession occurs when real, or inflation-adjusted Gross Domestic Product (GDP) shows negative growth for at least two consecutive quarters. But GDP estimates are available only at a lag, so it’s possible for a recession to be underway without confirmation from the national statistics.

Bottom line – go to the US Bureau of Economics Analysis website, click on the “National” tab, and you can get the latest official GDP estimates. Today, (January 25, 2016) this box announces “3rd Quarter 2015 GDP,” and we must wait until January 29th for “advance numbers” on the fourth quarter 2015 – numbers to be revised perhaps twice in two later monthly releases.

This means higher frequency data must be deployed for real-time information about GDP growth. And while there are many places with whole bunches of charts, what we really want is systematic analysis, or nowcasting.

A couple of initiatives at nowcasting US real GDP show that, as of December 2015, a recession is not underway, although the indications are growth is below trend and may be slowing.

This information comes from research departments of the US Federal Reserve Bank – the Chicago Fed National Activity Index (CFNAI) and the Federal Reserve Bank of Atlanta GDPNow model.

CFNAI

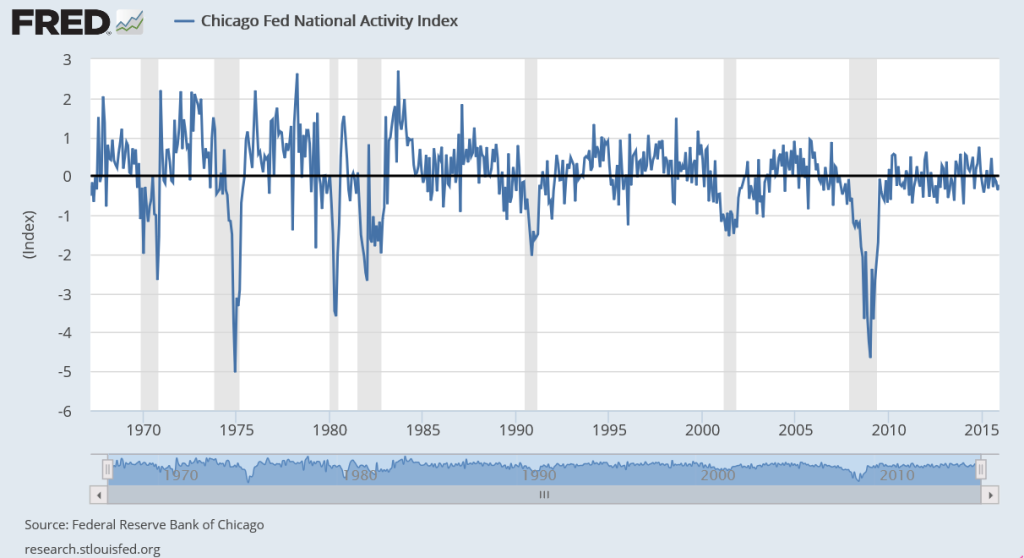
The Chicago Fed National Activity Index (CFNAI) for December 2015, released January 22nd, shows an improvement over November. The CFNAI moved –0.22 in December, up from –0.36 in November, and, in the big picture (see below) this number does not signal recession.

FREDCFNAI

The index is a weighted average of 85 existing monthly indicators of national economic activity from four general categories – production and income; employment, unemployment, and hours; personal consumption and housing; and sales, orders, and inventories.

It’s built – with Big Data techniques, incidentally- to have an average value of zero and a standard deviation of one.

Since economic activity trends up over time, generally, the zero for the CFNAI actually indicates growth above trend, while a negative index indicates growth below trend.

Recession levels are lower than the December 2015 number – probably starting around -0.7.

GDPNow Model

The GDPNow Model is developed at the Federal Reserve bank of Atlanta.

On January 20, the GDPNow site announced,

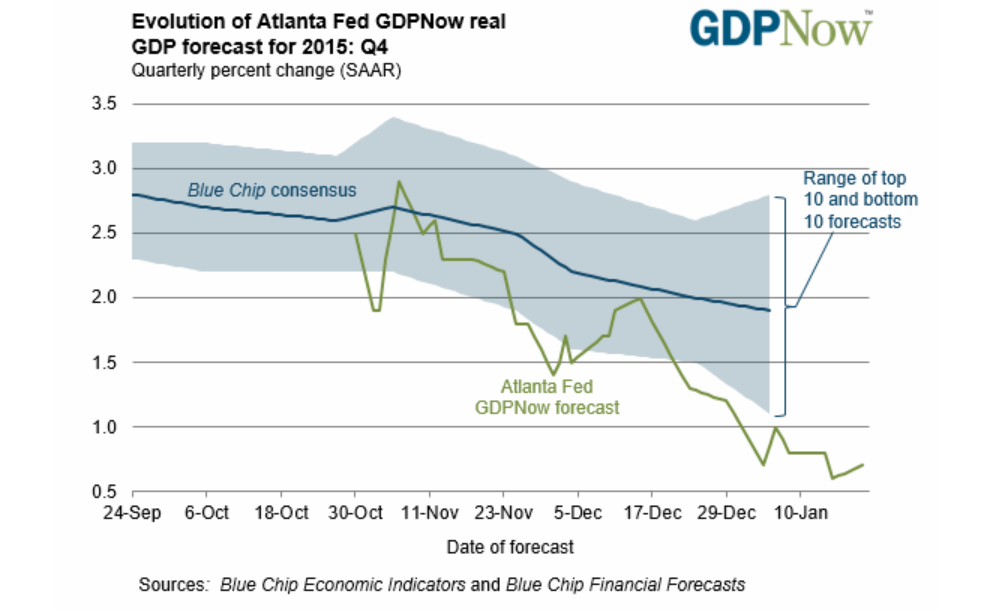
The GDPNow model forecast for real GDP growth (seasonally adjusted annual rate) in the fourth quarter of 2015 is 0.7 percent on January 20, up from 0.6 percent on January 15. The forecasts for fourth quarter real consumer spending growth and real residential investment growth each increased slightly after this morning’s Consumer Price Index release from the U.S. Bureau of Labor Statistics and the report on new residential construction from the U.S. Census Bureau.

The chart accompanying this accouncement shows a somewhat less sanguine possibility – namely that consensus estimates and the output of the GDPNow model have been on a downward trend if you look at things back to September 2015.

GDPNow

Coming Attractions

Well, I have been doing a deep dive into financial modeling, but I want to get back to blogging more often. It gets in your blood, and really helps explore complex ideas.

So- one coming attraction here is going to be deeper discussion of the fractal market hypothesis.

Ladislav Kristoufek writes in a fascinating analysis (Fractal Markets Hypothesis and the Global Financial Crisis:Scaling, Investment Horizons and Liquidity) that,

“..it is known that capital markets comprise of various investors with very different investment horizons { from algorithmically-based market makers with the investment horizon of fractions of a second, through noise traders with the horizon of several minutes, technical traders with the horizons of days and weeks, and fundamental analysts with the monthly horizons to pension funds with the horizons of several years. For each of these groups, the information has different value and is treated variously. Moreover, each group has its own trading rules and strategies, while for one group the information can mean severe losses, for the other, it can be taken a profitable opportunity.”

The mathematician and discoverer of fractals Mandelbrot and investor Peters started the ball rolling, but the idea maybe seemed like a fad of the 1980’s and 1990s.

But, more and more,  new work in this area (as well as my personal research) points to the fact that the fractal market hypothesis is vitally important.

Forget chaos theory, but do notice the power laws.

The latest  fractal market research is rich in mathematics – especially wavelets, which figure in forecasting, but which I have not spent much time discussing here.

There is some beautiful stuff produced in connection with wavelet analysis.

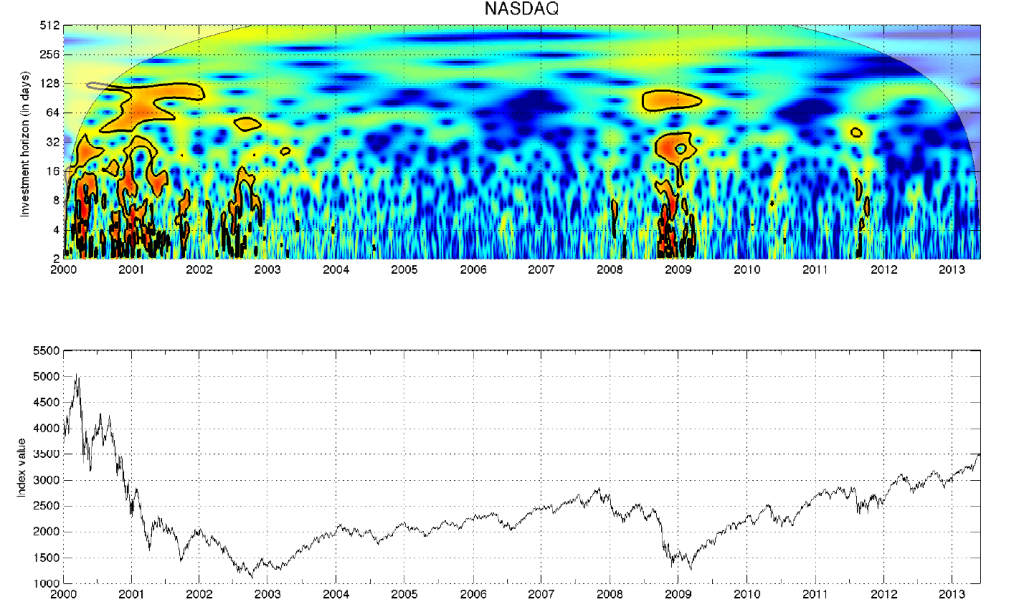
For example, here is a construction from a wavelet analysis of the NASDAQ from another paper by Kristoufek

Wavlet1

The idea is that around 2008, for example, investing horizons collapsed, with long term traders exiting and trading becoming more and more short term. This is associated with problems of liquidity – a concept in the fractal market hypothesis, but almost completely absent from many versions of the so-called “efficient market hypothesis.”

Now, maybe like some physicists, I am open to the discovery of deep keys to phenomena which open doors of interpretation across broad areas of life.

Another coming attraction will be further discussion of forward information on turning points in markets and the business cycle generally.

The current economic expansion is growing long in tooth, pushing towards the upper historically observed lengths of business expansions in the United States.

The basic facts are there for anyone to notice, and almost sound like a litany of complaints about how the last crisis in 2008-2009 was mishandled. But China is decelerating, and the emerging economies do not seem positioned to make up the global growth gap, as in 2008-2009. Interest rates still bounce along the zero bound. With signs of deteriorating markets and employment conditions, the Fed may never find the right time to raise short term rates – or if they plunge ahead will garner virulent outcry. Financial institutions are even larger and more concentrated now than before 2008, so “too big to fail” can be a future theme again.

What is the best panel of financial and macroeconomic data to watch the developments in the business cycle now?

So those are a couple of topics to be discussed in posts here in the future.

And, of course, politics, including geopolitics will probably intervene at various points.

Initially, I started this blog to explore issues I encountered in real-time business forecasting.

But I have wide-ranging interests – being more of a fox than a hedgehog in terms of Nate Silver’s intellectual classification.

I’m a hybrid in terms of my skill set. I’m seriously interested in mathematics and things mathematical. I maybe have a knack for picking through long mathematical arguments to grab the key points. I had a moment of apparent prodigy late in my undergrad college career, when I took graduate math courses and got straight A’s and even A+ scores on final exams and the like.

Mathematics is time consuming, and I’ve broadened my interests into economics and global developments, working around 2002-2005 partly in China.

As a trivia note,  my parents were immigrants to the US from Great Britain , where their families were in some respects connected to the British Empire that more or less vanished after World War II and, in my father’s case, to the Bank of England. But I grew up in what is known as “the West” (Colorado, not California, interestingly), where I became a sort of British cowboy and subsequently, hopefully, have continued to mature in terms of attitudes and understanding.

Economic Impact Modeling

I had a chance, recently, to watch computer simulations and interact with a regional economic impact model called REMI. This is a multi-equation model of some vintage (dating back the 1980’s) that has continued to evolve. It’s probably currently the leader in the field and has seen recent application to assessing proposals for increasing the minimum wage – in California, Vermont, San Francisco – and to evaluating  a carbon tax for the Citizen’s Climate Initiative  (see the video presentation at the end of this post).

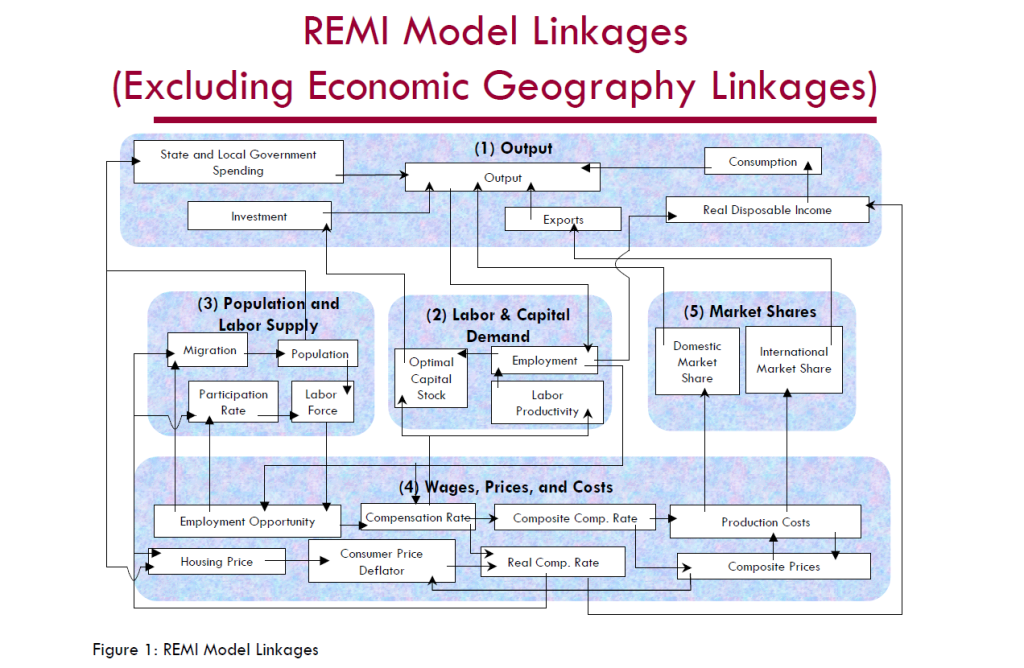
One way to interact with REMI is to click on blocks in a computer screen based on the following schematic

REMIblocs

I watched Brian Lewandowski do this at Colorado University’s Leeds School of Business.

Brian set parameters for increases in labor productivity for professional services and changes in investment in primary and secondary educational by clicking on boxes or blocks. Brian, Richard Wobbekind (pictured below), and I discussed results, and how REMI is helpful in exploring “what-if’s” and might have applications to  optimizing tax policies at the state level..

RichWobbekind

Wobbekind is himself a leader in preparing and presenting State-level forecasts for Colorado, and is active in the International Institute of Forecasters (IIF) which sponsors the International Journal of Forecasting and Foresight – as well as being an Associate Dean of CU’s Leeds School of Business.

Key Point About Multi-Equation, Multivariate Economic Models

From the standpoint of forecasting, the best way I can understand where REMI should be placed in the tool-kit is to remember the distinction between conditional and unconditional forecasts.

REMI model documentation indicates that,

The REMI model consists of thousands of simultaneous equations with a structure that is relatively straightforward. The exact number of equations used varies depending on the extent of industry, demographic, demand, and other detail in the specific model being used. The overall structure of the model can be summarized in five major blocks: (1) Output, (2) Labor and Capital Demand, (3) Population and Labor Supply, (4) Wages, Prices, and Costs, and (5) Market Shares

So you might have equations such as,

X1t = a0 + a1Z1t +..+ akZkt

X2t = b0 + b1Z1t +..+ brZrt

In order to predict unconditionally what (X1t,X2t) will be at some specific future time T*, it is necessary to correctly derive the parameters (a0,a1,..,ak,b0,b1,,…,br).

And it also is necessary, for an unconditional forecast, to predict the future values of all the exogenous variables on the right-hand side of the equation – that is all the Z variables that are not in fact X variables.

This usually means that unconditional forecasts from multivariate forecast models have wide and rapidly diverging confidence intervals.

Thus, if you try to forecast future employment in, say, California with such models, they may underperform simpler, single equation models – such as those based on exponential smoothing, for example.

This does not invalidate general systems models such as REMI.

Assuming the flows and linkages of sectors and blocks are realistic and correctly modeled, such models can help think through the consequences of policy decisions, new legislation, and infrastructure investments.

This is essentially to say that these models may present good conditional forecasts – basically “what-if’s” without being the best forecasting tool available.

Here is a video presentation based on the Citizen’s Climate Initiative application of REMI to assessing a carbon tax – an interesting proposal.

Failures of Forecasting in the Greek Crisis

The resounding “No” vote today (Sunday, July 5) by Greeks vis a vis new austerity proposals of the European Commission and European Central Bank (ECB) is pivotal. The immediate task at hand this week is how to avoid or manage financial contagion and whether and how to prop up the Greek banking system to avoid complete collapse of the Greek economy.

Greekvote

Thousands celebrate Greece’s ‘No’ vote despite uncertainty ahead

Greece or, more formally, the Hellenic Republic, is a nation of about 11 million – maybe 2 percent of the population of the European Union (about 500 million). The country has a significance out of proportion to its size as an icon of many of the ideas of western civilization – such as “democracy” and “philosophy.”

But, if we can abstract momentarily from the human suffering involved, Greek developments have everything to do with practical and technical issues in forecasting and economic policy. Indeed, with real failures of applied macroeconomic forecasting since 2010.

Fiscal Multipliers

What is the percent reduction in GDP growth that is likely to be associated with reductions in government spending? This type of question is handled in the macroeconomic forecasting workshops – at the International Monetary Fund (IMF), the ECB, German, French, Italian, and US government agencies, and so forth – through basically simple operations with fiscal multipliers.

The Greek government had been spending beyond its means for years, both before joining the EU in 2001 and after systematically masking these facts with misleading and, in some cases, patently false accounting.

Then, to quote the New York Times,

Greece became the epicenter of Europe’s debt crisis after Wall Street imploded in 2008. With global financial markets still reeling, Greece announced in October 2009 that it had been understating its deficit figures for years, raising alarms about the soundness of Greek finances. Suddenly, Greece was shut out from borrowing in the financial markets. By the spring of 2010, it was veering toward bankruptcy, which threatened to set off a new financial crisis. To avert calamity, the so-called troika — the International Monetary Fund, the European Central Bank and the European Commission — issued the first of two international bailouts for Greece, which would eventually total more than 240 billion euros, or about $264 billion at today’s exchange rates. The bailouts came with conditions. Lenders imposed harsh austerity terms, requiring deep budget cuts and steep tax increases. They also required Greece to overhaul its economy by streamlining the government, ending tax evasion and making Greece an easier place to do business.

The money was supposed to buy Greece time to stabilize its finances and quell market fears that the euro union itself could break up. While it has helped, Greece’s economic problems haven’t gone away. The economy has shrunk by a quarter in five years, and unemployment is above 25 percent.

In short, the austerity policies imposed by the “Troika” – the ECB, the European Commission, and the IMF – proved counter-productive. Designed to release funds to repay creditors by reducing government deficits, insistence on sharp reductions in Greek spending while the nation was still reeling from the global financial crisis led to even sharper reductions in Greek production and output – and thus tax revenues declined faster than spending.

Or, to put this in more technical language, policy analysts made assumptions about fiscal multipliers which simply were not borne out by actual developments. They assumed fiscal multipliers on the order of 0.5, when, in fact, recent meta-studies suggest they can be significantly greater than 1 in magnitude and that multipliers for direct transfer payments under strapped economic conditions grow by multiples of their value under normal circumstances.

Problems with fiscal multipliers used in estimating policy impacts were recognized some time ago – see for example Growth Forecast Errors and Fiscal Multipliers the IMF Working Paper authored by Oliver Blanchard in 2013.

Also, Simon Wren-Lewis, from Oxford University, highlights the IMF recognition that they “got the multipliers wrong” in his post How a Greek drama became a global tragedy from mid-2013.

However, at the negotiating table with the Greeks, and especially with their new, Left-wing government, the niceties of amending assumptions about fiscal multipliers were lost on the hard bargaining that has taken place.

Again, Wren-Lewis is interesting in his Greece and the political capture of the IMF. The creditors were allowed to demand more and sterner austerity measures, as well as fulfillment of past demands which now seem institutionally impossible – prior to any debt restructuring.

IMF Calls for 50 Billion in New Loans and Debt Restructuring for Greece

Just before to the Greek vote, on July 2, the IMF released a “Preliminary Draft Debt Sustainability Analysis.”

This clearly states Greek debt is not sustainable, given the institutional realities in Greece and deterioration of Greek economic and financial indicators, and calls for immediate debt restructuring, as well as additional funds ($50 billion) to shore up the Greek banks and economy.

There is a report that Europeans tried to block IMF debt report on Greece, viewing it as too supportive of the Greek government position and a “NO” vote on today’s referendum.

The IMF document considers that,

If grace periods and maturities on existing European loans are doubled and if new financing is provided for the next few years on similar concessional terms, debt can be deemed to be sustainable with high probability. Underpinning this assessment is the following: (i) more plausible assumptions—given persistent underperformance—than in the past reviews for the primary surplus targets, growth rates, privatization proceeds, and interest rates, all of which reduce the downside risk embedded in previous analyses. This still leads to gross financing needs under the baseline not only below 15 percent of GDP but at the same levels as at the last review; and (ii) delivery of debt relief that to date have been promises but are assumed to materialize in this analysis.

Some may view this analysis from a presumed moral high ground – fixating on the fact that Greeks proved tricky about garnering debt and profligate in spending in the previous decade.

But, unless decision-makers are intent upon simply punishing Greece, at risk of triggering financial crisis, it seems in the best interests of everyone to consider how best to proceed from this point forward.

And the idea of cutting spending and increasing taxes during an economic downturn and its continuing aftermath should be put to rest as another crackpot idea whose time has passed.

What’s Going On?

Teaching economics during Vietnam and, later, the onset of Reagan – I developed a sort of sideline patter about current events. Later, I realized this bore resemblance to a kind of global system dynamics.

Then, my consulting made these considerations more relevant – to the point that, in recent years, I make correlations between what you might call a global regional analysis and sales prospects, as well as corporate strategy.

How do you go about developing this perspective? The question is especially relevant for me now, since I am emerging from a deep dive into hands-on statistical modeling.

Well, one way to visualize this is as a series of threads through time. Each of these threads is strung with events that can turn out one way or another. There are main threads as believed to be constituted by “serious people.” The conventional view of things, if you will. There also are many outliers, story lines which incorporate unusual, perhaps foreboding developments. I guess you could think of these threads as scenarios, too. A whole bunch of movie scripts about how the future is going to unfold.

Now before getting into specifics, let me make what might be considered an obscure remark, but one relevant to forecasting. What you want to do is disentangle and identify as many of these threads as you have the energy to consider, and then, watch for convergences. If there are several ways, in other words, for some events to become manifested, these events become more likely.

One of the things this methodology accommodates is a fact that it seems to me that many people overlook or downplay. This is that there can be really fundamental differences between how different groups of people, perhaps with different interests or things to gain or lose out of situations, look at things.

One of the clearest examples, perceptually, is the arrow illusion.

arrowillusion

So this is one reason why I try to glean perspectives from all over – including heterodox and contrarian views.

Noone at this point can convince me this is not a good practice, even though it may make those who busy themselves with thought control (“reality construction”) uncomfortable.

For example, many years ago, I was sitting at my father’s breakfast nook glancing at some books he had recently bought, and I found Andrei Amalrik’s Will the Soviet Union Survive Until 1984? What a preposterous idea, it seemed to me. Collapse of the Soviet Union.

It pays to look at heterodox views, even if only a few of these will have any relevance to the future.

Some Specifics

Well, today we have the internet – a font of views of all types.

In thinking about developing this and its successors on the same or similar topics this morning, I first turned to Zero Hedge. From Wikipedia,

Zero Hedge is a financial blog that aggregates news and presents editorial opinions from original and outside sources. It has been described as offering a “deeply conspiratorial, anti-establishment and pessimistic view of the world”… It reports on economics, Wall Street, and the financial sector and is credited with bringing the controversial practice of flash trading to public attention in 2009 via a series of posts alleging that Goldman Sachs’ access to flash order information allowed it to gain unfair profits. The news portion of the site is written by a group of editors who collectively write under the pseudonym “Tyler Durden”, a character from the novel and film Fight Club.

Since I have been out of the loop for a while, the litany of shocking or bad news on this site does not bother me yet.

Some of the headings include:

Iran Forces Seize US Cargo Ship With 34 People On Board, Al Arabiya Reports

West Baltimore In Ashes: A Night Of Violence And Looting In Photos

Stocks Soar On Non-War, Bad-News-Is-Good-News V-Shaped Recovery

Well, I’m not sure what to make of all that. Conflict is increasing. War and riot memes.

Another site I frequently turn to, quite frankly, is Naked Capitalism, and, in particular, Links assembled by “Yves Smith” and others. Today, these range over topics like the Greek-European Union negotiations and the threat of an exit of Greece from the Eurozone, the TPP (trans-Pacific Partnership secret trade bill), Yemen and Syria, and a reference to a new and important report from MIT about the decline in US science spending –The Future Postponed.

I also consult what I would call “libertarian” financial blogs such as Mish Shedlock’s Global Economic Trend Analysis.

Then, I guess, after surveying these “oppositional views,” I turn to official forecasts and publications of US and European banks and financial institutions, as well as central banks.

I’ve given play to JP Morgan forecasters here, as well as Bloomberg’s list of leading macroeconomic forecasters.  It is always good to try to keep tabs on the latest sayings of these celebrity forecasters.

The Bank of England Financial Stability Report, most recently issued December 2014, is a relevant publication.

I also tend to look at, but basically discount, sources such as the Survey of Professional Forecasters, assembled by the Philadelphia Federal Reserve Bank. The record of macroeconomic forecasting is truly abysmal. But, apart from turning points, there may be value in tracking the projected movement of indicators and their trends.

The Central Issue

I have not mentioned slowing of the Chinese economy in the above discussion or several other megatrends, but let me move on to a key pivot for the next few years.

Business expansions never last forever. The current expansion, perhaps because it began so slowly, has sustained for a relatively long time already.

Another key point is that many central banks have pushed interest rates to near the zero bound, and they remain historically very low.

Frankly, it challenges my capabilities to imagine a future in which interest rates sort of disappear as key economic factors – although this may be a thread we need to consider. The attack on cash and movement to purely electronic money could be part of this, with negative interest rates entering the picture in a real way.

But assuming that does not happen, central banks will have to encourage higher interest rates, and that will have wide-ranging effects on business, it seems certain. There are many tangible forecasting problems associated with this prospective development.

I have to believe this is the central issue at present. How can the US Federal Reserve, for example, move off the zero bound for the federal funds rate, when the US economic recovery should, according to historical patterns, be moving toward its final months or years?

There are other tough issues – in the Middle East, the Ukraine, climate change, and so forth – but, as an economic or business forecaster, I have to believe this tension between normal banking practice and the business cycle is fundamental.

In any case, I want to return to putting up business forecasts, including longer term scenarios, in addition to carrying forth with my stock market forecasting experiment.

The Gift of Low Oil Prices

Oil May Drop top $20 a Barrel

At the end of last week, Anatole Kaletsky wrote an insightful piece for Reuters – The reason oil could drop as low as $20 per barrel.

Kaletsky writes,

There are several reasons to expect a new trading range as low as $20 to $50, as in the period from 1986 to 2004. Technological and environmental pressures are reducing long-term oil demand and threatening to turn much of the high-cost oil outside the Middle East into a “stranded asset” similar to the earth’s vast unwanted coal reserves. Additional pressures for low oil prices in the long term include the possible lifting of sanctions on Iran and Russia and the ending of civil wars in Iraq and Libya, which between them would release additional oil reserves bigger than Saudi Arabia’s on to the world markets.

The U.S. shale revolution is perhaps the strongest argument for a return to competitive pricing instead of the OPEC-dominated monopoly regimes of 1974-85 and 2005-14. Although shale oil is relatively costly, production can be turned on and off much more easily – and cheaply – than from conventional oilfields. This means that shale prospectors should now be the “swing producers” in global oil markets instead of the Saudis. In a truly competitive market, the Saudis and other low-cost producers would always be pumping at maximum output, while shale shuts off when demand is weak and ramps up when demand is strong. This competitive logic suggests that marginal costs of U.S. shale oil, generally estimated at $40 to $50, should in the future be a ceiling for global oil prices, not a floor.

As if in validation of this perspective, Sheik Ali al-Naimi, the Saudi Oil Minister, is quoted in an interview at the beginning of this week

“It is not in the interest of Opec producers to cut their production, whatever the price is … Whether it goes down to $20, $40, $50, $60, it is irrelevant.”

Also, Mr Naimi said that if Saudi Arabia reduced its production, “the price will go up and the Russians, the Brazilians, US shale oil producers will take my share”.

Higher Cost Oil Producers Impacted

Estimates of the cost to the Saudi’s for extracting their oil out of the ground seem to be plummeting, along with the spot price of a barrel of crude. The above interview cited by the Financial Times also asserts that Saudi and other Gulf States can extract at $4-$5 a barrel.

That is an order of magnitude less than the production costs of oil from many US shale plays, much of the North Sea oil supplying revenues to Norway and the UK, as well as Russian and Iranian oil.

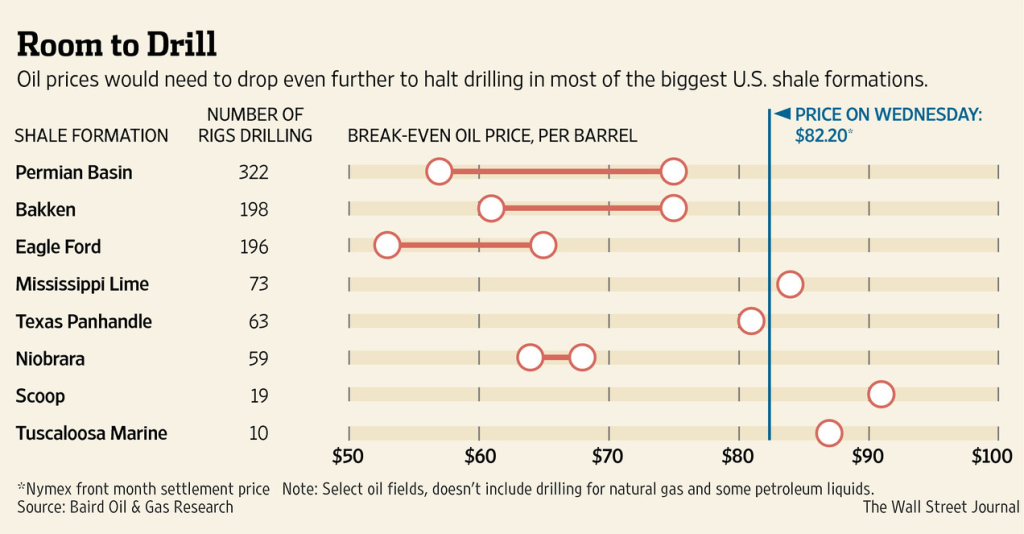
Here is a chart from the Wall Street Journal from late October of this year, estimating production costs in US shale oil plays (click to enlarge).

USSalePC

The rig count has been dropping, but many expect US shale oil production to continue increasing, as companies optimize existing wells and drill as long as already secured futures contracts cover output.

Given the low growth to deflationary profile in the global economy, this probably means a glut of petroleum on world markets for 2015 and, possibly, 2016.

Implications of a Period of Significantly Lower Oil Prices

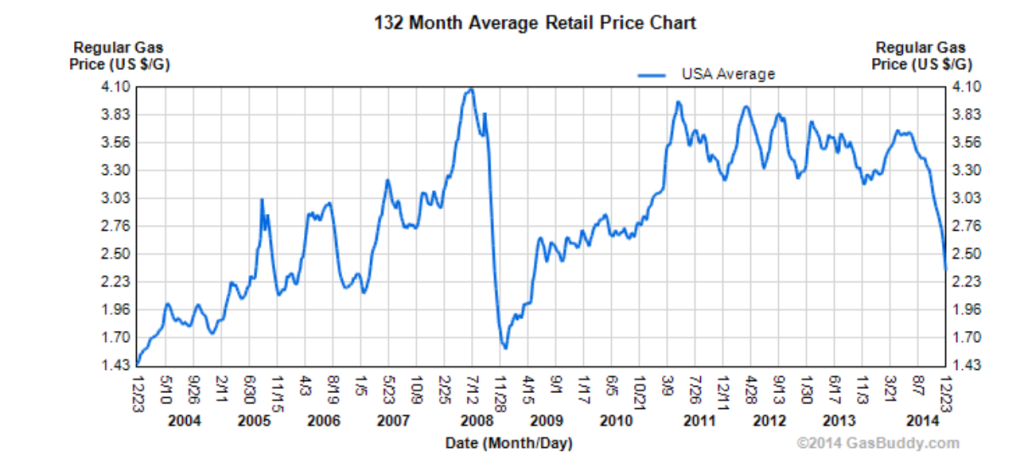
The price of gasoline at the pump in the US is plummeting.

regulargasprice

First-order effects for the American consumer probably more than balance the short-run negative impacts of cutbacks in the oil or shale patch. The typical household gets on the order of $100 extra in their pocket monthly, as long as the low prices continue. This is discretionary money that would have in all likelihood be spent anyway. So other products will benefit, plus people will drive more. It’s as simple as that.

China may be a major beneficiary, since its production is relatively energy-intensive and it is a net importer of petroleum products.

Japan should also benefit significantly.

In Japan, which imports energy (all at prices based on crude oil) worth roughly 6% of GDP, the recent sharp price drop could lift real GDP growth by 1.5%–2%! This would largely offset the 3% hike in VAT imposed last year – or justify the second round 2% hike that was just cancelled. The drop in oil prices may save Abe short term, but it will also put at risk both the 3% inflation goal and the need to turn nuclear facilities back on.

Going Out on a Limb – Business Forecast Blog Prediction

OK, so I’m going out on a limb here and make the following prediction.

As long as there is no banking collapse, as a result of oil companies turning the junk bonds that financed their land purchases into true junk, or the Russian economy collapsing, dragging down the European banking system – all bets are off for a recession in 2015 and probably 2016.

These low oil prices are like a gift to many of the world’s economies, as well as many families reliant on the internal combustion engine to get them to and from work. Low oil prices also should help keep the cost of agricultural products down, again benefitting consumers.

My intuition is that this is a real game changer.

Top graphic from Wall Street Daily

The Limits of OPEC

There’s rampant speculation and zero consensus about the direction OPEC will take in their upcoming Vienna meeting, November 27.

Last Friday, for example. Bloomberg reported,

The 20 analysts surveyed this week by Bloomberg are perfectly divided, with half forecasting the Organization of Petroleum Exporting Countries will cut supply on Nov. 27 in Vienna to stem a plunge in prices while the other half expect no change. In the seven years since the surveys began, it’s the first time participants were evenly split. The only episode that created a similar debate was the OPEC meeting in late 2007, when crude was soaring to a record.

Many discussions pose the strategic choice as one between –

(a) cutting production to maintain prices, but at the cost of losing market share to the ascendant US producers, and

(b) sustaining current production levels, thus impacting higher-cost US producers (if the low prices last long enough), but risking even lower oil prices – through speculation and producers breaking ranks and trying to grab what they can.

Lybia, Ecuador, and Venezuela are pushing for cuts in production. Saudi Arabia is not tipping its hand, but is seen by many as on the fence about reducing production.

I’m kind of a contrarian here. I think the sound and fury about this Vienna meeting on Thanksgiving may signify very little in terms of oil prices – unless global (and especially Chinese) economic growth picks up. As the dominant OPEC producer, Saudi Arabia may have market power, but, otherwise, there is little evidence OPEC functions as a cartel. It’s hard to see, also, that the Saudi’s would unilaterally reduce their output only to see higher oil prices support US frackers continuing to increase their production levels at current rates.

OPEC Members, Production, and Oil Prices

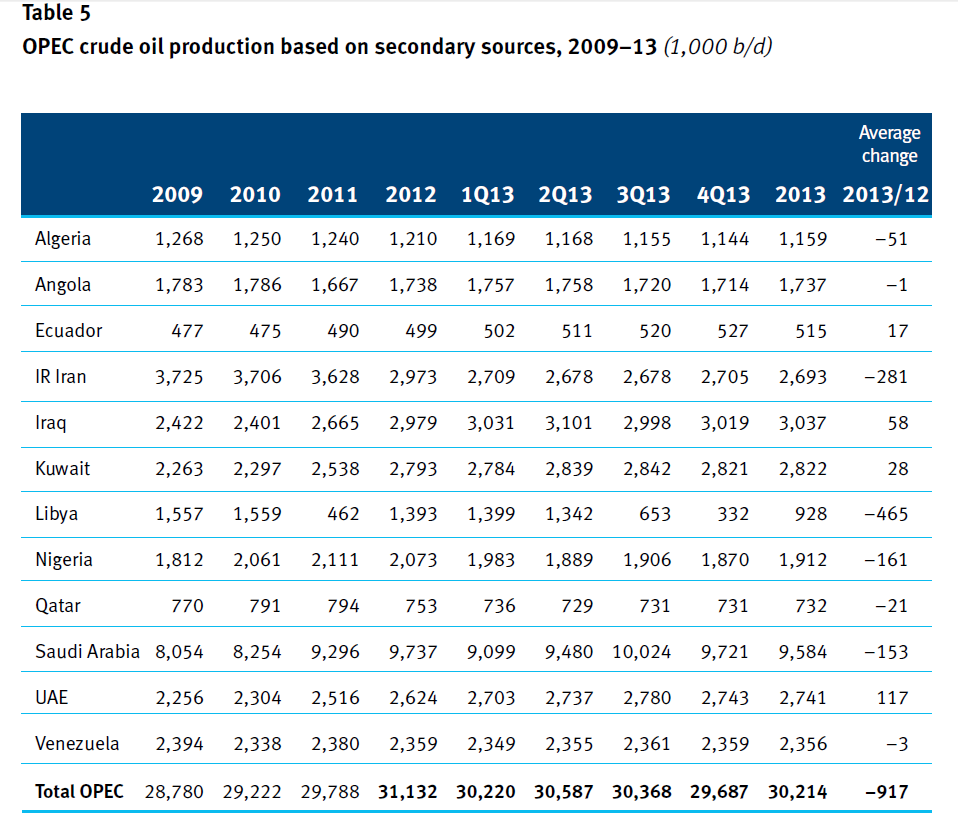
The Organization of Petroleum Exporting Countries (OPEC) has twelve members, whose production over recent years is documented in the following table.

OPECprod

According to the OPEC Annual Report, global oil supply in 2013 ran about 90.2 mb/d, while, as the above table indicates, OPEC production was 30.2 mb/d. So OPEC provided 33.4 percent of global oil supplies in 2013 with Saudi Arabia being the largest producer – overwhelmingly.

Oil prices, of course, have spiraled down toward $75 a barrel since last summer.

WTIchart

Is OPEC an Effective Cartel?

There is a growing literature questioning whether OPEC is an effective cartel.

This includes the recent OPEC: Market failure or power failure? which argues OPEC is not a working cartel and that Saudi Arabia’s ideal long term policy involves moderate prices guaranteed to assure continuing markets for their vast reserves.

Other recent studies include Does OPEC still exist as a cartel? An empirical investigation which deploys time series tests for cointegration and Granger causality, finding that OPEC is generally a price taker, although cartel-like features may adhere to a subgroup of its members.

The research I especially like, however, is by Jeff Colgan, a political scientist – The Emperor Has No Clothes: The Limits of OPEC in the Global Oil Market.

Colgan poses four tests of whether OPEC functions as a cartel -.

new members of the cartel have a decreasing or decelerating production rate (test #1); members should generally produce quantities at or below their assigned quota (test #2); changes in quotas should lead to changes in production, creating a correlation (test #3); and members of the cartel should generally produce lower quantities (i.e., deplete their oil at a lower rate) on average than non-members of the cartel (test #4)

Each of these tests fail, putting, as he writes, the burden of proof on those who would claim that OPEC is a cartel.

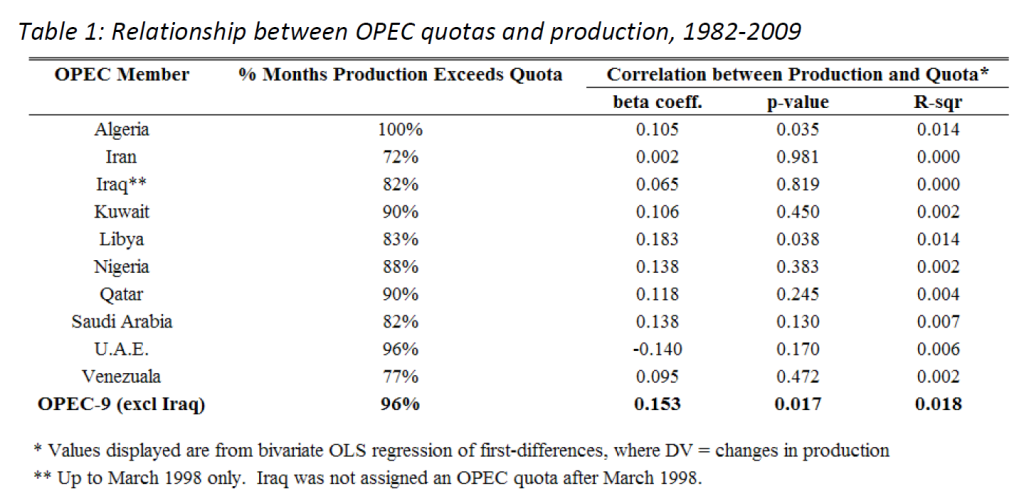
Here’s Colgan’s statistical analysis of cheating on the quotas.

OPECquota

On average, he calculates that the nine principal members of OPEC produced 10 percent more oil than their quotas allowed – which is equivalent to 1.8 million barrels per day, on average, which is more than the total daily output of Libya in 2009.

Finally, there is the extremely wonkish evidence from academic studies of oil and gas markets more generally.

There are, for example, several long term studies of cointegration of oil and gas markets. These studies rely on tests for unit roots which, as I have observed, have low statistical power. Nevertheless, the popularity of this hypothesis seems to be consistent with very little specific influence of OPEC on oil production and prices in recent decades. The 1970’s may well be an exception, it should be noted.

We will see in coming weeks. Or maybe not, since it still will be necessary to sort out influences such as quickening of the pace of economic growth in China with recent moves by the Chinese central bank to reduce interest rates and keep the bubble going.

If I were betting on this, however, I would opt for a continuation of oil prices below $100 a barrel, and probably below $90 a barrel for some time to come. Possibly even staying around $70 a barrel.

Some Thoughts on Japan

I saw the news that Japan has fallen into recession again. This “hit the wires” just after the Bank of Japan surprised everyone and announced a major new quantitative easing (QE) program.

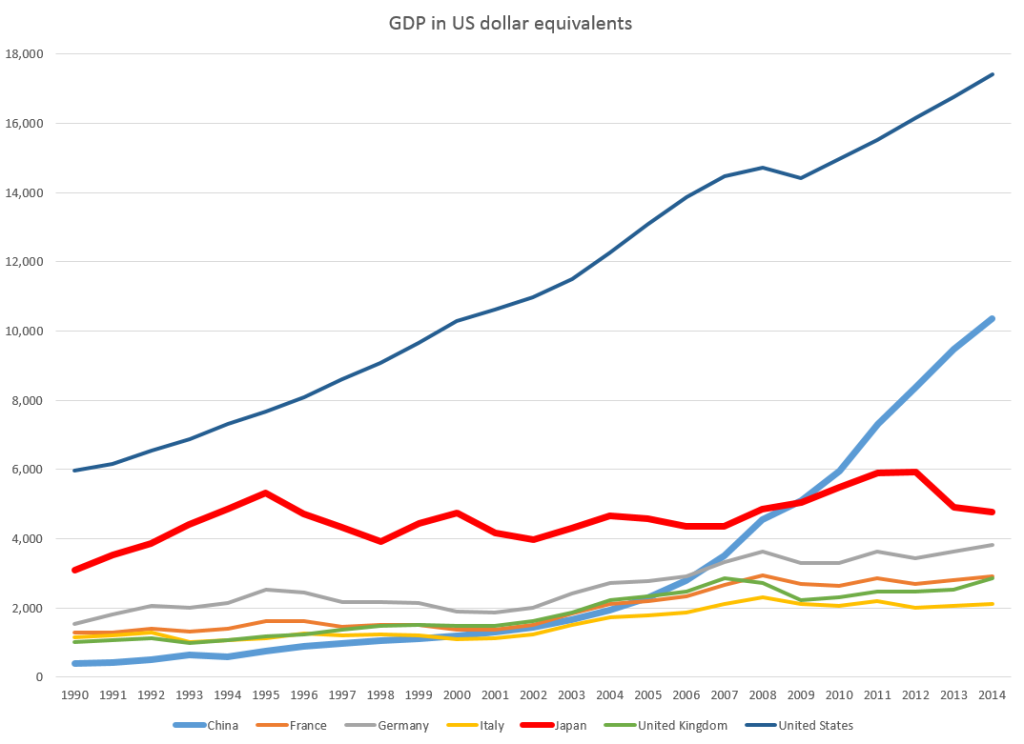
Japan is a country of 127 million persons (2013) with one of the largest economies in the world, as this chart shows.

countryGDP

Basically, though, the Japanese economy has been a start/stop mode since the mid-1990’s. According these GDP estimates, China surpassed Japan 2008-2009, and now in nominal terms has a production level twice that of Japan.

The data are from the World Economic Outlook database (IMF) and are not inflation-adjusted, but are converted into US dollar equivalents.

Where’s the Beef?

Well, a person In Kansas might say, “So what?” Why is Japan important?

I think there are several reasons.

First, a recession in Japan, because of its continuing economic size, has the capability of affecting global markets.

According to the CIA Factbook .. on a purchasing power parity (PPP) basis that adjusts for price differences, Japan in 2013 stood as the fourth-largest economy in the world after second-place China, which surpassed Japan in 2001, and third-place India, which edged out Japan in 2012.

Simultaneous recessions in Japan and Europe almost surely would trigger a global economic slowdown, unless the American consumer just went crazy.

Test Case for Macroeconomic Policy

Another reason Japan is important is as a sort of test case for macroeconomic policy, as well as for the impacts of an aging population.

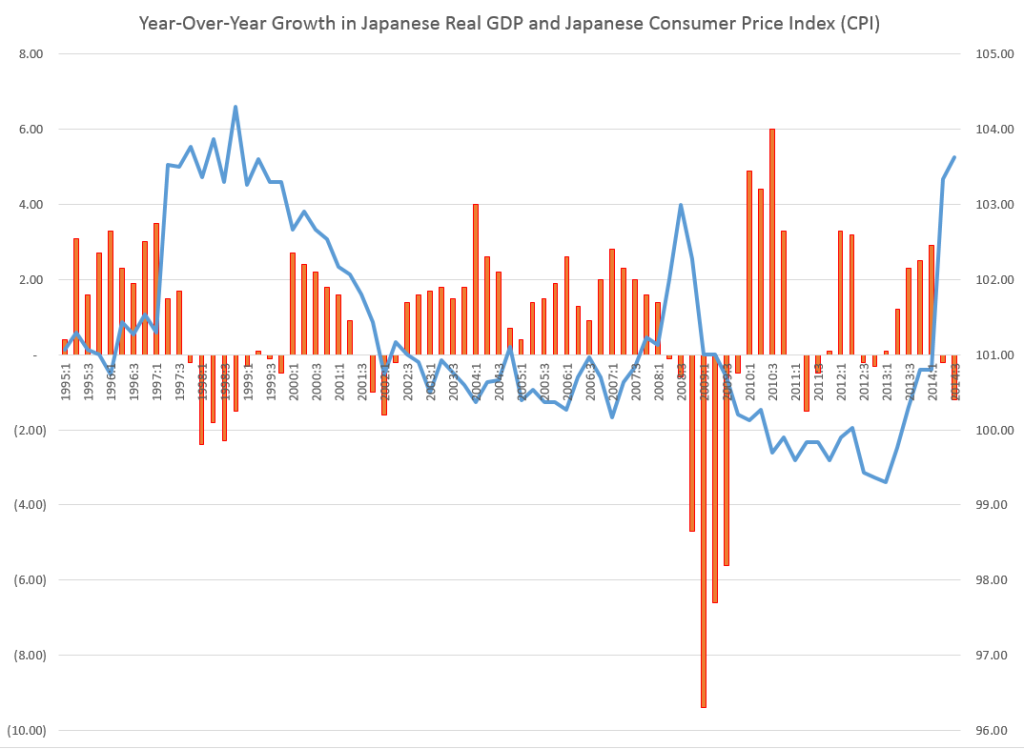
This chart shows the intermittent economic growth in Japan since the 1990’s along with the deflationary trend.

JapanrGDPCPI

These figures are developed from official Japanese statistics.

Notice that you could start at around 1999 and draw a trendline for the Japanese CPI to about 2013, where a brief period 2008-2009 would appear as a blip away from this trendline.

Deflation has been a twenty year phenomena in Japan, and the current government, under Abe, has sought to break its hold with a triple-threat of fiscal policy, monetary policy, and structural reform.

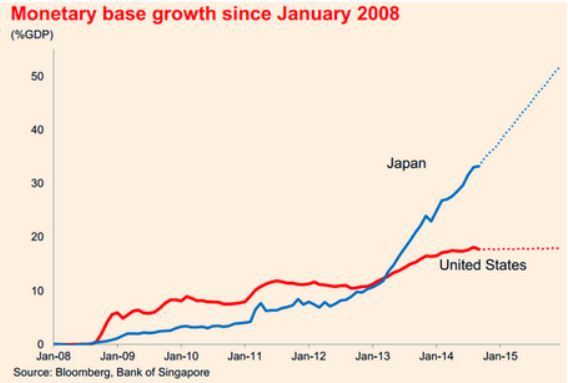
The result is a continuation of the climb in the liabilities to GDP ratio of the Bank of Japan (BOJ), as shown in this chart extracted from Bloomberg sources.

Japmonebasedelta

So “steady as she goes,” the monetary base of Japan will reach about 50 percent of Japanese GDP within a year or two. This compares with a figure of just less than 20 percent for the United States.

The swing into negative growth in 2014 was triggered by a substantial increase in the VAT or value-added tax in Japan, and there is vigorous debate about future increases – viz Krugman Japan on the Brink.

Structural Reform

I wonder whether it might be better to question the religion of economic growth, than to attempt “structural reform” aka reductions in the real wage.

In any case, it easy to see that the recent surge in Japanese inflation, combined with additional consumption taxes and, indeed, negative economic growth mean that Japanese real wages are being reduced in real time here. Indeed Edward Hugh documents this with reference to official Japanese statistics.

But this is a slippery slope.

On the one hand, reductions in the real wage could make domestically produced Japanese goods more competitive in international markets.

On the other hand, domestic purchasing power could suffer, or, at the least, there could be a move to increasing concentrations of wealth. We’ve certainly seen that in the United States, where the real wage of workers has declined off and on, since 1971, compensated for, to an extent, by the entry of women into the workforce and two-wage households.

The limits of human intellect can be found right here. The enormous production growth in China has been accompanied by choking air pollution which, I can assure you from personal experience, is simply amazingly bad sometimes. Health-threatening. Yet the Chinese naturally want to expand their productive apparatus to the extent they can, for purposes of providing for their vast population and in order to secure China’s place in the global economy.

But life in Japan – during these decades when economic growth has been very intermittent and prices have dropped – life has been fairly good. That’s one reason why many Japanese are now starting to enjoy their older years in a degree of relative comfort unimaginable one or two generations ago.

Maybe some Japanese visionary can come up with a sequel to Herman Daly’s steady state economy idea – a kind of reverse mortgage for an entire economy perhaps.